
Hemoglobin concentration is central to the assessment of anemia, but its interpretation depends on both the population being evaluated and the measurement procedure used. Diagnostic thresholds describe concentration-based classifications; they do not by themselves establish the accuracy of the laboratory procedure producing the result [1]. When different procedures are used for the same patient, discrepancies may complicate the interpretation of a value close to a clinical decision threshold or a change observed during follow-up. The World Health Organization’s 2024 guideline updates recommendations on hemoglobin-based anemia assessment and measurement in individuals and populations [2]. This guidance reinforces the importance of the measurement context when interpreting a reported concentration.
Hemoglobin can be estimated using visual color comparison, reagent-based photometry, or automated hematology systems. These approaches differ in their chemistry, instrumentation, and dependence on specimen handling and operator technique [3]. In Sahli’s method, hemoglobin is converted to acid hematin and assessed by visual matching against a comparator. The cyanmethemoglobin method uses a stable hemoglobin derivative measured photometrically and has an established role in reference hemoglobinometry when implemented with appropriate standards and traceability [4]. A direct comparison of Drabkin’s and Sahli’s methods was previously reported by Balasubramaniam and Malathi [5]. Nevertheless, a method’s general analytical principle does not verify the performance of a particular implementation in a particular laboratory.
Studies comparing hemoglobin procedures have also shown why specimen type and measurement context must be considered. Sari et al. examined the estimation of anemia prevalence using three approaches [6]. Neufeld et al. found differences associated with both the analytical method and venous versus capillary sampling [7]. Such findings support evaluating the actual procedures and specimens intended for use rather than assuming that performance reported in another setting transfers unchanged.
Three questions should be distinguished in a method-comparison study: whether mean results differ, how widely paired results differ for individual specimens, and whether those differences are acceptable for the intended clinical purpose. Tests of mean differences address the first question, while rank-based tests assess other distributional features; neither establishes clinical agreement or equivalence. Bland–Altman analysis describes paired differences and their dispersion [8], while CLSI EP09 provides guidance on comparison experiments and bias estimation using patient samples [9].
The present reanalysis evaluates the distribution, mean differences, and agreement of three hemoglobin procedures reported for the same 50 blood samples. The automated analyzer is treated as a comparator, without assuming that it provides error-free reference values. The contribution is an exploratory assessment of the paired measurements, including their sensitivity to influential observations. Accuracy, repeatability, processing speed, and cost-effectiveness are not designated outcomes because the information required to estimate them is unavailable.
This study reanalyzes the laboratory dataset tabulated in an earlier version of this manuscript, entitled Comparative Study of Hemoglobin by Three Different Methods, by Sanjeev Ahirwar, Md Masud Azahar, and Aalema Khan. The 50 records in Table 1 of that source manuscript constitute the sole sample dataset for the present paper. They are reproduced in Table 6; a source-provenance note and machine-readable data accompany the analysis. Reanalysis here denotes the revised statistical examination of these existing measurements. No additional participant observations were collected or combined with them.
The source manuscript identified the setting as the Hematology Laboratory of LN Paramedical College, Bhopal, Madhya Pradesh, India, and described venous blood samples collected using EDTA as an anticoagulant. Each record contains age, sex, and one hemoglobin result from each of three procedures. The analysis assumes independence between sample records while preserving the pairing of measurements within each record. A participant identifier linking records across visits was unavailable, so independence at the participant level could not be assessed.
All 150 hemoglobin values were retained without correction, imputation, or exclusion in the principal analyses. The record identifiers were preserved, and the redundant name field containing only the character “x” was omitted. The Sahli’s section of the source manuscript expressed hemoglobin in g%, denoting grams per 100 mL, and its summary table reported means for all three procedures in g/dL. Those concentration notations are numerically equivalent. Accordingly, this analysis uses g/dL throughout without numerical conversion. The source table’s abbreviated Sahli’s label contained only a percent sign, so the interpretation is based on the accompanying text and summary rather than on an independently verified instrument scale. Comparisons involving Sahli’s method remain conditional on that interpretation.
The sample size is the number of complete records available for this analysis. Study dates, recruitment procedures, eligibility criteria, the recruitment denominator, and any prospective sample-size calculation were not documented in the source manuscript. Consequently, the dataset is treated as exploratory rather than as a powered equivalence or diagnostic-accuracy study. Clinical diagnoses, pregnancy status, treatment history, and other participant characteristics were not available for analysis.
The reported manual procedure was Sahli’s method, in which blood is combined with 0.1 N hydrochloric acid to form brown acid hematin and the diluted preparation is visually matched to the hemoglobinometer’s reference comparator. This description identifies the analytical principle; it does not establish the repeatability of the readings. Visual comparison, volume measurement, reaction time, and comparator condition are relevant procedural factors [3].
The source manuscript described the use of Drabkin’s reagent and absorbance measurement at 540 nm. Ferricyanide oxidizes hemoglobin to methemoglobin, which reacts with cyanide to form cyanmethemoglobin. The measured absorbance is related to concentration through the standard or calibration procedure [4]. The source described this as a semi-automatic method, but the photometer and its degree of automation were not identified. Accordingly, the procedure is identified by its chemical method name.
The third result was obtained using an automated hematology analyzer, identified in the source dataset only as “5-Part.” This designation is insufficient to identify the hemoglobin measurement chemistry. Automated hemoglobin channels generally use photometric measurement after cell lysis; cell-counting principles alone do not describe hemoglobin determination [3]. The specific manufacturer, model, reagent, and measurement wavelength were not recorded in the available documentation. This procedure serves as the comparator; its reference traceability was not established.
The available documentation does not specify specimen mixing, storage temperature, elapsed time before analysis, measurement order, operator blinding, or the number of operators. Blood and reagent volumes, dilution factors, reaction times, and instrument reporting resolution were incompletely described. Calibration records, internal quality-control results, external assessment results, instrument flags, and replicate readings were unavailable. Their absence from the available documentation does not establish that these procedures were omitted during laboratory work, but prevents their contribution to measurement differences from being assessed.
The analyses were specified after the tabulated data became available and are exploratory. Age was summarized by mean, sample standard deviation (SD), median, quartiles, and range; sex was summarized by counts and percentages. Hemoglobin distributions were summarized separately for each procedure. Sample SD was calculated using
where \(x_{ij}\) denotes the measurement for sample \(i\) by method \(j\), \(\bar{x}_j\) is the corresponding mean, and \(n=50\). These SDs describe between-sample variation and were not interpreted as analytical repeatability.
The Friedman test was used as the main omnibus rank-based comparison. A one-factor repeated-measures analysis of variance (ANOVA), with sample as the repeated unit and Greenhouse–Geisser adjustment, provided a complementary assessment of mean differences. An independent-groups ANOVA was not used because the three measurements on a sample are paired. No single omnibus test was interpreted as a test of clinical interchangeability.
For each pair of methods, mean differences were estimated and paired \(t\) tests were performed as exploratory comparisons of means. The three \(p\) values were adjusted using Holm’s procedure [10]. Exact two-sided sign tests were additionally calculated after excluding zero differences within each pair, and were Holm-adjusted as a separate family of three tests. These sensitivity tests assess directional imbalance among nonzero differences and do not test the same parameter as the paired \(t\) tests. All significance tests were two-sided with a nominal threshold of 0.05.
For methods \(A\) and \(B\), the difference and pair mean were defined as
The mean difference \(\bar d\) and conventional limits of agreement were calculated as
where \(s_d\) is the sample SD of the differences. The term “bias” is used only to denote a relative mean difference, not deviation from known true values. The interpretation of \(L\) and \(U\) as approximate 95% population agreement limits depends on the distribution and concentration dependence of the differences [8].
Scatterplots with identity lines and plots of \(d_i\) against \(m_i\) from Eq. (2) were inspected. Shapiro–Wilk tests supplemented the graphical assessment of difference distributions. Percentile bootstrap 95% confidence intervals (CIs) for the mean differences and the endpoints in Eq. (3) were generated using 20,000 resamples of the 50 complete sample records, with replacement and random seed 20260913. These are pointwise, unadjusted CIs; they are not simultaneous intervals. Resampling estimates uncertainty in the chosen statistics, but does not make normal-based agreement limits valid for a nonnormal population.
A post hoc influence analysis recalculated cyanmethemoglobin–automated differences after omitting sample 32, the largest discrepancy for that pair. This analysis was descriptive and did not replace the analysis of all 50 records. No prespecified clinical acceptance margin was documented in the available materials, and none was selected retrospectively to classify the procedures as interchangeable. Diagnostic sensitivity, specificity, and anemia prevalence were not estimated against an unverified comparator.
Calculations used Python 3.12.14, NumPy 2.3.5, SciPy 1.17.0, and pandas 2.2.3; plots used Matplotlib 3.10.8. The accompanying code reproduces the reported statistics, generated tables, and figures. Eqs. (1)–(3) define the principal descriptive calculations.
The dataset contained 27 male and 23 female sample records. Ages ranged from 18 to 60 years, with a mean of 27.64 years and a median of 25 years (Table 1). All 50 records had complete measurements for all three methods.
Table 1: Characteristics of the 50 sample records.
| Characteristic | Value |
|---|---|
| Complete paired records | 50 |
| Male, \(n\) (%) | 27 (54.0) |
| Female, \(n\) (%) | 23 (46.0) |
| Age, mean \(\pm\) SD (years) | \(27.64\pm9.35\) |
| Age, median [Q1, Q3] (years) | 25 [21, 29] |
| Age range (years) | 18–60 |
Table 2 presents the hemoglobin distributions. The automated analyzer had the highest mean concentration, followed by Sahli’s and cyanmethemoglobin methods. The automated range was 11.5–17.1 g/dL; no automated value below 11.5 g/dL was represented. The smaller SD for the automated column describes the distribution of results across these samples and does not independently establish greater precision.
Table 2: Hemoglobin concentrations by method (\(n=50\) per method). All concentration summaries are in g/dL.
| Method | Mean | Sample SD | Median | [Q1, Q3] | Range |
|---|---|---|---|---|---|
| Automated analyzer | 13.764 | 1.216 | 13.75 | [12.93, 14.48] | 11.5–17.1 |
| Cyanmethemoglobin | 13.266 | 1.378 | 13.20 | [12.33, 14.00] | 11.2–17.5 |
| Sahli’s method | 13.378 | 1.499 | 13.25 | [12.50, 14.43] | 10.6–17.3 |
Q1 and Q3 are the 25th and 75th percentiles calculated by linear interpolation. Extra decimal places in summary statistics do not imply greater instrument resolution.
Table 3: Exploratory paired comparisons. Differences are calculated as the first named method minus the second.
| Comparison | Mean difference | Bootstrap 95% CI | Paired \(t\), \(p_{\rm Holm}\) | Sign test, \(p_{\rm Holm}\) |
|---|---|---|---|---|
| Cyanmethemoglobin \(-\) automated | -0.498 | [-0.730, -0.298] | 0.000149 | \(<0.0001\) |
| Sahli’s \(-\) automated | -0.386 | [-0.674, -0.090] | 0.0252 | 0.6445 |
| Sahli’s \(-\) cyanmethemoglobin | 0.112 | [-0.154, 0.364] | 0.4112 | 0.6587 |
Mean differences and CIs are in g/dL. CIs use 20,000 paired-record bootstrap resamples and are pointwise rather than multiplicity-adjusted. Holm correction was applied separately to the three paired \(t\) tests and the three exact sign tests. The tests address different hypotheses; the sign test considers the direction of nonzero differences.
The Friedman test indicated differences among the three methods (\(\chi^2(2)=15.010\), \(p=0.000550\)). Repeated-measures ANOVA gave \(F=7.726\); with Greenhouse–Geisser \(\epsilon=0.9082\), the adjusted degrees of freedom were 1.816 and 89.000 and \(p=0.001166\). These findings were consistent with method-dependent differences in the observed dataset.
Table 3 shows the mean paired differences, bootstrap CIs, and multiplicity-adjusted tests. Cyanmethemoglobin measurements averaged 0.498 g/dL below the automated comparator, while Sahli’s measurements averaged 0.386 g/dL below it. The mean difference between Sahli’s and cyanmethemoglobin was 0.112 g/dL, with a bootstrap CI spanning zero. The paired \(t\) tests identified mean differences for each comparison with the automated analyzer, but not for Sahli’s versus cyanmethemoglobin.
For cyanmethemoglobin versus automated measurements, 40 differences were negative, eight were positive, and two were zero. The corresponding sign test remained significant after adjustment (\(p<0.0001\)). Sahli’s versus automated measurements included 29 negative and 21 positive differences; the adjusted sign-test \(p\) value was 0.6445. Thus, the lower Sahli’s mean did not imply a comparably strong imbalance in the number of lower versus higher readings. For Sahli’s versus cyanmethemoglobin, there were 21 negative, 25 positive, and four zero differences (\(p_{\rm Holm}=0.6587\)). The distinction between magnitude and direction is relevant when interpreting the paired mean results.
Figure 1 shows the paired measurements relative to the identity line. Figure 2 presents the corresponding difference plots, and Table 4 reports conventional limits and their bootstrap CIs. All three comparisons showed individual discrepancies despite relatively modest mean offsets. In particular, the small Sahli’s–cyanmethemoglobin mean difference coexisted with conventional limits extending from \(-1.761\) to \(1.985\) g/dL.
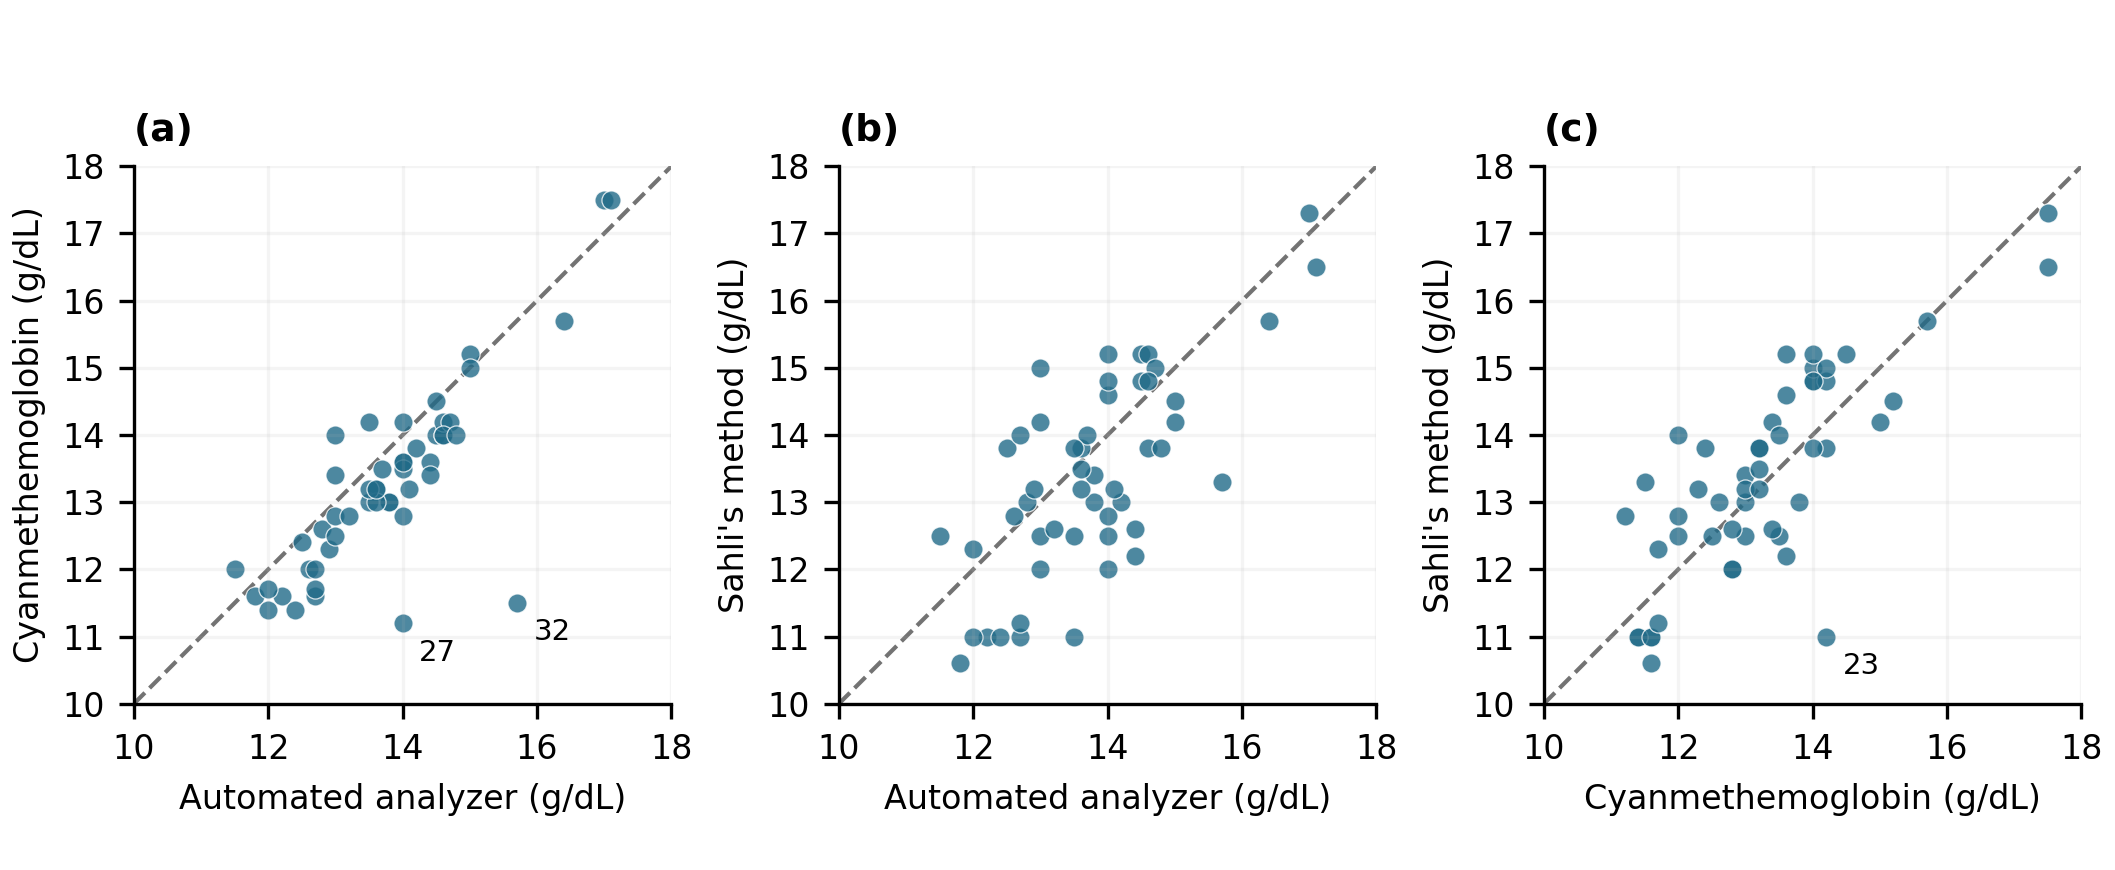
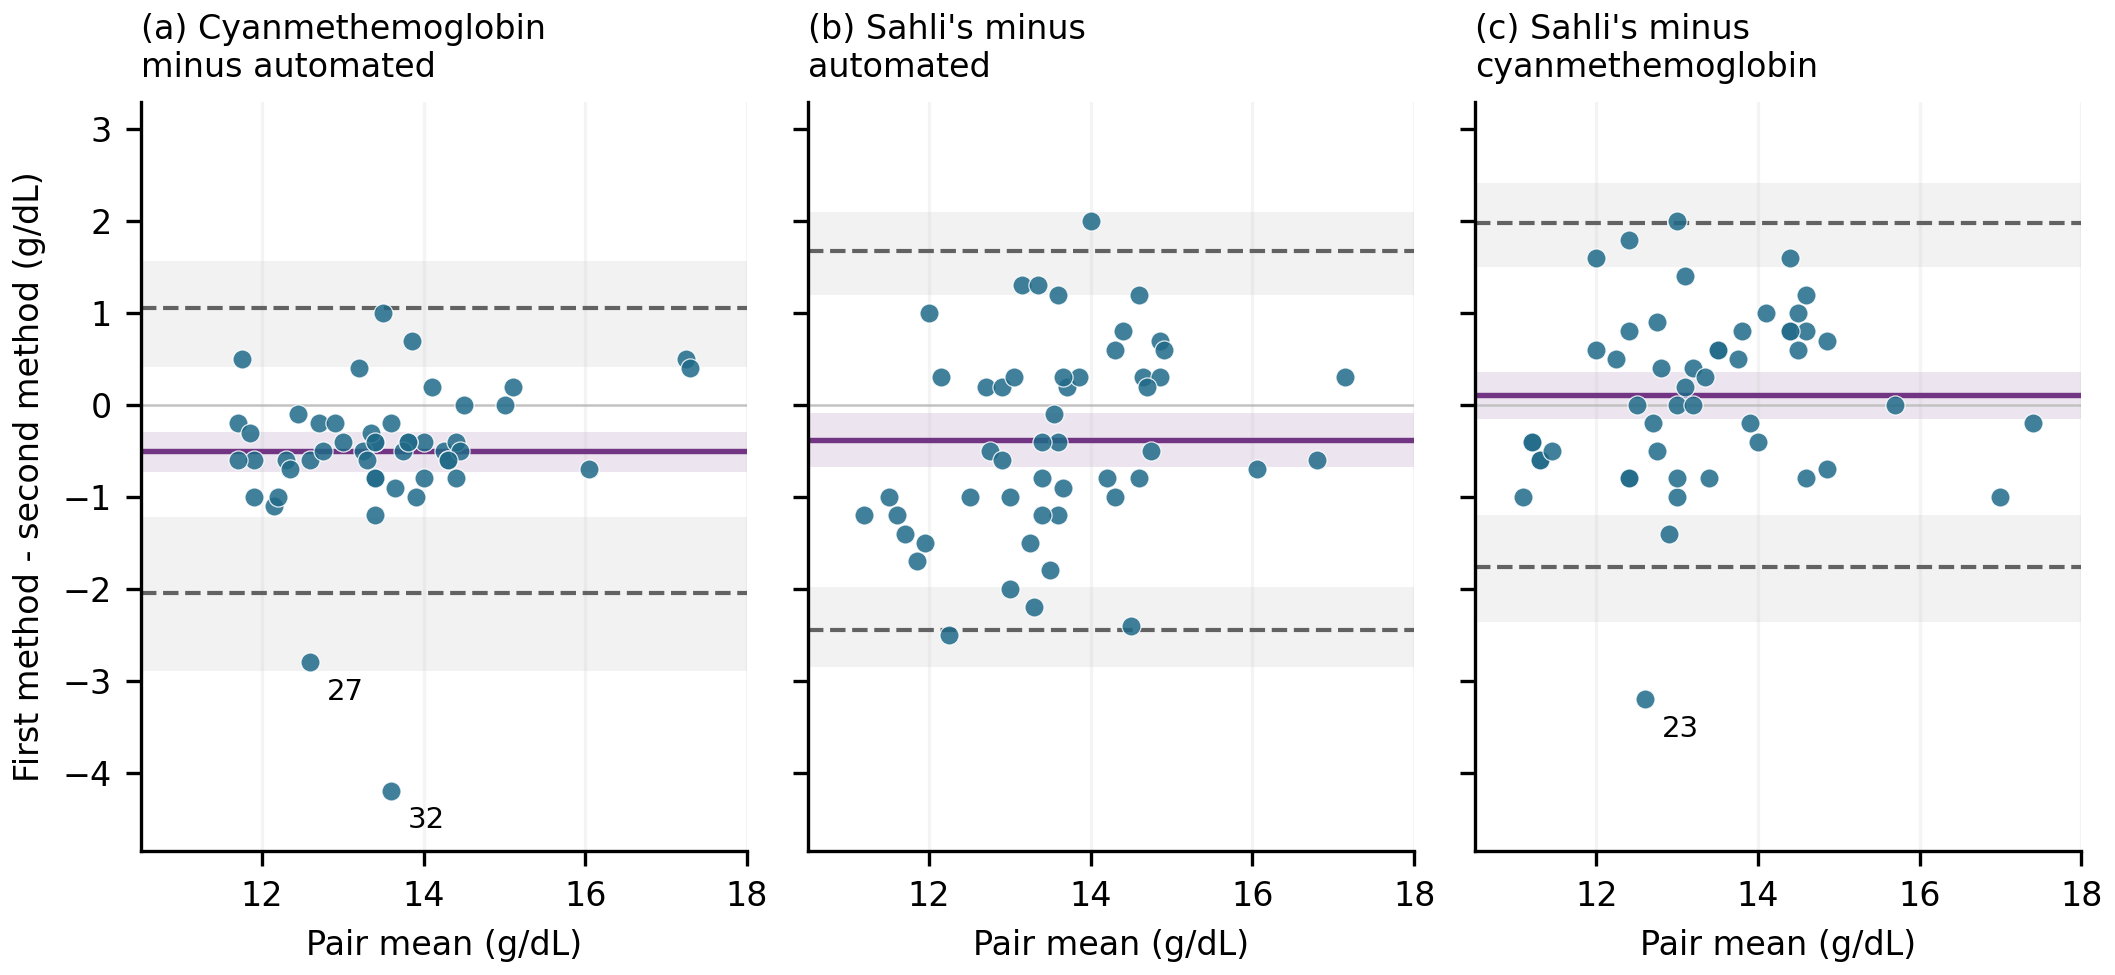
Table 4: Conventional agreement limits and pointwise bootstrap confidence intervals, in g/dL (\(n=50\)).
| Comparison | Lower limit | 95% CI for lower limit | Upper limit | 95% CI for upper limit |
|---|---|---|---|---|
| Cyanmethemoglobin \(-\) automated | -2.050 | [-2.896, -1.223] | 1.054 | [0.414, 1.568] |
| Sahli’s \(-\) automated | -2.452 | [-2.852, -1.978] | 1.680 | [1.201, 2.099] |
| Sahli’s \(-\) cyanmethemoglobin | -1.761 | [-2.361, -1.201] | 1.985 | [1.503, 2.415] |
Limits are descriptive estimates using Eq. (3). Bootstrap intervals quantify sampling uncertainty in these estimates; they do not correct the coverage limitations of normal-based limits under skewness or establish clinical acceptability.
The Shapiro–Wilk test indicated nonnormal cyanmethemoglobin–automated differences (\(W=0.778\), \(p<0.0001\)). Tests for Sahli’s–automated and Sahli’s–cyanmethemoglobin differences gave \(W=0.980\), \(p=0.5580\), and \(W=0.957\), \(p=0.0660\), respectively. Nonsignificant normality tests were not treated as proof of normality. The sparse coverage of the concentration range also limits conclusions about concentration-dependent bias or dispersion.
The largest absolute cyanmethemoglobin–automated difference occurred in sample 32: 11.5 versus 15.7 g/dL, a difference of \(-4.2\) g/dL. Sample 27 had values of 11.2 and 14.0 g/dL, respectively. For sample 23, Sahli’s and cyanmethemoglobin measurements were 11.0 and 14.2 g/dL, respectively. These discrepancies are visible in Figures 1 and 2; the available information does not identify their cause.
Table 5 contrasts the full cyanmethemoglobin–automated analysis with a descriptive analysis omitting sample 32. The mean difference changed from \(-0.498\) to \(-0.422\) g/dL, while the conventional limits narrowed from \([-2.050,1.054]\) to \([-1.579,0.735]\) g/dL. This demonstrates the observation’s influence on dispersion, without providing a basis for excluding it. The complete dataset remains the primary result.
Table 5: Post hoc influence analysis for cyanmethemoglobin minus automated measurements.
| Dataset | \(n\) | Mean | Lower | Upper |
|---|---|---|---|---|
| All samples | 50 | -0.498 | -2.050 | 1.054 |
| Omit sample 32 | 49 | -0.422 | -1.579 | 0.735 |
Mean differences and conventional lower/upper limits are in g/dL. Omission of sample 32 is a sensitivity calculation only; it is not a corrected dataset or an exclusion recommendation.
The main finding is that the three procedures yielded different hemoglobin measurements within this set of 50 samples. Cyanmethemoglobin had a lower mean than the automated comparator and lower values in most non-tied pairs. The paired mean comparison and sign test supported these respective findings. Sahli’s also had a lower mean, but the sign test did not indicate a significant directional imbalance. This difference between tests reflects their different targets and cautions against describing every lower group mean as uniformly lower readings across samples.
The agreement results provide information that the omnibus tests cannot. For example, the Sahli’s–cyanmethemoglobin mean offset was only 0.112 g/dL, yet the dispersion of individual differences was considerably larger. A nonsignificant mean comparison therefore cannot establish equivalence. Conversely, a statistically significant mean offset does not determine whether the discrepancy is clinically unacceptable. That judgment requires an intended use and an independently justified acceptance margin [8], [9]. Neither was documented sufficiently to make an interchangeability claim in this study.
The sign convention must also be preserved in interpretation. Negative cyanmethemoglobin–automated differences show lower values relative to the automated comparator; they do not establish that cyanmethemoglobin underestimated the true concentration. Although cyanmethemoglobin has a recognized role in reference hemoglobinometry, the reagent name alone does not establish traceability of the local implementation [4]. Similarly, an automated instrument cannot be assumed accurate solely because its operation is automated.
The study addresses an established comparison problem rather than introducing a new measurement technology. The direct comparison of Sahli’s and Drabkin’s methods by Balasubramaniam and Malathi provides a relevant historical precedent [5]. The present analysis characterizes the paired structure of this dataset and quantifies individual disagreement. It does not demonstrate that an intrinsic ranking of these methods applies across instruments, operators, or laboratories.
Neufeld et al. reported approximately 0.3 g/dL higher measurements with an automated spectrophotometer than with HemoCue and approximately 0.5 g/dL higher concentrations in capillary than venous specimens [7]. These results concern different analytical procedures and sampling conditions and cannot validate the offsets observed here. They illustrate, however, that method and specimen effects can both influence hemoglobin measurements. Because the source manuscript described venous EDTA samples throughout, it does not evaluate capillary collection or justify extrapolation to finger-prick field testing.
Sari et al.’s comparison of approaches to estimating anemia prevalence similarly places laboratory differences in a population-assessment context [6]. The present study has no independent anemia diagnosis or adequately characterized target population and therefore cannot determine diagnostic sensitivity or population prevalence. Broader reviews describe numerous analytical and preanalytical influences on hemoglobin measurement [3]; those influences provide possible explanations to investigate, rather than evidence that any particular error occurred in these samples.
The causes of the conspicuous discrepancies in samples 23, 27, and 32 cannot be determined from the tabulated values. Transcription, specimen identification, dilution, measurement conditions, and instrument-specific interference are possible contributors; the available data do not distinguish among them. The influence analysis shows that a single observation materially affects the estimated dispersion for cyanmethemoglobin versus automated measurements. Excluding this observation without supporting evidence would underrepresent the variability observed in the complete dataset.
The nonnormal difference distribution is especially important for conventional agreement limits. Bootstrap CIs describe the uncertainty of the calculated mean and SD-based endpoints, but resampling does not remove the assumptions underlying the limits themselves. More complete data across the intended measurement range would support assessment of whether a constant bias and constant dispersion are appropriate, and whether alternative distributional or concentration-dependent agreement models are required. No post hoc correction equation is proposed because the data do not establish a reference target or adequate calibration validity.
Neither the SD across samples nor the correlation between procedures can isolate within-method imprecision. Replicate measurements on the same specimens are needed to assess repeatability, while measurements across runs, days, or operators are needed for broader precision claims. Likewise, a meaningful efficiency comparison would require observed turnaround times and resource use. The present results identify the magnitude and pattern of differences in these records; they do not support a recommendation to adopt one method solely on the basis of its reported mean.
A strength is that all three results are available for each of the 50 sample records, permitting paired analysis without missing-value imputation. The complete numerical dataset, analysis code, confidence intervals, and figures make the statistical work reproducible. The main analysis retains the influential observations and reports their effect transparently.
Several limitations constrain interpretation. Recruitment details were unavailable, and participant-level independence could not be established. Unrecognized repeated sampling of participants could make the reported uncertainty estimates too narrow. Although the source text and summary support a common g/dL interpretation, the original Sahli’s reading scale was not independently verified. Instrument identity, calibration traceability, quality-control performance, timing, and operator conditions are incompletely documented. Only one result per method per sample is available, so repeatability and reproducibility cannot be estimated. The sample is small, comes from one reported laboratory setting, and covers a limited hemoglobin range, with no automated concentration below 11.5 g/dL. Pediatric performance and performance at substantially lower concentrations remain untested.
The analyses were developed after inspection of the existing data, and the sample-32 calculation is explicitly post hoc. Bootstrap intervals from 50 observations cannot supply information about unobserved sources of error or guarantee stability of distribution tails. No prespecified clinical acceptance margin, reference-traceability evidence, or independent diagnostic classification was available for this analysis. Consequently, the study cannot establish diagnostic accuracy, clinical interchangeability, or an economic advantage. These limitations should guide the scope of any subsequent validation work.
In an exploratory reanalysis of 50 records described as venous EDTA samples, cyanmethemoglobin and Sahli’s measurements had lower mean hemoglobin concentrations than the automated comparator. Overall differences persisted in analyses that accounted for the paired design. Individual discrepancies were substantially larger than the mean offsets, and the cyanmethemoglobin–automated comparison was influenced by marked nonnormality and a large discrepant observation. The findings support reporting method-dependent differences within the observed range, but do not establish superior accuracy, precision, speed, or clinical interchangeability. The principal contribution is a reproducible description of paired differences and their uncertainty, interpreted within the limitations of the available laboratory documentation and the assumed common measurement scale.
The data are available from corresponding author on reasonable request.
Funding is not available.
Authors declare no conflicts of interests.
AI-assisted tools were used during revision for language editing..
The sample identifiers, ages, sex labels, and all 150 measurement values in Table 6 reproduce the supplied data. The layout places records 1–25 alongside records 26–50 for readability. Numeric formatting has been standardized to one decimal place without changing any value. Units follow the common g/dL interpretation described in the Methods; the source values have not been converted.
Table 6: Complete paired hemoglobin measurements. A: automated analyzer; C: cyanmethemoglobin; S: Sahli’s method. Ages are in years. Measurement values use the common g/dL interpretation described in the Methods.
| ID | Age | Sex | A | C | S | ID | Age | Sex | A | C | S |
|---|---|---|---|---|---|---|---|---|---|---|---|
| 1 | 25 | M | 14.5 | 14.5 | 15.2 | 26 | 20 | M | 14.0 | 13.5 | 12.5 |
| 2 | 25 | M | 14.2 | 13.8 | 13.0 | 27 | 22 | M | 14.0 | 11.2 | 12.8 |
| 3 | 23 | M | 15.0 | 15.2 | 14.5 | 28 | 19 | M | 14.0 | 13.6 | 15.2 |
| 4 | 28 | M | 14.0 | 12.8 | 12.0 | 29 | 40 | F | 12.7 | 11.6 | 11.0 |
| 5 | 26 | M | 14.5 | 14.0 | 14.8 | 30 | 23 | F | 12.9 | 12.3 | 13.2 |
| 6 | 21 | F | 12.2 | 11.6 | 11.0 | 31 | 24 | M | 13.7 | 13.5 | 14.0 |
| 7 | 25 | M | 12.6 | 12.0 | 12.8 | 32 | 60 | M | 15.7 | 11.5 | 13.3 |
| 8 | 21 | F | 12.4 | 11.4 | 11.0 | 33 | 18 | F | 14.4 | 13.6 | 12.2 |
| 9 | 26 | F | 11.8 | 11.6 | 10.6 | 34 | 26 | F | 16.4 | 15.7 | 15.7 |
| 10 | 25 | M | 12.8 | 12.6 | 13.0 | 35 | 29 | F | 14.4 | 13.4 | 12.6 |
| 11 | 21 | M | 13.0 | 13.4 | 14.2 | 36 | 42 | F | 13.8 | 13.0 | 13.0 |
| 12 | 22 | M | 14.0 | 13.6 | 14.6 | 37 | 30 | F | 13.6 | 13.0 | 13.2 |
| 13 | 20 | F | 13.0 | 14.0 | 15.0 | 38 | 25 | M | 13.5 | 13.2 | 13.8 |
| 14 | 21 | F | 12.5 | 12.4 | 13.8 | 39 | 33 | M | 14.1 | 13.2 | 13.2 |
| 15 | 26 | F | 13.8 | 13.0 | 13.4 | 40 | 55 | F | 14.7 | 14.2 | 15.0 |
| 16 | 28 | F | 13.6 | 13.2 | 13.8 | 41 | 32 | F | 12.7 | 12.0 | 14.0 |
| 17 | 26 | F | 12.0 | 11.4 | 11.0 | 42 | 45 | F | 17.0 | 17.5 | 17.3 |
| 18 | 23 | M | 15.0 | 15.0 | 14.2 | 43 | 45 | M | 13.0 | 12.5 | 12.5 |
| 19 | 27 | M | 14.6 | 14.0 | 15.2 | 44 | 37 | M | 13.6 | 13.2 | 13.5 |
| 20 | 21 | M | 14.6 | 14.2 | 13.8 | 45 | 40 | M | 14.6 | 14.0 | 14.8 |
| 21 | 25 | F | 13.5 | 13.0 | 12.5 | 46 | 20 | M | 13.2 | 12.8 | 12.6 |
| 22 | 23 | F | 14.0 | 14.2 | 14.8 | 47 | 29 | M | 14.8 | 14.0 | 13.8 |
| 23 | 40 | M | 13.5 | 14.2 | 11.0 | 48 | 19 | F | 11.5 | 12.0 | 12.5 |
| 24 | 19 | F | 13.0 | 12.8 | 12.0 | 49 | 21 | F | 12.7 | 11.7 | 11.2 |
| 25 | 20 | M | 12.0 | 11.7 | 12.3 | 50 | 21 | M | 17.1 | 17.5 | 16.5 |