
An institution responding to online-learning difficulties needs to know more than which complaint receives the highest percentage. It also needs to understand whether disrupted access, uncomfortable participation, delayed feedback and competing personal responsibilities affect different students or accumulate within the same group. These arrangements imply different organizational questions even when every marginal percentage remains unchanged. A student reporting one difficulty may need a narrowly defined response; a student reporting several may encounter constraints that cannot be considered independently. Item summaries frequently establish the frequency of each response while leaving its coexistence with other responses unresolved. The distinction between frequency and concentration is therefore central to interpreting educational survey evidence.
Research on online education in Bangladesh provides an appropriate setting for examining that distinction. Al-Amin and colleagues examined preparedness, participation and classroom activities among tertiary students, documenting several dimensions of the transition to online instruction [1]. Sarkar and colleagues considered public-university students’ perceptions, including variation associated with devices and connection arrangements [2]. Rouf and colleagues investigated perceptions across respondent groups and identified technological and learning-environment constraints [3]. These studies establish the relevance of access and participation questions, but their populations, instruments and recruitment procedures differ. Their findings cannot be pooled simply because their titles refer to the same country or educational delivery mode.
The wider literature also requires careful separation between planned online instruction and emergency delivery. Bond and colleagues’ mapping of the first global online semester identified a predominance of descriptive, cross-sectional investigations of teaching and learning perceptions [4]. Adedoyin and Soykan discuss the opportunities and constraints accompanying the pandemic transition [5], while Dhawan examines institutional responses and the demands of rapid adoption [6]. Such work supplies historical and pedagogical context. It does not establish that the frequency of a difficulty in one institution represents a stable national condition or that reported dissatisfaction measures a loss of learning. Those distinctions remain necessary when a later publication presents familiar problems in a different respondent group.
Digital access itself is multidimensional. Van Deursen and van Dijk distinguish physical connectivity from material access, including device arrangements and continuing costs [7]. Robinson and colleagues explain why inequalities in digital participation have consequences across social domains [8]. Beaunoyer and colleagues consider reciprocal relationships between the pandemic and digital inequalities [9]. Applied to higher education, these contributions support examining the conditions under which participation occurs rather than treating possession of an internet connection as sufficient evidence of access. They do not justify attributing any particular questionnaire response to household income, geography or device quality when those characteristics are absent from the available table.
Pedagogical participation is similarly broader than platform availability. The evidence map by Bond and colleagues distinguishes behavioural, emotional and cognitive engagement and documents uneven conceptual treatment of engagement in educational-technology research [10]. Nkomo and colleagues synthesize research on engagement with digital technologies, emphasizing the diversity of approaches used to investigate it [11]. Martin and Bolliger examine students’ perceptions of engagement strategies across learner, instructor and content interactions [12]. These distinctions matter because comfort in a discussion is one specific response domain. It cannot be substituted for the full construct of engagement, and a teacher’s judgment of interaction is not an interchangeable measurement of the student’s experience.
Instructional design offers a complementary perspective on those distinctions. Rapanta and colleagues emphasize teacher presence and the organization of learning activity in online university teaching [13]. Martin and colleagues’ systematic review covers a broad range of research on online teaching and learning [14]. Bao’s account of the transition at Peking University illustrates the importance of adapting teaching arrangements during rapid deployment [15]. Together these sources provide reasons to examine access, feedback and participation as connected educational concerns. They cannot demonstrate which of these concerns coexist within the present respondent group, because that is a question about the joint distribution of its responses.
The management of study time introduces another distinct dimension. Broadbent and Poon review associations between self-regulated learning strategies and academic achievement in online higher education [16]. Panadero examines models of self-regulated learning and the processes they distinguish [17]. Aguilera-Hermida investigates students’ use and acceptance of emergency online learning, including motivational and situational considerations [18]. These contributions make it reasonable to discuss academic–personal balance alongside technical interruption. They do not warrant diagnosing poor self-regulation from one questionnaire item. Interruption may complicate scheduling, but a table showing separate percentages for those experiences cannot establish the direction or existence of an individual-level association.
A further difficulty concerns the meaning of the numerical summaries. Liddell and Kruschke demonstrate problems that can arise when ordinal responses are analyzed as though their numerical spacing were inherently quantitative [19]. Bürkner and Vuorre explain models that explicitly respect ordered categories [20]. Norman presents arguments concerning the robustness of common statistical procedures under particular conditions [21]. The disagreement between broad prescriptions does not license an arbitrary choice of a measurement scale. Without the questionnaire anchors, scoring instructions and category counts, it is preferable to state exactly which displayed response classification is being used and to limit calculations to information that classification supplies.
The present research asks: what can the six student margins establish about unavoidable overlap and the concentration of adverse responses, and how sensitive are those conclusions to denominator and coding assumptions? The contribution is a finite-sample partial-identification analysis. Partial identification distinguishes conclusions determined by the evidence from conclusions requiring additional assumptions [22]. Communication of uncertainty is especially important when evidence is used to justify practical decisions [23]. Here the analysis preserves each displayed margin and considers every feasible joint allocation, rather than selecting one convenient allocation. Its novelty lies in the question and its explicit numerical answer for these items; it does not rest on claiming a new optimization algorithm, a new participant cohort, or priority over all previous educational research.
The results used describes 100 students and 30 teachers from BGMEA University of Fashion & Technology and Trust University, Barishal [24]. Its demographic table allocates 50 students and 15 teachers to each institution. The underlying investigation used purposive recruitment, a 25-item survey and interviews with 15 students and 10 teachers. Student eligibility included completion of an online semester and at least 75% attendance; teachers required experience delivering complete online courses. The data describes descriptive statistics, correlations, group comparisons and thematic analysis. The present work adds calculations that can be performed on these values.
The analytical population is therefore the displayed respondent group under explicit table-reading assumptions. A common denominator of 100 is assumed for the six student rows, with the agreement and disagreement columns treated as exhaustive classifications. The record does not supply item-specific missingness, weighting instructions, neutral-category handling or the complete response anchors. Consequently, compatibility with these assumptions is a condition of the analysis, not an independently verified characteristic of the questionnaire. The importance of transparent questionnaire construction and scoring is established in educational survey guidance [25]; measurement transparency is also necessary for evaluating the validity of later interpretations [26].
An adverse response is defined narrowly as the table category that indicates difficulty for the wording of that item. Disagreement is selected for platform usability, timely feedback, classroom equivalence and discussion comfort. Agreement is selected for technical disruption and effects on academic–personal balance. The last item is interpreted in the direction indicated by its description of difficulty; its wording alone does not distinguish the magnitude or precise nature of that effect. The resulting student counts are 34, 38, 61, 51, 77 and 70, denoted S1 through S6. All subsequent joint calculations refer to these six categories.
The coding changes direction, not the percentages. In particular, 49% agreement with feeling comfortable in discussion corresponds to 51% disagreement, not 49% discomfort. Disagreement with classroom equivalence is recorded as that response, rather than relabelled as measured academic underachievement. The reported means and standard deviations remain visible for documentary completeness. They are not reverse-scored, combined into a continuous scale, or used to derive standardized effects. No equal spacing between response categories is assumed. Scale development and validation require evidence beyond the presence of several related items [27]; construct-validity concerns also prevent treating an item count as an established psychological scale [28].
Teacher adverse percentages are oriented in the same transparent manner, using disagreement for content delivery, confidence, engagement and institutional support, and agreement for assessment difficulty and technical disruption. These descriptions remain separate from student counts. The items are not matched measurements across groups, and their denominators differ. No pooled percentage or teacher–student significance test is calculated. The quantity obtained by adding six teacher percentages would have no established respondent-level interpretation until the method producing those percentages is known.
Let \(b=(b_1,\ldots,b_6)\) denote a binary pattern, with \(b_j=1\) indicating the adverse category for item \(j\). There are \(2^6=64\) possible patterns. For each pattern, \(x_b\) is a nonnegative integer indicating how many of the 100 students occupy that pattern. With \(a=(34,38,61,51,77,70)\), the feasible set is
Each constraint preserves a quantity printed in the student table. No constraint fixes an unobserved correlation or asserts that one adverse category causes another. The approach therefore allows positive association, negative association and more complicated dependence whenever they are compatible with the margins. A feasible allocation establishes logical compatibility; it does not recover the questionnaires that generated the table.
For any event \(E\) defined on a response pattern, its attainable lower and upper counts are
The bounds are sharp relative to the stated constraints because an admissible allocation attains each endpoint. Sharpness does not mean that either endpoint is likely. It means that excluding it requires information or restrictions not present in the six margins. The supplied computational certificates record aggregate pattern counts so that attainment can be checked without presenting invented student records.
For two categories \(i\) and \(j\), elementary counting gives
The lower endpoint follows because the union cannot exceed 100 students; the upper endpoint follows because an intersection cannot exceed either constituent set. Both endpoints are attainable. The remaining four columns can be assigned their required counts without changing the selected pair, so the pairwise formulas remain sharp within the six-item problem. All fifteen item pairs are evaluated. Their extrema are separate optimization questions and need not be simultaneously attainable in a single allocation.
For pattern \(b\), define \(c(b)=\sum_jb_j\). The number of students with at least \(k\) adverse responses is \(N_{\geq k}=\sum_b\mathbf{1}\{c(b)\geq k\}x_b\), for \(k=1,\ldots,6\). Equation (2) is solved for each threshold. Summing the margins also gives
This is an accounting identity across response categories. It is not a reliability estimate, a severity score or an assessment of educational quality. Equal counting gives each adverse category one unit solely to answer a question about concurrence. It does not imply that technical interruption and delayed feedback have equal consequences.
Integer optimization is used because students are whole persons. Continuous relaxations are solved as a diagnostic comparison, allowing fractional pattern counts while retaining the same margins. Their optima bound the integer optima but can produce fractions that are not admissible student counts. The calculations use SciPy 1.17.0 and its HiGHS interface; SciPy’s computational role is documented by Virtanen and colleagues [29]. Huangfu and Hall describe the dual simplex work associated with HiGHS [30]; that citation concerns its linear-optimization background and is not presented as documentation of every integer-solver component. The integer solves use a zero relative optimality tolerance and their returned allocations are checked against all constraints.
If an unweighted item has denominator \(n\), its attainable percentages are \(100r/n\) for integer \(r\) between zero and \(n\). A percentage printed to two decimal places is rounding-compatible only if its distance from this lattice is at most 0.005 percentage points. The teacher agreement column is checked using \(n=30\). The reasoning resembles granularity checks on reported summaries [31], although the present test concerns percentages rather than the GRIM test for means. Neighbouring attainable counts and minimum discrepancies are retained. A failure establishes incompatibility with the specified denominator and rounding rule; it does not establish misconduct, identify an alternative denominator, or authorize changing a value.
The numerical sensitivity analysis relaxes each student margin by an integer tolerance \(\varepsilon\in\{0,1,2,3,4,5\}\) while maintaining 100 students:
The same minimum and maximum objectives are evaluated over these enlarged sets for thresholds three, four and five. A tolerance of five means that each marginal count may change by at most five students; it does not mean that only five individuals have altered responses across the entire questionnaire. This is a deterministic stress test of the constraints. It supplies neither a probability distribution for reporting error nor a confidence level for its endpoints.
The analysis deliberately separates identification uncertainty from statistical sampling uncertainty. No probability sampling design is available, and no new significance tests are introduced. The interpretive limits of statistical tests and confidence intervals are discussed by Greenland and colleagues [32], while the American Statistical Association cautions against treating a significance threshold as a substitute for scientific reasoning [33]. The intervals reported here instead describe all admissible finite allocations. Their breadth is determined by unavailable joint responses and stated assumptions, not by a standard error estimated from the survey.
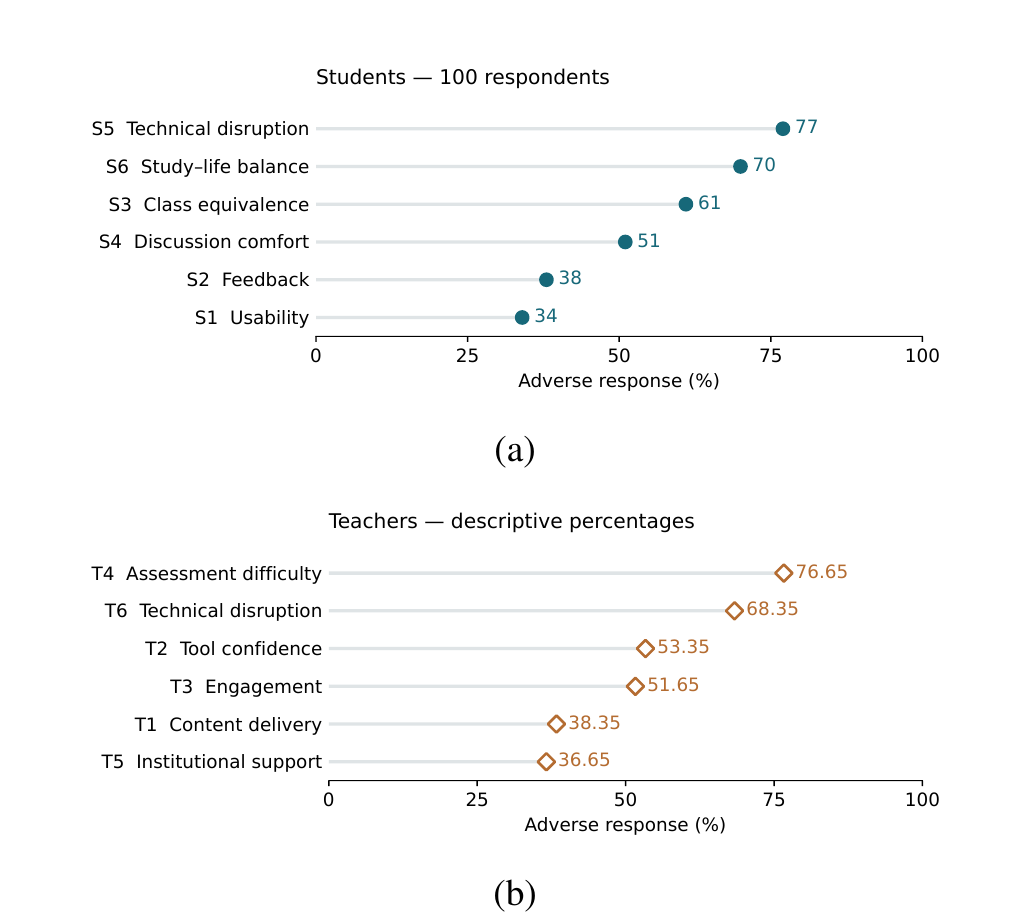
The student profile in Table 1 places technical disruption at 77 adverse responses and academic–personal balance at 70. Disagreement with classroom equivalence follows at 61, disagreement with discussion comfort at 51, lack of timely feedback at 38 and disagreement with platform usability at 34. The total is 331 adverse item responses. Because each of 100 students can contribute to several categories, this total is not a participant count. The descending display in Figure 1 makes the ordering visible while preserving the distinction between student counts and teacher percentages.
| ID | Item | Agree (%) | Adverse (%) | Mean | SD |
|---|---|---|---|---|---|
| S1 | Platform usability | 66 | 34 | 3.40 | 1.12 |
| S2 | Timely feedback | 62 | 38 | 3.27 | 1.12 |
| S3 | Classroom equivalence | 39 | 61 | 2.68 | 1.26 |
| S4 | Discussion comfort | 49 | 51 | 2.97 | 1.19 |
| S5 | Technical disruption | 77 | 77 | 3.75 | 1.10 |
| S6 | Academic–personal balance | 70 | 70 | 3.52 | 1.18 |
The separation between the largest and smallest margins is 43 percentage points, but the middle positions should not be interpreted as measured distances between educational harms. The questions concern different experiences and use different substantive comparisons. A platform may be judged usable while online classes are judged less effective than classroom instruction. Thus, the 34% adverse usability margin and the 61% classroom-equivalence margin are compatible judgments about distinct properties. Their difference does not establish inconsistency in respondents’ views or reveal the mechanism producing their perceptions.
The teacher descriptions in Table 2 place assessment difficulty at 76.65% and technical disruption at 68.35%. Disagreement with confidence in online tools is 53.35%, followed by 51.65% disagreement with effective engagement. The descriptive contrast between assessment difficulty and institutional support does not quantify whether support reduced difficulty, because the necessary joint responses are unavailable. Nor can the percentages establish how many individual teachers simultaneously required technical assistance and assessment support. The separate panel in Figure 1 retains that distinction rather than visually pairing unlike student and teacher constructs.
| ID | Item | Agree (%) | Adverse (%) | Mean | SD |
|---|---|---|---|---|---|
| T1 | Content delivery | 61.65 | 38.35 | 3.30 | 1.15 |
| T2 | Tool confidence | 46.65 | 53.35 | 2.93 | 1.13 |
| T3 | Student engagement | 48.35 | 51.65 | 3.00 | 1.23 |
| T4 | Assessment difficulty | 76.65 | 76.65 | 3.73 | 1.17 |
| T5 | Institutional support | 63.35 | 36.65 | 3.37 | 1.30 |
| T6 | Technical disruption | 68.35 | 68.35 | 3.50 | 1.28 |
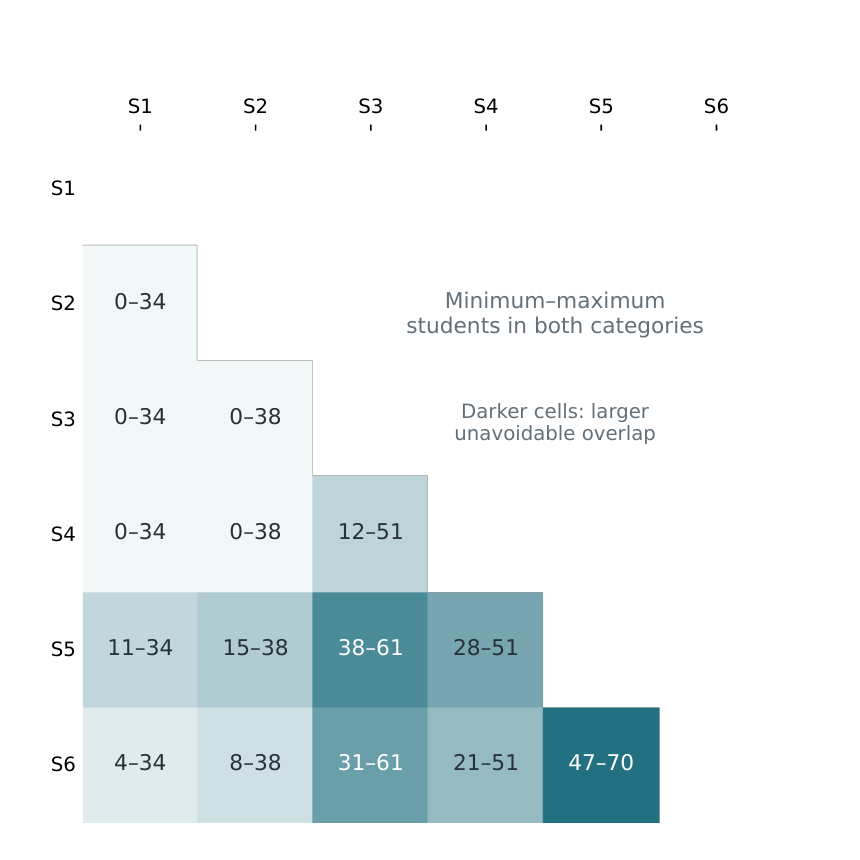
Ten of the fifteen student pairs have strictly positive lower bounds. The strongest mandatory intersection is between technical disruption and balance difficulty: at least 47 students must occupy both categories, and at most 70 can do so. Technical disruption must also coincide with disagreement about classroom equivalence for 38–61 students and with discussion discomfort for 28–51. Balance difficulty and disagreement with classroom equivalence must coincide for 31–61 students. These are counting consequences of the margins, without imposing any assumed correlation.
The interval matrix in Figure 2 also shows where joint prevalence remains completely unconstrained at its lower end. Five pairs have a lower bound of zero, including usability with feedback, classroom equivalence or discussion comfort, and feedback with classroom equivalence or discussion comfort. Zero does not establish that these difficulties occur separately. It establishes that complete separation remains feasible. Conversely, a positive lower bound does not establish positive statistical dependence: sufficiently frequent categories must overlap even when their association is absent or negative. This distinction prevents interpreting a large unavoidable intersection as a causal or correlational discovery.
The 47–70 interval provides a concrete example. Multiplying the two marginal proportions would produce 53.9 expected students under independence, but independence has not been established. That value lies within the allowable interval and is not selected as an estimate. At the lower endpoint, all 100 students occupy the union of the two categories; at the upper endpoint, all 70 students reporting balance difficulty also report technical disruption. These allocations have identical margins and different implications for the extent of common membership. The table alone cannot choose between them.
The integer bounds for cumulative adverse-item counts appear in Table 3 and Figure 3. At least one adverse response must occur for 77–100 students, and at least two for 54–100. At least three can occur for 33–100, whereas at least four can occur for 11–82. The intervals for at least five and all six are 0–61 and 0–34, respectively. All reported endpoints are attained by checked integer allocations. Each threshold has its own pair of certificates, so combining all lower endpoints into one distribution would be incorrect.
| Threshold | Integer bounds | Continuous bounds |
|---|---|---|
| At least 1 | 77–100 | 77.000–100.000 |
| At least 2 | 54–100 | 54.000–100.000 |
| At least 3 | 33–100 | 32.750–100.000 |
| At least 4 | 11–82 | 10.333–82.750 |
| At least 5 | 0–61 | 0.000–61.333 |
| At least 6 | 0–34 | 0.000–34.000 |
The guarantee that at least 54 students have two or more adverse responses is stronger than a statement that one difficulty is widespread. It establishes that multiple adverse categories cannot be confined to a small minority under the maintained assumptions. Nevertheless, the distribution of more concentrated responses remains poorly determined. In particular, the 71-student width for four or more responses spans allocations in which that threshold describes a relatively small group and allocations in which it describes most respondents. A single mean cannot resolve this distinction. The interval for at least one adverse response also establishes that between zero and 23 students can occupy the category with no adverse answers. This complement is useful because a high frequency of one complaint does not establish that every respondent reported a difficulty. Conversely, the existence of a feasible group without adverse answers does not show that such a group was observed. The interpretation remains tied to the six selected categories; it cannot establish whether respondents encountered other educational difficulties omitted from these item summaries.
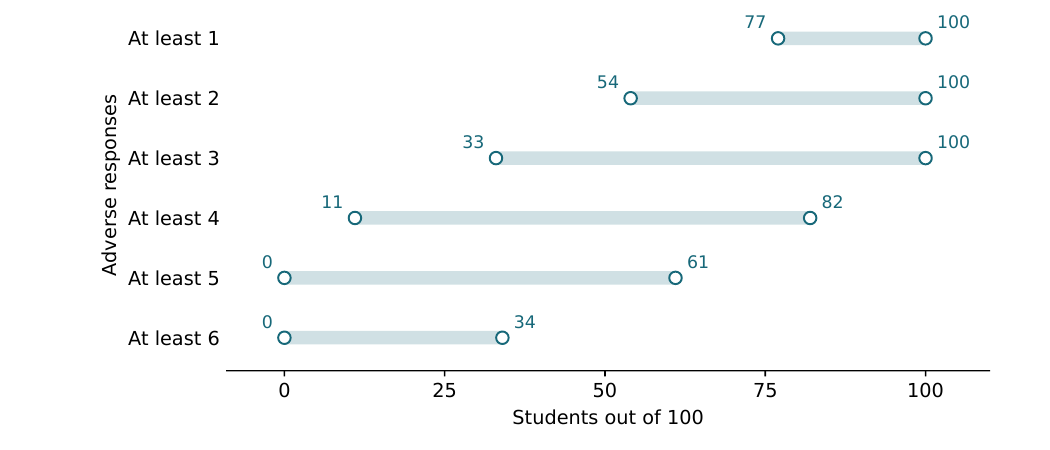
The continuous calculations explain why whole-person constraints matter even in a small problem. For three or more adverse responses, the continuous lower bound is 32.75, while the integer lower bound is 33. For four or more, the continuous interval is approximately 10.333–82.75, compared with 11–82 under integer allocation. For five or more, the continuous upper bound is approximately 61.333 and the integer upper bound is 61. These changes are numerically modest, but reporting the continuous endpoints as exact student counts would describe infeasible allocations.
The two certificates in Figure 4 demonstrate the substantive ambiguity behind the four-response threshold. At its lower endpoint, 89 students have exactly three adverse responses, two have five and nine have six. At its upper endpoint, 15 students have none, three have one and 82 have four. Both certificates contain 100 students, reproduce all six margins and total 331 adverse responses. Neither is the observed distribution. Their purpose is to show that the summaries cannot distinguish markedly different concentrations even when every aggregate number is preserved.
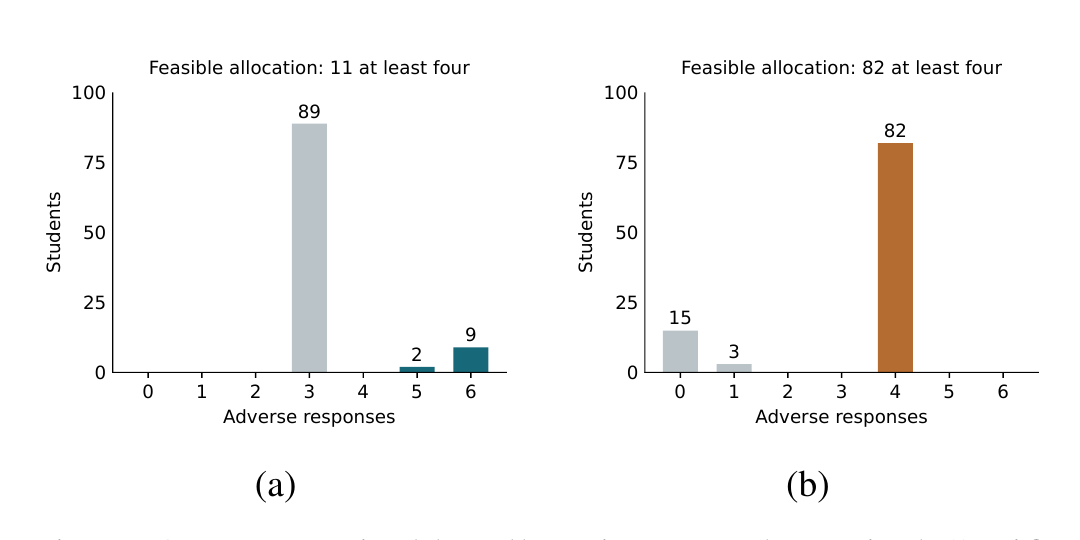
The first certificate concentrates the responses above the threshold in eleven students while placing nearly everyone else immediately below it. The second places most students exactly at the threshold while leaving a smaller group with little or no adverse response. Describing either arrangement as typical would require individual records. The numerical demonstration instead identifies what is missing from a marginal presentation: information about which responses belong together. It also explains why introducing additional decimal places in the means would not resolve the central uncertainty.
A direct accounting argument confirms the four-response lower bound without relying solely on solver output. If a student remains below four adverse responses, that student can contribute at most three to the total. A student at or above four can contribute at most six. Starting with three responses for each of 100 students accounts for 300 of the 331 responses. The remaining 31 require at least eleven students to contribute additional responses above that allowance. Conversely, no more than 82 students can each contribute at least four, because 83 such students would already require 332 responses. The certificates establish that the bounds from these arguments also satisfy each individual margin, which is essential for claiming sharpness.
The lower bound of 54 students with at least two adverse responses uses more than the grand total. Consider only technical disruption, balance difficulty and disagreement with classroom equivalence. Their counts sum to 208. A student with fewer than two adverse responses overall can contribute at most one among these three categories, whereas a student with at least two can contribute at most three. Thus, 100 students can contribute no more than 100 plus twice the number reaching the threshold. Accommodating 208 responses requires at least 54. The feasible certificate confirms that the other three margins do not increase this minimum. This example shows why retaining the full marginal vector can be more informative than retaining only its sum.
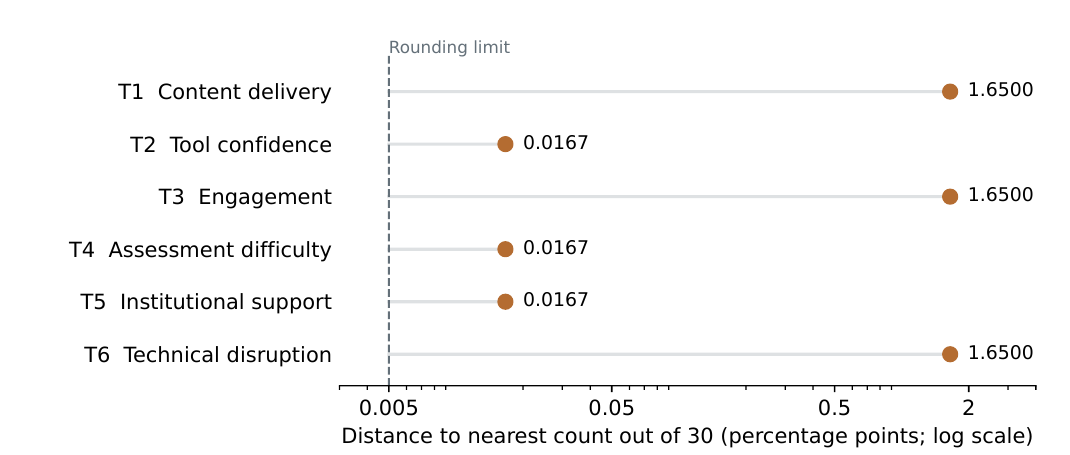
None of the six teacher agreement percentages is compatible with conventional two-decimal rounding of an unweighted proportion out of 30. The nearest attainable values for T2, T4 and T5 differ by approximately 0.0167 percentage points; the nearest values for T1, T3 and T6 differ by 1.65 points. Table 4 and Figure 5 distinguish these magnitudes. A small incompatibility may reflect a display convention or intermediate calculation, while a larger discrepancy requires a different explanation. The evidence supplied does not identify which explanation applies.
| ID | Reported agree (%) | Nearest count / 30 | Difference (pp) |
|---|---|---|---|
| T1 | 61.65 | 18 | 1.6500 |
| T2 | 46.65 | 14 | 0.0167 |
| T3 | 48.35 | 15 | 1.6500 |
| T4 | 76.65 | 23 | 0.0167 |
| T5 | 63.35 | 19 | 0.0167 |
| T6 | 68.35 | 21 | 1.6500 |
| A conventional two-decimal display permits at most 0.005 percentage points (pp). Nearest counts illustrate the discrepancy; they are not substituted observations. | |||
For example, 61.65% lies between 18 of 30 teachers, or 60%, and 19 of 30, or approximately 63.333%. Replacing the value with either neighbour would select an unverified count. By contrast, 46.65% is close to 14 of 30, but ordinary rounding gives 46.67%, not 46.65%. These checks therefore support retaining the printed percentages and withholding count-based teacher inference. They do not support discarding the teachers’ perspectives or declaring the entire publication invalid.
Allowing bounded changes to the student margins expands the feasible concentration intervals. With a one-student tolerance for each margin, the interval for at least four adverse responses becomes 9–84; with three it becomes 5–87; with five it becomes 1–90. The corresponding lower bound for at least three responses declines from 33 to 26 across the full tolerance range, while its upper bound remains 100. The upper bound for at least five rises from 61 to 68. Figure 6 displays the widening directly.
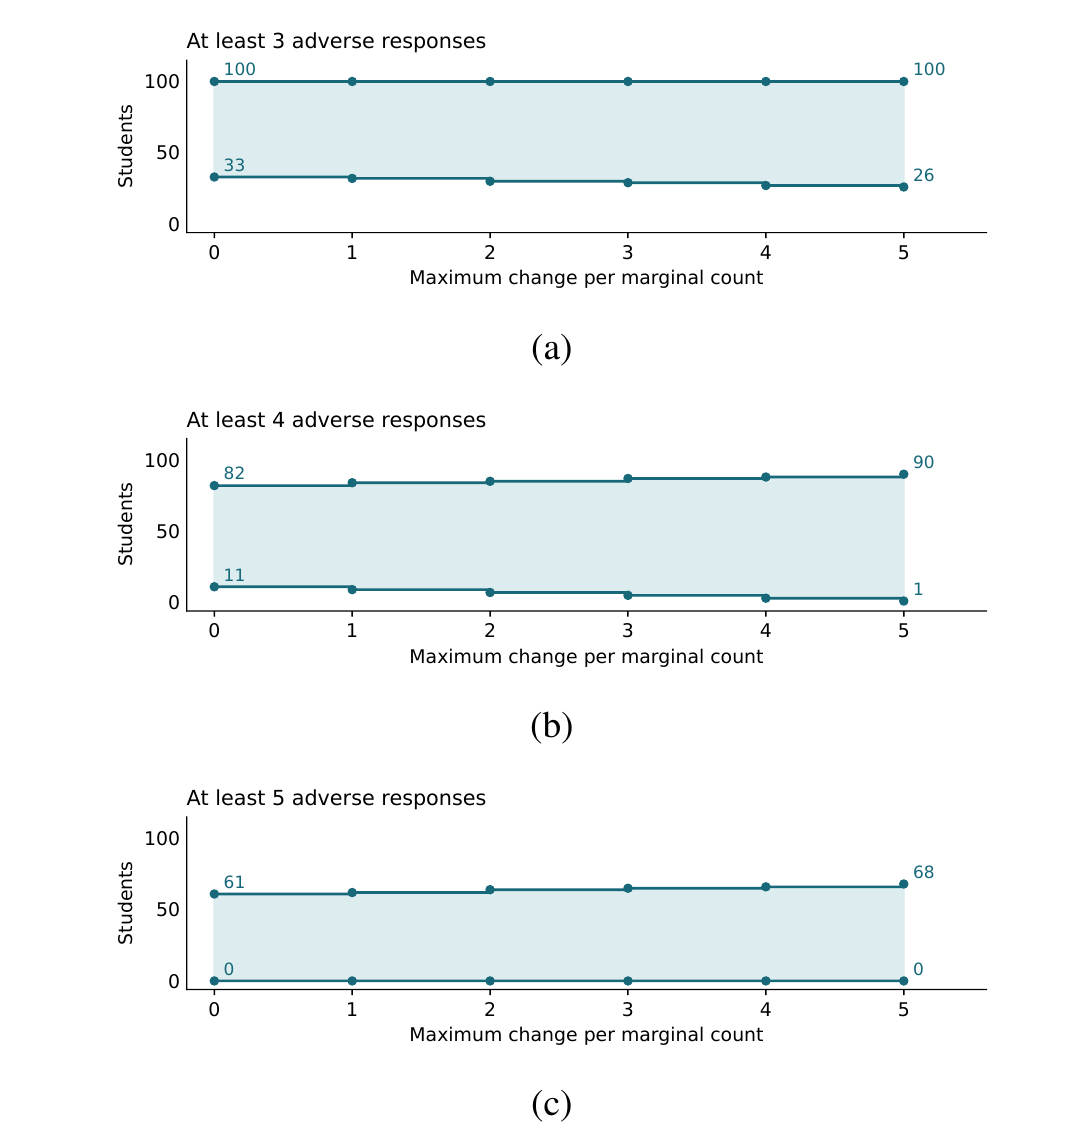
These changes show that the already uncertain concentration of four responses is sensitive to small coordinated changes across six margins. They do not establish that any margin is erroneous by five points. The tolerance permits all margins to move within their limits in whichever directions support the objective, making the result a deliberately permissive sensitivity calculation. Even with that allowance, at least 26 students must have three or more adverse responses. The lower guarantee of some multi-category difficulty persists, while precise claims about its concentration remain unsupported.
The research question can now be answered at two distinct levels. Particular overlaps are unavoidable: technical disruption and academic–personal balance difficulty coincide for at least 47 of the 100 students. Broader concentration is only partially determined: four or more adverse responses can characterize anywhere from 11 to 82 students. These findings are consistent with one another. High marginal frequencies force some intersections while leaving many allocations across six categories possible. The resulting evidence supports attention to concurrent difficulties but does not identify a unique distribution of need, a treatment group, or the sequence in which institutional resources should be assigned.
The difference matters for interpreting a ranked list of complaints. Technical disruption is the largest student margin, yet that rank alone cannot establish that a connectivity intervention would produce the largest educational benefit. The table measures reported interruption, not the expected response to an intervention. Effectiveness, costs, accessibility and implementation conditions are unmeasured. A high frequency can justify investigating a difficulty, while prioritizing a specific remedy requires additional evidence about what changes when that remedy is introduced. None of the optimization objectives estimates such a change.
The unavoidable 47-person overlap also provides a disciplined way to discuss integrated support. It shows that a substantial part of the respondent group cannot be represented as experiencing technical disruption and balance difficulty in entirely separate populations. An institution considering separate services would therefore need to examine whether its referral arrangements accommodate shared membership. This is an implication for the questions an institution should ask, rather than evidence that combining services will improve outcomes. No service was delivered, no implementation cost was recorded, and no change in learning was observed in the present computations.
Educational interpretation must also remain faithful to the questionnaire wording. An adverse answer to classroom equivalence may reflect preferences, course design, interaction, practical requirements or other considerations. The analysis cannot distinguish those explanations. Likewise, discomfort in discussion need not imply absence of attention or cognitive involvement. The engagement literature distinguishes several dimensions of participation, but it cannot supply missing measurements for this respondent group [10], [11]. The present count should therefore be read as the concurrence of six specified answers, with each answer retaining its own educational meaning.
The coexistence of a fixed mean and wide concentration interval is the main analytical contribution. An average of 3.31 adverse categories is compatible with every student having at least three, but it is also compatible with only 33 reaching that threshold. The two arrangements cannot be distinguished by the mean because the mean records the total number of adverse answers and not their allocation. A change in how many answers are concentrated within one student can be offset by a change elsewhere while all six item totals remain fixed.
This ambiguity is not removed by assuming that educational difficulties are related in an intuitive way. Technical instability could plausibly interfere with participation, while a student’s participation choices could also affect the visibility of technical problems. Neither possibility is measured here. A proposed dependence structure would narrow the attainable intervals by adding restrictions, and the resulting precision would then depend on those restrictions. Presenting that precision without stating its origin would confuse assumptions with information contained in the table. The approach used here exposes that distinction rather than hiding it inside a selected simulation.
The extremal certificates offer a useful standard for evaluating stronger verbal claims. Any claim that fewer than eleven or more than 82 students have four or more adverse responses contradicts the maintained margins. A claim identifying a particular number inside that interval goes beyond them. A claim that all 47 students in the mandatory pairwise overlap also lack timely feedback would require another intersection that is not established. These statements separate impossibility, compatibility and identification. They do not rank the compatible allocations by likelihood, because no probability model over allocations has been specified.
The threshold itself is descriptive. Four adverse responses are not a validated cutoff for educational disadvantage, and a student with one severe disruption could face a more consequential constraint than someone with several less consequential complaints. The threshold analysis examines accumulation without assigning clinical, psychological or academic status. Its value is to demonstrate how little a marginal table determines about concurrence. It should not be turned into an automated support rule or used to label students whose questionnaires are unavailable.
The numerical width of an attainable interval should not be interpreted as a defect in the optimization. The method exhausts the information supplied by its constraints. For the four-response threshold, narrowing the interval would require excluding at least one of the checked endpoint allocations. An exclusion might be justified by actual joint counts, a verified structural restriction or additional item information. It cannot be justified merely because one allocation looks less familiar. This provides a practical discipline for scholarly interpretation: an assertion about concentration should state the observation or assumption that rules out alternatives.
The distinction also clarifies what additional tabulation would accomplish. A distribution of the total number of adverse responses per student would identify every cumulative threshold considered here, even without releasing identifiable questionnaires. Pairwise cross-tabulations would identify the corresponding intersections, but would not generally determine all six-way response patterns. These are different information requirements. Publishing only a correlation coefficient for one pair would answer another restricted question and would not resolve the distribution of the total count. The information request should therefore follow the educational quantity of interest, rather than assume that any additional statistic is sufficient.
The teacher descriptions contribute information about delivery, confidence, engagement, assessment and support, but their percentages cannot be treated as recoverable counts without further documentation. This is especially relevant to assessment difficulty, which is the largest adverse teacher percentage. The item concerns difficulty in managing assessment and grading. It does not, by itself, measure a cheating rate, the accuracy of grades, or the effectiveness of online supervision. Those distinctions prevent the descriptive result from being used as numerical evidence for a technology that the survey did not evaluate.
Gikandi and colleagues’ review of online formative assessment concerns the educational use of assessment and feedback [34]. Coghlan and colleagues analyze ethical issues associated with online examination supervision [35]. These sources support considering both pedagogical purpose and the consequences of supervision choices. They do not establish that any specific assessment format would work in the two universities considered here. In particular, a reported grading difficulty cannot identify whether the appropriate response involves task design, clearer criteria, staffing, technical access or supervision. The present manuscript therefore makes no claim that automated proctoring or a different assessment format has been tested successfully.
The denominator check also illustrates why corrections should not be made by intuition. Three small discrepancies could tempt an analyst to round to the nearest teacher, while three larger discrepancies might suggest averaging or weighting. Neither interpretation is documented. Applying different repairs to different rows would silently create a new table with analyst-selected counts. The approach adopted here preserves the numbers, reports the explicit arithmetic condition they fail, and confines inference accordingly. This retains useful descriptive evidence without attributing a precision or origin that has not been established.
Measurement validity raises a related concern about the reported means. Their inclusion preserves the descriptive record, but it does not authorize a continuous latent-variable model. Such a model would require information about item coding, response categories, covariance and the intended construct. Reported internal consistency for a broader questionnaire cannot supply all of that information for the six selected rows. The count analysis avoids claiming to validate a new educational scale. It instead makes its restricted coding operation visible and provides results whose meaning can be traced to the specific categories used.
There is a substantive reason to preserve the distinction between assessment difficulty and assessment integrity. An instructor may find grading difficult because submissions arrive irregularly, because access problems interrupt examinations, because the task is poorly aligned with its criteria, or because feedback requires substantial time. Those possibilities are compatible with the wording, but none has a measured frequency in the available teacher rows. Misconduct is another possible concern, yet the displayed percentage does not isolate it. Treating all affirmative answers as verified integrity violations would change the variable being analyzed. The manuscript therefore retains the broader assessment-management description throughout its tables, graphic labels and conclusion.
A similar principle applies to institutional support. Disagreement with receiving adequate support records an evaluation of adequacy, which may depend on expectations as well as provision. It is not a count of absent help desks, untrained instructors or unavailable devices. Retaining that distinction makes the teacher observations useful for identifying topics that require clarification, while preventing unsupported inventories of institutional deficiencies. The present evidence can describe what the respondent group was reported to perceive; it cannot independently verify the physical or organizational conditions behind each answer.
The attendance eligibility condition is particularly consequential. Students who maintained at least 75% attendance may differ from those who were unable to participate regularly, including students most constrained by access. The direction and magnitude of that selection cannot be quantified from the tables. Hargittai’s discussion of omitted voices in digital traces concerns a different empirical setting, but it supplies a relevant general warning about whose experiences appear in accessible digital evidence [36]. Here that warning is applied as a limitation of recruitment, not as a claim that the same selection process or numerical bias was measured.
The number of respondents does not resolve this issue. A sample of 100 permits exact integer calculations, but exactness within those calculations does not create representativeness. Sample-size justification should follow the intended inferential purpose, as Lakens explains [37]. The present purpose is to determine what follows logically from the displayed margins. It is not to estimate a national prevalence or establish statistical power for an intervention. The distinction is why neither conventional confidence intervals nor retrospective power claims appear in the results.
The computational materials record the twelve aggregate rows, the coding decisions, the objective functions, all fifteen pairwise bounds, cumulative-count bounds, perturbation results and feasible endpoint certificates. This organization follows the emphasis on transparent computational procedures in Sandve and colleagues [38]. Machine-readable values and explicit provenance also reflect the data-stewardship concerns articulated by Wilkinson and colleagues [39]. The package supports verification of this analysis; it does not claim that the unavailable questionnaires satisfy an open-data standard or that releasing aggregate certificates replaces access to the actual study records.
Reproducibility and broader validity must remain separate. Re-running the code can establish that the stated constraints produce the reported optima. It cannot establish that the agreement categories were constructed as assumed, that every row had the same denominator, or that the respondent group represents all students. Munafò and colleagues discuss the importance of improving research methods, reporting and reproducibility together [40]. In this setting, the corresponding practical contribution is an explicit record of what has been computed and what would require additional empirical documentation. Computational certainty is useful precisely when its domain is kept narrow.
The sensitivity display serves a different purpose from collecting another sample. Its horizontal axis is the maximum permitted change in each marginal count, chosen by the analyst to inspect the consequences of numerical uncertainty. It is not elapsed time, expenditure or a measured improvement in education. The widening band should consequently be read as an expansion of compatible allocations, not a prediction that difficulties will become more variable. Maintaining these distinctions in the graphic labels matters because a visually familiar curve can otherwise suggest an empirical process that was never observed.
Within the five-student tolerance, the mandatory intersection of technical disruption and balance difficulty also remains substantial by elementary counting: their smallest permitted margins sum to 137, so at least 37 students must occupy both categories. This statement uses the same pairwise bound already defined in the methods and does not introduce an intervention model. It shows why the educational argument should distinguish persistent overlap from precise concentration. Some overlap remains unavoidable under the permitted numerical changes, even while the interval for four or more responses becomes extremely broad.
A useful reporting distinction concerns the unit of the accompanying dataset. Each row in the aggregate file represents a questionnaire item and respondent group, whereas each row in an endpoint certificate represents a possible binary response pattern. Neither row type represents a person. Keeping these units explicit prevents the twelve aggregate rows from being described as twelve participants, and prevents the mathematical certificates from being mistaken for newly collected questionnaires. It also makes the relation between the data files and the manuscript auditable: values enter as constraints, while optimized counts leave as conditional conclusions.
The calculations permit a precise distinction between evidence preservation and analytical transformation. The agreement percentages, means and standard deviations are transcribed unchanged. Adverse-category percentages are then obtained by a stated choice of response direction. Bounds are calculated from those values, and every resulting interval is labelled by its event and denominator. These operations produce new analytical quantities without changing the empirical origin of the observations. A different research question is thereby addressed through transparent computation, rather than by assigning a new provenance to existing measurements.
The geographical language requires similar discipline. An institution described as urban can enroll students who connect from other settings, and a semi-urban institution can include students with diverse residential circumstances. Assigning all respondents to a residential category from the institutional label would therefore create a characteristic that the analytical table does not supply. The present results maintain the institutional description solely to identify the evidence. They neither explain the margins by geography nor estimate a difference between residential populations. This choice protects the interpretation of both the exact counts and the uncertainty intervals.
The retained teacher observations also have a role beyond their numerical ranking. They indicate that a full account of online education would need to examine teaching work alongside student experience. However, complementary perspectives are not automatically matched observations. Students and teachers may answer different questions, refer to different courses and evaluate different aspects of the same teaching arrangement. The separate descriptive treatment respects that complementarity without manufacturing a paired design. Establishing agreement between perspectives would require a documented linkage or an explicitly justified comparison of equivalent measures.
Finally, the analysis distinguishes a completed computation from a completed empirical explanation. Every endpoint can be checked, yet why respondents selected their answers remains unresolved. Identifying the explanation would require evidence appropriate to that question, including verified response meanings and observations capable of distinguishing competing accounts. The present contribution is therefore substantive but bounded: it establishes which combinations cannot be avoided given the margins and shows how far those margins leave concentration undetermined. Maintaining that boundary allows the results to inform scholarly interpretation without turning numerical feasibility into a claim about educational mechanisms.
The principal limitation is the absence of joint questionnaire responses. This is the reason the analysis produces intervals rather than estimated distributions. Its sharpness is conditional on the six margins, binary coding and common student denominator. If some percentages are weighted, use different item denominators or combine categories in an undocumented manner, the integer interpretation must be reconsidered. The agreement and disagreement columns sum to 100 in the displayed student rows, but this arithmetic property does not independently verify the original handling of neutral or missing answers.
The evidence is cross-sectional and purposively recruited from two institutions. Institutional location is not equivalent to student residence, and the numerical tables do not provide verified residence-specific denominators. Consequently, the manuscript does not calculate a rural–urban contrast, a department effect or a national estimate. Nor does it interpret the reported means as observed differences in academic achievement. Information on collection dates, course characteristics, device conditions and the complete questionnaire is insufficient for assessing how these results might vary across educational settings or periods.
The six adverse categories have different meanings. Equal counting measures concurrence only and does not quantify severity, duration or consequences. The academic–personal balance wording requires a directional interpretation based on its description, and the threshold of four responses has no demonstrated status as a decision cutoff. Different, substantively justified categorizations could change the margins and therefore the attainable bounds. The perturbation calculation explores numerical tolerance around the chosen coding; it does not validate that coding or exhaust every plausible alternative measurement decision.
The teacher percentages are retained without a uniquely established count interpretation. This restricts the manuscript’s numerical contribution to the student margins while preserving teacher descriptions as context. Complete interview transcripts were unavailable, so no new thematic findings or participant quotations are presented. Bibliographic verification establishes the identity of cited publications and their relevance to the limited claims for which they are used; it cannot establish the validity of every result in those publications. Finally, the available tables do not establish temporal stability, so the observed marginal ordering cannot be assumed to persist across cohorts, disciplines or teaching arrangements.
The six student margins establish unavoidable concurrence without identifying its full concentration. Technical disruption and academic–personal balance difficulty must overlap for 47–70 students, and at least 54 students must report two or more adverse categories. Yet the same margins allow 11–82 students to report four or more, despite fixing the mean count at 3.31. This directly answers the research question: particular shared difficulties are identifiable, whereas a precise distribution of multiple difficulties is not. Small permitted changes to the margins widen that uncertainty, and unresolved teacher denominators prevent equivalent count-based conclusions for teachers. The defensible educational implication is to investigate shared membership when interpreting these complaints, while withholding claims about individual needs, national prevalence and intervention effectiveness. Joint response counts and documented coding are necessary to move from these conditional bounds to a more specific account of who encounters which combination of difficulties.
The accompanying project contains the aggregate item table, analysis scripts, numerical outputs and figure files needed to reproduce the calculations. No identifiable participant records are included.
The authors deaclare no conflict of interest.
It does not claim an ethics approval or consent process for new data collection.
AI tools assisted with grammer setting.