
In recent years, the demand for high-quality, interpretable, and adaptive teaching evaluation systems has grown significantly, particularly in the domain of ideological and political education (IPE) [1]. As educational institutions worldwide integrate value-oriented education into curricula to cultivate civic responsibility and political awareness, the importance of developing robust systems for evaluating IPE has become increasingly evident [2], [3]. Unlike technical or knowledge-based subjects, IPE emphasizes affective engagement, ideological alignment, and the cultivation of moral reasoning—dimensions that are inherently fuzzy, subjective, and complex. This unique nature imposes stringent requirements on teaching evaluation systems, which must not only assess objective outcomes but also capture the latent psychological and behavioral feedback of learners [4].
However, current evaluation mechanisms for IPE remain largely qualitative and experience-based. Instructors are often evaluated using static rubrics or periodic feedback forms that inadequately reflect the multidimensional and dynamic characteristics of political-ideological instruction. Such approaches are typically constrained by low sampling frequencies (e.g., end-of-term surveys), limited granularity, and an over-reliance on linear, deterministic metrics [5], [6]. These limitations result in information loss, delayed response to instructional anomalies, and the inability to adaptively capture student perception drift or instructional strategy misalignment.
Recent advances in artificial intelligence (AI), fuzzy systems, and data-driven decision models have provided novel opportunities to transform traditional evaluation systems into dynamic, intelligent platforms capable of real-time adaptation and personalized feedback [7]. In particular, fuzzy comprehensive evaluation (FCE) models,leveraging membership functions, weighting matrices, and multi-layer fuzzy inference rules,have demonstrated strong potential in modeling vague, ambiguous, and gradational judgments in education. FCE enables a hybrid of qualitative linguistic assessments and quantitative modeling, effectively bridging the gap between subjective perception and objective computation [8], [9].
Despite these advantages, several core challenges remain unresolved. First, the definition and calibration of membership functions in fuzzy evaluation systems are often based on expert heuristics rather than data-driven optimization, leading to rigid and unrepresentative semantic boundaries. Second, feedback collection mechanisms are either infrequent (single-point) or excessively frequent (daily surveys), both of which introduce volatility: sparse feedback fails to capture fluctuations, while excessive sampling exacerbates feedback noise and system instability, as shown in our Figures 12–13. Third, existing models largely treat student and teacher feedback as homogeneous, overlooking role-specific behavior patterns, perception gaps, and systemic response asymmetries.
To address these challenges, several works have attempted to optimize the design of educational evaluation frameworks using fuzzy logic, analytic hierarchy process (AHP), entropy weighting, and neural networks. For example, [10] integrated AHP and FCE to evaluate political theory instruction in Chinese universities, highlighting the value of factor hierarchy and subjective-objective weighting. Similarly,[11] developed a fuzzy rule-based expert system for civic education, incorporating psychological factors into the evaluation schema. While promising, these methods often fall short in two aspects: (1) they fail to simulate the dynamic response of the system to temporal feedback patterns, and (2) they lack robustness testing under variable volatility conditions, such as those induced by student sentiment fluctuation or external political climate shifts.
In contrast to existing static or partially dynamic methods, this paper proposes a volatility-aware fuzzy evaluation framework tailored for IPE. Our method incorporates the following innovations
Multi-layer fuzzy membership function optimization: Using real-world feedback distributions and statistical modeling, we dynamically construct and adjust triangular and trapezoidal membership functions for each semantic grade (e.g., VU–VI) to ensure adaptive response to student heterogeneity and cognitive ambiguity.
Sampling-frequency simulation under fuzzy volatility parameters (\(R_f\)): Through simulated experiments, we analyze the impact of feedback introduction frequency (single, monthly, weekly, daily) on teaching quality anomaly rates, revealing the nonlinear relationship between feedback granularity and system robustness.
The systematization of teaching content is fundamental to the construction and execution of a practical tutoring mode for Ideological and Political Education (IPE) courses. As emphasized by system theory, teaching content must follow structured, normative principles to ensure comprehensive and cohesive learning outcomes [12], [13]. In practice, this means that the IPE curriculum must transcend fragmented instructional approaches and align course delivery with consistent ideological goals—primarily the accurate acquisition and practical application of Marxist theoretical understanding by students [14], [15].
To demonstrate this systematization in action, Figure 1 presents a curriculum matrix that maps four core IPE course modules—IPE5000, IPE5100, IPE6000, and IPE6100—across ten disciplines, including Dental Medicine, Nursing, Pharmacy, and Veterinary Medicine. Each cell in the matrix indicates the participation mode of students from different campuses (Pomona only, Lebanon only, or both), reflecting a structured integration of practical IPE content across academic programs and timelines [16], [17].
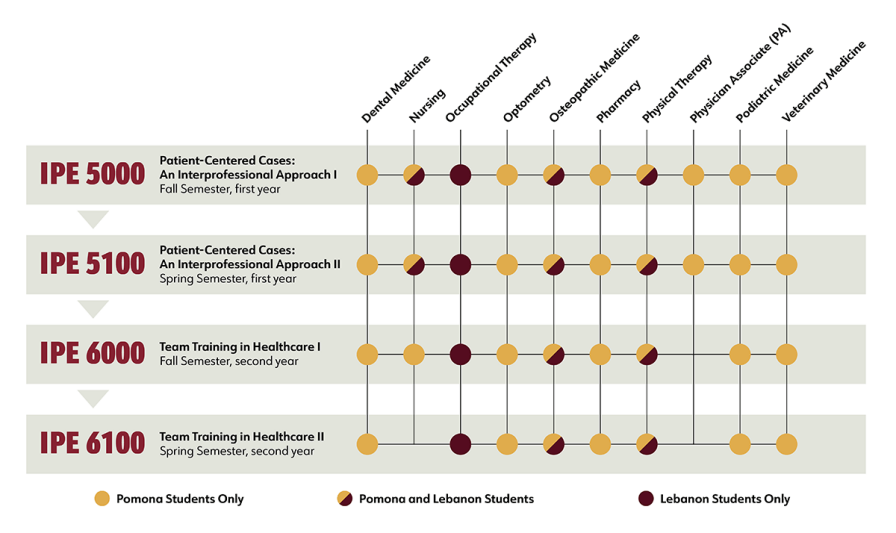
To formalize the teaching structure reflected in Figure 1, we define the systematized curriculum matrix \(M\in Z^{4\times 10}\) as follows:
where: \(C=\{C_1,C_2,\ldots,C_j,\ldots,C_l\}\): represents courses IPE5000 to IPE6100; \(P=\{P_1,P_2,\ldots,P_m\}\): represents ten professional disciplines; \(M_{ij}\): denotes the participation value in the matrix.
This structure enables us to model IPE curriculum delivery using graph theory. Let:
The resulting bipartite graph clearly expresses the systematized teaching content, where courses and disciplines are interconnected through consistent instructional participation. This satisfies the integrity principle of system theory, ensuring all disciplines participate in at least one core course:
Furthermore, the increasing structure of IPE courses throughout four semesters demonstrates the hierarchy principle, while the interaction pattern between institutions and courses—which is represented by the graph’s edge density and node overlap—reveals the structural principle.
Finally, a normalized involvement index can be used to approximate the weight of instructional participation for each course:
where \(I(\cdot)\) is the indicator function. This formulation helps to quantify the degree of systemic integration of each course, further reinforcing the principle of structured and scientific ideological teaching content delivery.
In conclusion, through both visual and mathematical modeling, the teaching content of IPE courses can be systematically categorized and optimized to ensure clarity, consistency, and interdisciplinary collaboration. This lays a solid foundation for the next stages of teaching operation, management, and evaluation.
It is necessary to follow a dynamic, methodical, and phased operational procedure in order to accomplish practical instruction in Ideological and Political Education (IPE). A hierarchical pyramid structure made up of three interconnected stages—Exposure, Immersion, and Mastery—can be used to properly describe the course of IPE instruction, as seen in Figure 2. The fundamental ideas of system theory—process layering, functionality integration, and role-driven operation—are all strongly supported by this structure [18], [19].
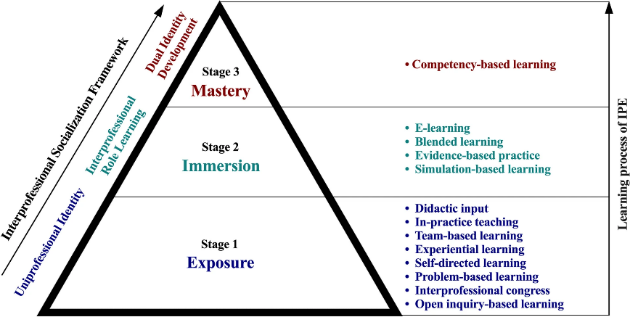
First interaction with the knowledge system is a fundamental component of IPE teaching operations. At this point, students engage in experiential learning activities like problem-based learning, team-based learning, self-directed learning, and in-practice teaching in addition to formal didactic input. The purpose of this exposure phase is to encourage students’ preliminary comprehension of ideological theory and provide them the opportunity to see how applicable it is in real-world situations [20]. Here, students mostly identify with their core discipline, and the uniprofessional identity is prevalent.
Students move into a deeper involvement phase at the intermediate layer through simulation-based learning, blended learning, and evidence-based practice. This stage facilitates the development of interprofessional role learning, in which students use theoretical frameworks to cooperatively address complex societal or political issues [21]. This operating mode places a strong emphasis on systems integration: realistic role exchanges, simulation feedback loops, and instructional design are all coordinated to replicate the complexity of the actual world.
In the last stage of IPE operation, competency-based learning is sought after, where students exhibit independence, flexibility, and political-critical thinking in a group environment [22]. After dual identity development—the capacity to strike a balance between disciplinary competence and interprofessional collaboration—the operational mode changes from teacher-driven to student-driven. This phase highlights how ideological theory culminates in successful, socially conscious political action.
The instructional operation process undergoes a nonlinear, hierarchical transition from the standpoint of system theory, with each stage:
Acts as a subsystem with distinct inputs, transformation rules, and outputs;
Relies on feedback and feedforward regulation mechanisms;
Involves identity transitions (from uniprofessional to interprofessional roles).
Mathematically, the operation model can be formalized as:
where: \(S_1\) is the exposure stage (\(f_1\): basic learning \(\rightarrow\) awareness), \(S_2\) is the immersion stage (\(f_2\): simulation/role-play \(\rightarrow\) integration), \(S_3\) is the mastery stage (\(f_3\): autonomy \(\rightarrow\) performance).
Let \(O_i=f_i(I_i)\), where \(I_i\) is the input from the previous stage, then the complete system operation is:
The teaching objectives of Marxist application and political maturity are finally met by this nested operational formulation, which shows how ideological-political information is made actionable through a systematic and tiered teaching process.
According to system theory, the instructional management system for Ideological and Political Education (IPE) must adhere to the integrity, hierarchy, and structure principles. The cooperation of its subsystems—teaching staff, administrators, assessors, IT infrastructures, and data feedback mechanisms—is essential to the overall operation of an educational system [23], [24]. Figure 3 shows a data-driven architecture that uses feedback regulation, multi-source integration, and methodical decision-making to support the standardized management and quality assurance of IPE instruction.
This architecture creates a closed loop of data interaction between all IPE players, including data owners (teachers, academic departments), system orchestrators (managers, decision-makers), and data viewers (students, stakeholders). Data providers, big data applications, data consumers, and the underlying big data frameworks are the four main components of the big data system. Real-time analysis, ongoing development, and dynamic management of the educational process are made possible by the data (red arrows) and information (orange arrows) flowing between these entities.
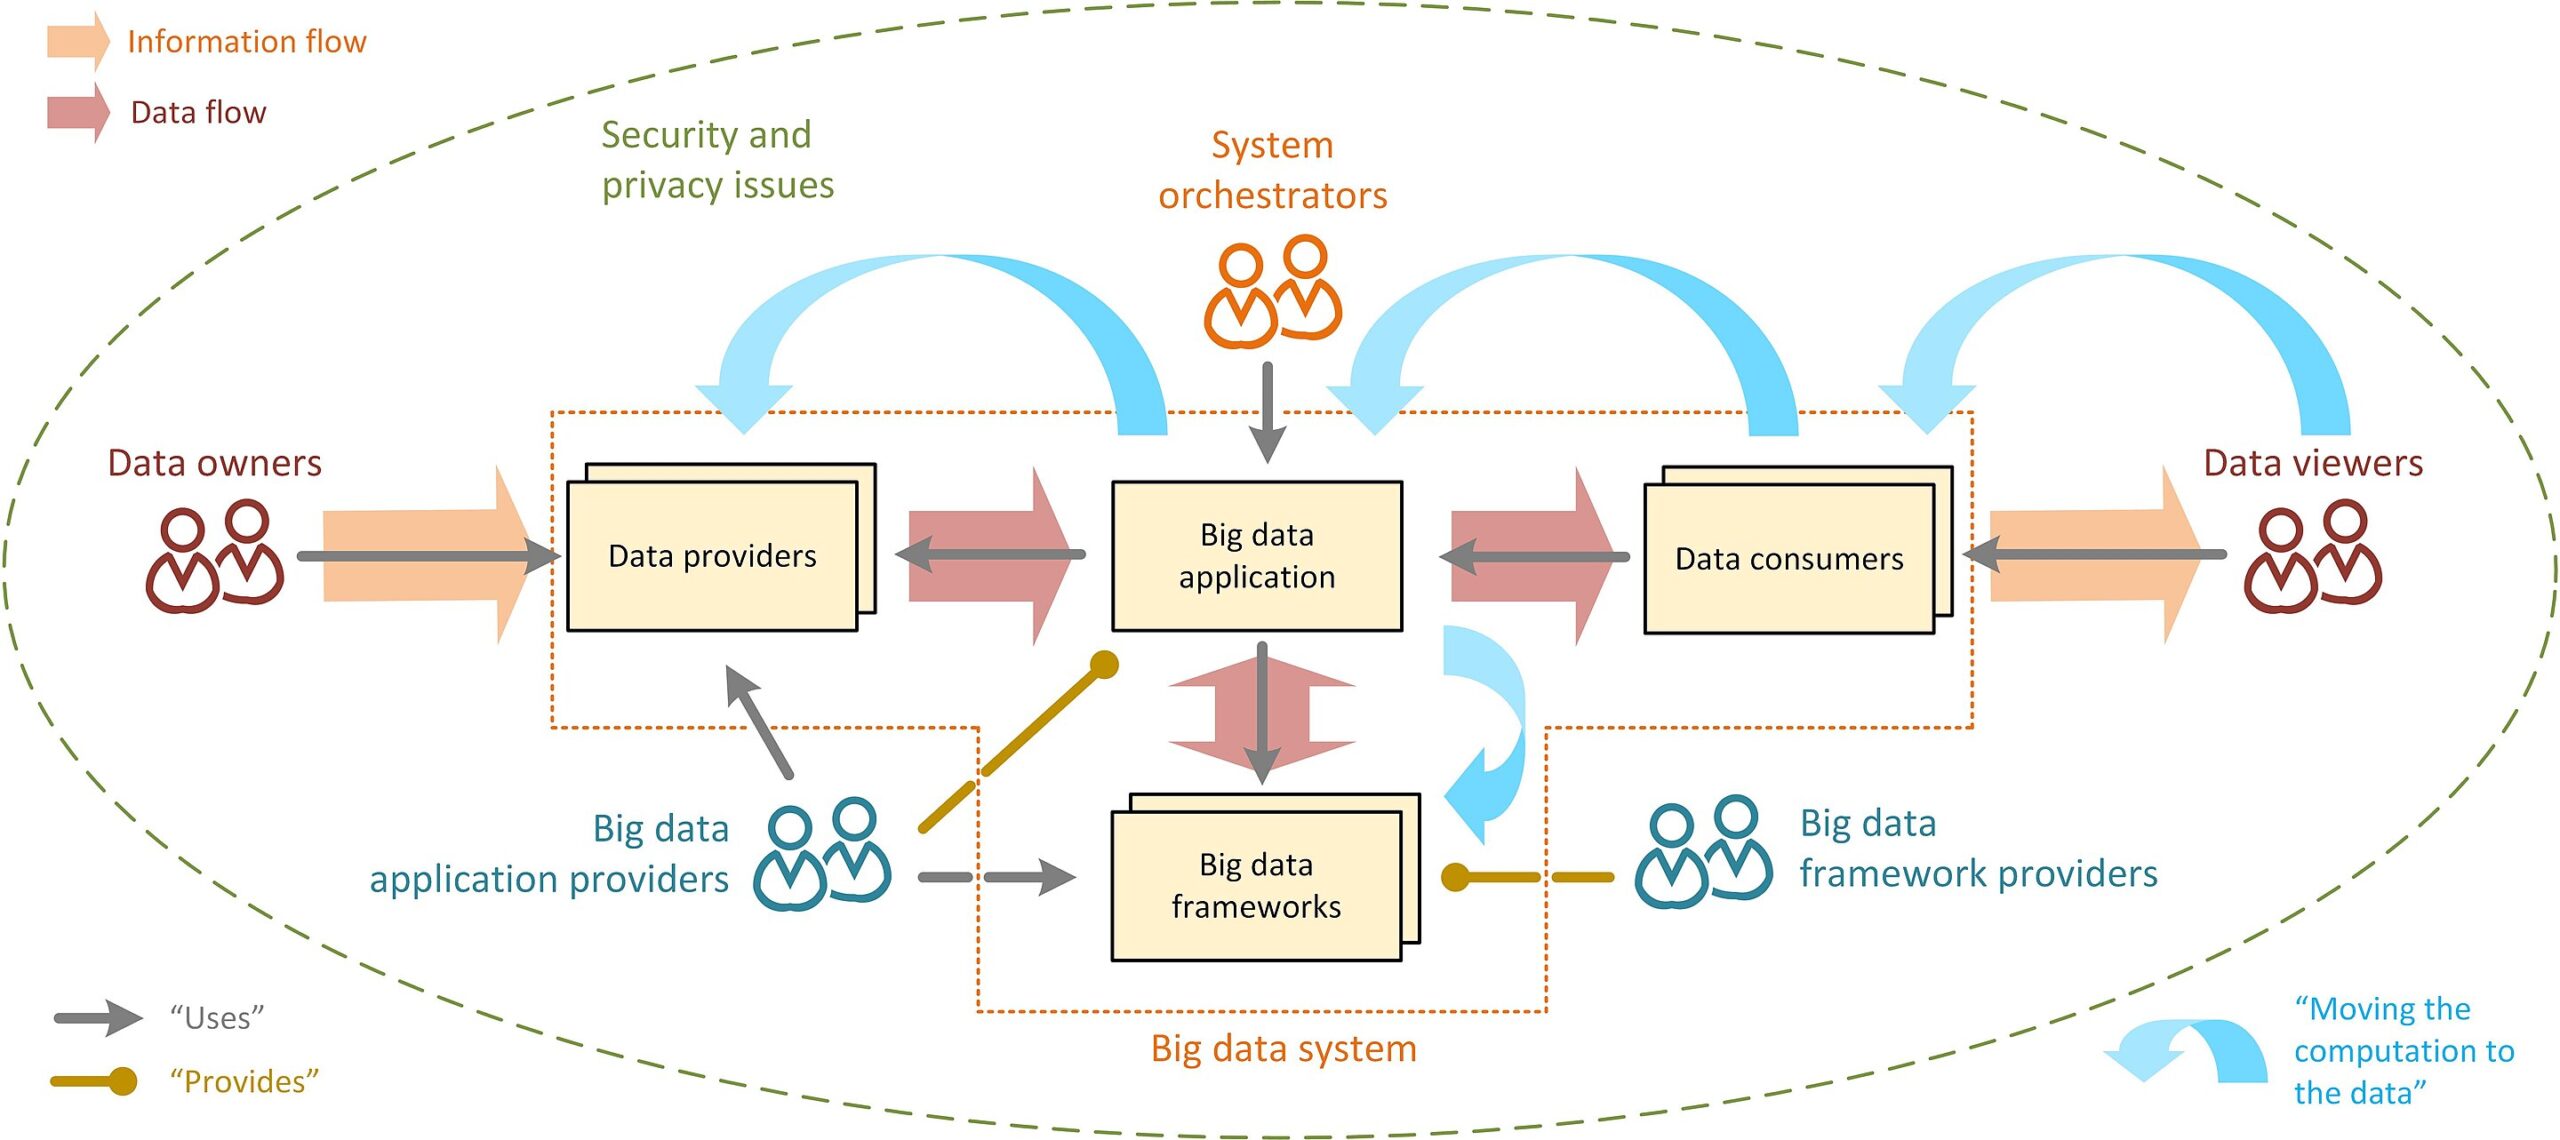
From an operational standpoint, system-wide evaluation is based on data gathering and standardization. The system incorporates a number of data entry methods, such as offline reports, scheduled submissions, real-time online assessments, and manual inputs. Accurate entity recognition, where the same instructor or course may appear under slightly different titles, is a major difficulty. The system uses an entity matching mechanism based on similarity thresholds to fix this:
where \(\delta\) is a defined confidence level. This process ensures data de-duplication and quality enhancement before further analysis.
Data tables are created and improved after the data has been consolidated. The architecture uses a hybrid verification approach in which manually validated machine-generated tables are uploaded to a web-based platform. Particularly when allocating grades or assessments to certain instructors or classes, this combination guarantees accuracy and responsibility.
The system gives each student a distinct, reversible login ID for evaluation activities in order to preserve student privacy and the impartiality of assessments. Their identity, timestamp, and randomized salts are securely hashed to create this ID:
This enables traceability for administrators while ensuring anonymity for students during the evaluation process.
Furthermore, teaching evaluation by peer experts is also supported. Although the data volume from expert evaluations is limited, the system provides auxiliary data entry interfaces, such as form-based inputs or encrypted email surveys, to include qualitative feedback into the system.
Ultimately, the entire teaching management workflow can be formalized as a closed-loop functional system:
The feedback principle of system theory, which states that the output of one cycle serves as the input for improvement in the subsequent one, is consistent with its recursive structure. Real-time course correction and evidence-based policy adjustments are made possible by the system’s assurance of a consistent, safe, and responsive IPE teaching environment.
The teaching management system accomplishes its objectives of standardization, automation, and scientific evaluation through this structured architecture, offering strong support for the development of IPE in contemporary higher education.
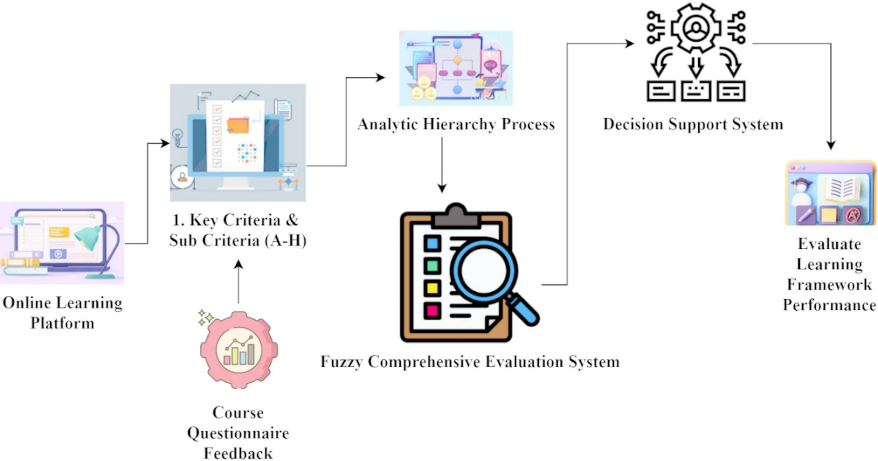
Fuzzy comprehensive evaluation (FCE) provides a structured approach to assessing teaching quality under conditions of uncertainty and multi-criteria complexity. As shown in Figure 4, the FCE process begins with course questionnaire feedback collected from an online learning platform, where students rate various aspects of the instructional experience. These responses are used to extract a set of key evaluation criteria and sub-criteria, which are then structured and prioritized through the Analytic Hierarchy Process (AHP). This hierarchy enables the transformation of qualitative perceptions into quantifiable weights that reflect the relative importance of each factor. The weighted criteria are subsequently processed within the fuzzy evaluation system, which synthesizes diverse student feedback into a comprehensive assessment outcome. This result is forwarded to a decision support system, enabling education managers to evaluate the overall performance of the instructional framework and make data-informed adjustments. The framework accommodates both single-level and multi-level evaluation structures, allowing more granular and layered analysis when needed. Through this architecture, fuzzy evaluation serves as a bridge between subjective learner experiences and objective, actionable insights, effectively enhancing the scientific rigor and adaptability of teaching quality assessment in ideological and political education.
Building a thorough index system with main indicators (dimensions) and secondary indicators (observable behaviors) is crucial for the scientific and methodical assessment of teaching quality in Ideological and Political Education (IPE). The effectiveness of an online teaching system, which includes learner characteristics, teacher competency, interface quality, and social environment, eventually affects learners’ pleasure and the system’s perceived success, as shown in Figure 5. The hierarchical evaluation structure used in fuzzy comprehensive assessment is consistent with this conceptual approach.
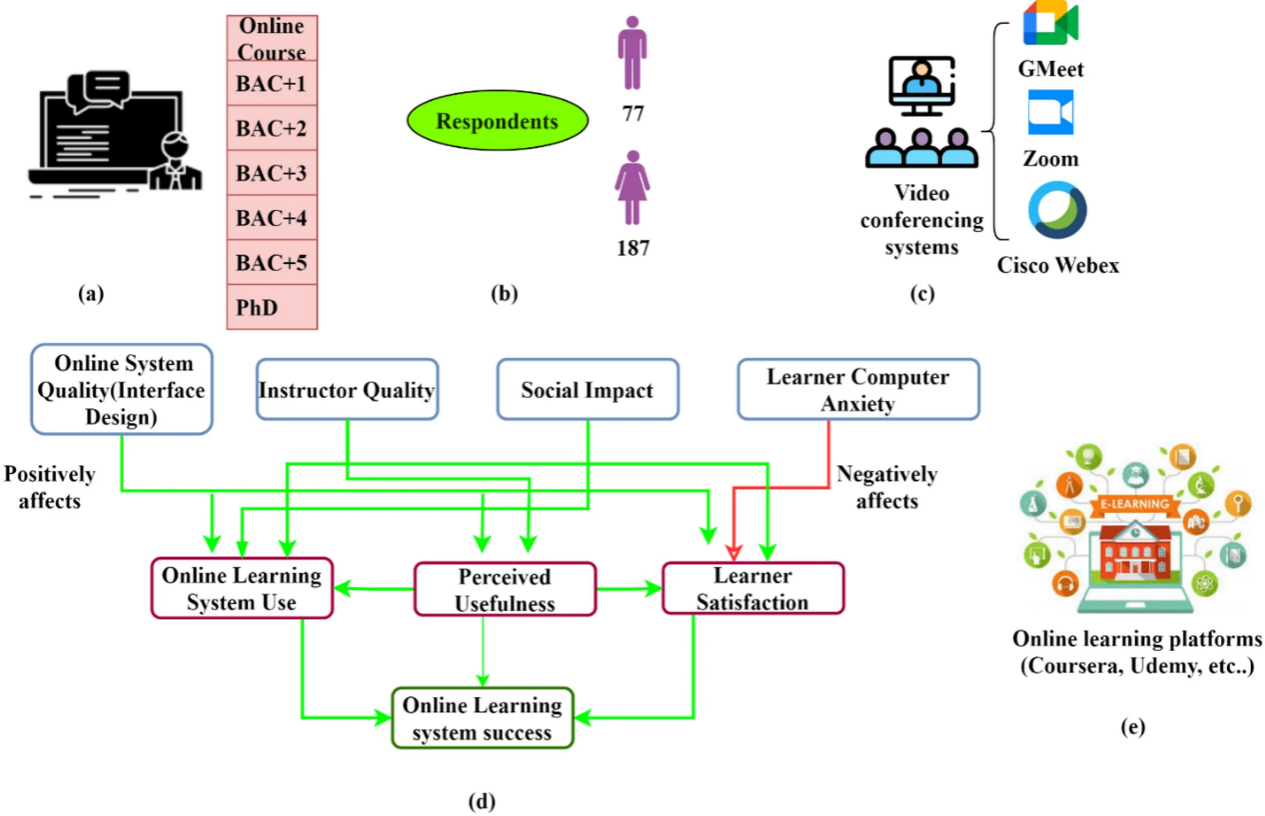
Five key elements—online system quality (i.e., interface design), teacher quality, social impact, learner computer anxiety, and user behavior metrics—have a positive impact on perceived utility, system usage, and satisfaction in this model. These components, which include teaching attitude, content quality, teaching competence, classroom structure, management, and instructional effect, correlate to the six main indications (\(U_1\) through \(U_6\)) in the IPE teaching evaluation system. A collection of secondary indicators \(U_{ij}\), such as meticulous lesson planning, proper use of blackboard writing, or rigorous classroom discipline, are further broken down from each basic indicator \(U_i\).
To formalize this multi-dimensional structure, we define the evaluation index set \(U_1=\{U_{11},U_{12},\ldots,U_{1n}\}\), where each \(U_i\) contains a vector of sub-indices. For example:
\(U_1=\{U_{11},U_{12},U_{13}\}\): Teaching Attitude
\(U_2=\{U_{21},U_{22},U_{23},U_{24}\}\): Teaching Content
\(U_3=\{U_{31},…,U_{36}\}\): Teaching Skills
Each secondary indicator \(U_{ij}\) is scored using linguistic grades (e.g., excellent, good, average), which are then mapped to fuzzy membership degrees within a bounded scale. These scores are stored in a fuzzy evaluation matrix \(R\), and combined with the weight vector \(W=\{w_1,w_2,\ldots,w_n\}\) determined via expert assessment (e.g., Analytic Hierarchy Process or Delphi method).
The final fuzzy evaluation result for each teacher or course can thus be represented as:
where: \(B\) is the fuzzy output vector indicating distribution over performance levels; \(W\) reflects the relative importance of each indicator; \(R\) contains normalized scores of teachers based on collected questionnaires or observational rubrics.
The causal pathways in Figure 5—such as “online system quality positively affects perceived usefulness” or “learner computer anxiety negatively affects satisfaction”—can also be quantitatively modeled in the evaluation system by adjusting indicator weights or integrating behavior-based feedback. This index system ensures that teaching quality evaluation in IPE is grounded in measurable, structured, and multi-level feedback. It also supports feedback-driven refinement of pedagogical practices, aligning directly with the success factors of digital and hybrid learning systems.
Figure 6 illustrates a hybrid model that combines Long Short-Term Memory (LSTM) networks and Intuitionistic Fuzzy Sets (IFS) to improve the precision, flexibility, and interpretability of teaching quality evaluation in higher education. Open-ended questionnaire surveys are used to gather multifaceted, qualitative input on the quality of education at colleges and universities, which serves as the model’s starting point. Following that, these answers are grouped into important influencing aspects including emotional engagement, technological support, interaction quality, and instructional design.
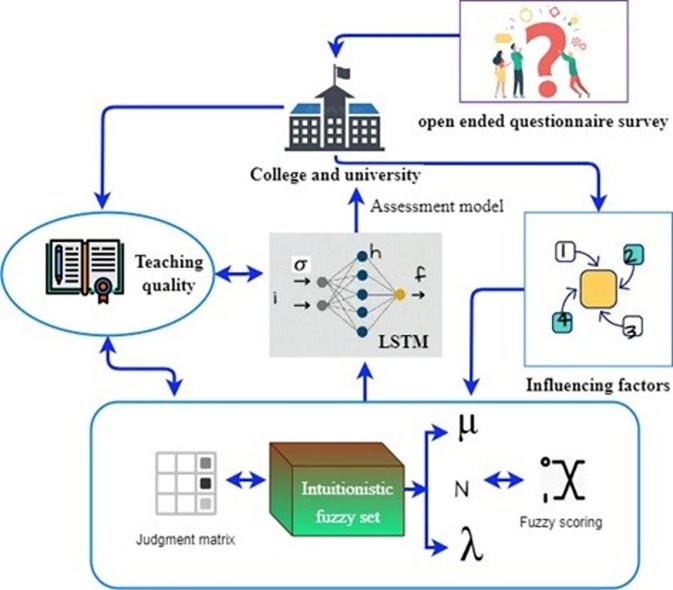
An intuitionistic fuzzy set is used to encode each influencing element. It is distinguished by a hesitation margin \(\pi\), a non-membership degree \(v\), and a membership degree \(\mu\).
This allows the model to more effectively capture uncertainty and hesitation in subjective evaluations. The judgment matrix derived from expert inputs or student scoring is transformed into a fuzzy decision matrix using these parameters. A fuzzy scoring function \(F\) is then applied, generating intermediate evaluation vectors for each factor:
These fuzzy evaluation vectors are sequentially input into a trained LSTM network, which captures the temporal dynamics and latent dependencies among evaluation dimensions. The LSTM’s internal memory gates (input \(i\), forget \(f\), and output \(o\)) and hidden states \(h_t\) are optimized to learn patterns that reflect the impact of different teaching variables on perceived quality. The network outputs a final teaching quality score \(Q\), expressed as:
This score is sent back to the institution as part of the decision support feedback loop, enabling curriculum designers and instructors to identify weaknesses, adapt strategies, and refine instructional delivery.
| Serial number | Primary indicators and weights | Secondary indicators and weights |
|---|---|---|
| 1 | \(U_1\) (0.108) | \(U_{11}\) (0.668); \(U_{12}\) (0.098); \(U_{13}\) (0.234) |
| 2 | \(U_2\) (0.245) | \(U_{21}\) (0.107); \(U_{22}\) (0.529); \(U_{23}\) (0.243); \(U_{24}\) (0.121) |
| 3 | \(U_3\) (0.174) | \(U_{31}\) (0.315); \(U_{32}\) (0.100); \(U_{33}\) (0.207); \(U_{34}\) (0.116); \(U_{35}\) (0.195); \(U_{36}\) (0.095) |
| 4 | \(U_4\) (0.101) | \(U_{41}\) (0.800); \(U_{42}\) (0.200) |
| 5 | \(U_5\) (0.090) | \(U_{51}\) (0.169); \(U_{52}\) (0.447); \(U_{53}\) (0.384) |
| 6 | \(U_6\) (0.28) | \(U_{61}\) (0.200); \(U_{62}\) (0.800) |
| Note: the mass of the secondary index in the above table refers to the weight of the secondary index relative to its upper-level index. | ||
Table 1 presents the hierarchical structure and corresponding weight distribution of the teaching quality evaluation index system based on the fuzzy comprehensive evaluation model. The framework includes six primary indicators (\(U_1\)–\(U_6\)), each encompassing a number of secondary indicators that reflect specific, measurable aspects of teaching performance. Each primary indicator is assigned a global weight representing its importance in the overall evaluation, while the secondary indicators are assigned relative weights within their respective categories. For instance, the Teaching Attitude (\(U_1\)) dimension carries a total weight of 0.108, and it is further divided into three sub-indicators: \(U_{11}\) (Careful lesson preparation), \(U_{12}\) (Dignified appearance), and \(U_{13}\) (Patience and enthusiasm toward students), with respective internal weights of 0.668, 0.098, and 0.234. This implies that within the dimension of \(U_1\), “Careful lesson preparation” is considered the most influential aspect. Similarly, Teaching Content (\(U_2\)), weighted at 0.245 globally, includes four sub-indicators such as \(U_{22}\) (Scientific content), which holds a dominant internal weight of 0.529, reflecting its critical role in content-related evaluation. Teaching Skills (\(U_3\)), Classroom Structure (\(U_4\)), Classroom Management (\(U_5\)), and Teaching Effectiveness (\(U_6\)) follow the same structure, with internal weights summing to 1 within each category.
It is important to note that these weights are typically determined through expert evaluation methods such as the Analytic Hierarchy Process (AHP) or Delphi method, ensuring that the weight assignments reflect pedagogical priorities and domain-specific knowledge.
| Primary index | Secondary index score |
|---|---|
| \(U_1\) | \(U_{11}(94)\ \ U_{12}(85)\ \ U_{13}(89)\) |
| \(U_2\) | \(U_{21}(93)\ \ U_{22}(83)\ \ U_{23}(75)\ \ U_{24}(55)\) |
| \(U_3\) | \(U_{31}(78)\ \ U_{32}(85)\ \ U_{33}(74)\ \ U_{34}(97)\ \ U_{35}(96)\ \ U_{36}(50)\) |
| \(U_4\) | \(U_{41}(89)\ \ U_{42}(76)\) |
| \(U_5\) | \(U_{51}(87)\ \ U_{52}(92)\ \ U_{53}(95)\) |
| \(U_6\) | \(U_{61}(75)\ \ U_{62}(90)\) |
Table 2 presents the detailed evaluation scores of a specific teacher across all primary and secondary indicators within the established teaching quality assessment framework. Each primary indicator (\(U_1\)–\(U_6\)) comprises several secondary indicators (\(U_{ij}\)), with scores ranging from 0 to 100, reflecting the teacher’s performance in specific dimensions. For instance, under Teaching Attitude (\(U_1\)), the teacher scored 94 in lesson preparation, 85 in dignified appearance, and 89 in patience and enthusiasm—indicating a consistently strong performance in this dimension. In the Teaching Content category (\(U_2\)), scores vary more widely: while clarity of objectives (93) and scientific content (83) are strong, the score for lecture pacing (\(U_{24}\), 55) suggests a potential area for improvement. Teaching Skills (\(U_3\)) also show variance, with high marks for language use and engagement (97, 96), but relatively lower scores in diversified teaching methods (\(U_{36}\), 50). Classroom Structure (\(U_4\)) and Management (\(U_5\)) indicators reflect a high level of organization and discipline, with all scores exceeding 76, while Teaching Effectiveness (\(U_6\)) balances moderate clarity (75) and strong student reception (90). These raw scores form the input values for the fuzzy comprehensive evaluation system, where each is mapped to linguistic categories (e.g., Excellent, Good, Fair) based on predefined intervals, and weighted according to the distribution in Table 2. Together, these inputs enable the construction of a fuzzy evaluation matrix, leading to a synthesized, objective assessment of overall teaching quality.
Based on the data, the evaluation scores corresponding to each secondary indicator under the primary dimension of teaching attitude (\(U_1\)) are substituted into formula (1) for further processing. For example, a score of 94 for \(U_{11}\) (lesson preparation) yields the single-factor evaluation vector \(R_{11}=(0.4,0.6,0,0,0,0)\). Similarly, a score of 85 for \(U_{12}\) (dignified appearance) corresponds to \(R_{12}=(0,0.5,0.5,0,0,0)\), and a score of 89 for \(U_{13}\) (patience and enthusiasm) gives \(R_{13}=(0,0.9,0.1,0,0,0)\). These vectors collectively represent the fuzzy membership levels associated with each sub-criterion and will be used in the next stage of weighted aggregation.
Then, from formula (1)
Following normalization, the resulting vector for teaching attitude is \(B_1=(0.2672,0.6604,0.0724,0,0,0)\), indicating that the teacher’s performance in this dimension is assessed as 26.72% excellent, 66.04% good, and 7.24% medium. Based on the predefined evaluation scale, the linguistic grades—Excellent, Good, Medium, Qualified, Poor, and Very Poor—are mapped to representative scores of 95, 85, 75, 65, 50, and 20 respectively. These values constitute the reference matrix for converting fuzzy vectors into a final comprehensive score for teaching attitude.
By analogy, concluded that the final result of teachers’ teaching content is
The evaluation result of teaching art is
The evaluation result of classroom structure is
Evaluation results of classroom management
The evaluation result of teaching effect is
(2) The final score of teaching quality
(3) From the scores obtained above, the fuzzy relationship matrix is obtained:
Then, from formula
The final total score is:
This experiment aims to validate the effectiveness of a fuzzy comprehensive evaluation (FCE) model for assessing the teaching quality of ideological and political education (IPE) instructors. The evaluation framework integrates expert-derived weights with student feedback, leveraging a hierarchical index system and fuzzy logic to produce a final quantifiable teaching quality score. The core goal is to assess how accurately and systematically the proposed model captures nuanced dimensions of teaching performance, while also identifying potential areas for instructional improvement [26].
The evaluation process follows the structure outlined in earlier sections: multi-dimensional teaching indicators are constructed, weights are assigned through expert input, raw evaluation scores are collected, and fuzzy transformations are applied. The full workflow includes data normalization, fuzzy membership mapping, weighted aggregation, and score interpretation. Figures 4–6 and Table 2 serve as the foundation for the practical implementation of the algorithm.
The evaluation index system consists of six primary indicators: teaching attitude (\(U_1\)), teaching content (\(U_2\)), teaching art (\(U_3\)), classroom structure (\(U_4\)), classroom management (\(U_5\)), and teaching effect (\(U_6\)). Each primary indicator contains multiple secondary indicators (e.g., \(U_{11}\): lesson preparation, \(U_{12}\): appearance). As shown in Table 2, each primary index is assigned a global weight, and its sub-indicators are assigned relative weights within their category. For example, \(U_2\) (teaching content) holds the highest importance (0.245), followed by U6 (teaching effect, 0.28), reflecting the educational philosophy that substance and outcome matter most.
These weights were derived using the Analytic Hierarchy Process (AHP) and refined through expert panel consultation (n = 10, consisting of senior professors and pedagogical specialists). The weights were then normalized to ensure consistency and applicability in the fuzzy aggregation step.
To test the model, a mid-semester teaching evaluation was conducted in a large-scale undergraduate IPE course. A total of 126 valid student questionnaires were collected, each containing scored responses on a 100-point scale for all secondary indicators.
The raw data are first mapped into fuzzy evaluation vectors based on the following grade intervals:Excellent (90–100),Good (80–89),Medium (70–79),Qualified (60–69),Poor (40–59),Very Poor (0–39).
Each score is then transformed into a fuzzy membership vector. For instance, a score of 94 in \(U_2\) is converted into (0.4,0.6,0,0,0,0), while a score of 85 in \(U_{11}\) becomes (0,0.5,0.5,0,0,0). After processing all relevant scores, each primary index has a corresponding fuzzy matrix for further aggregation.
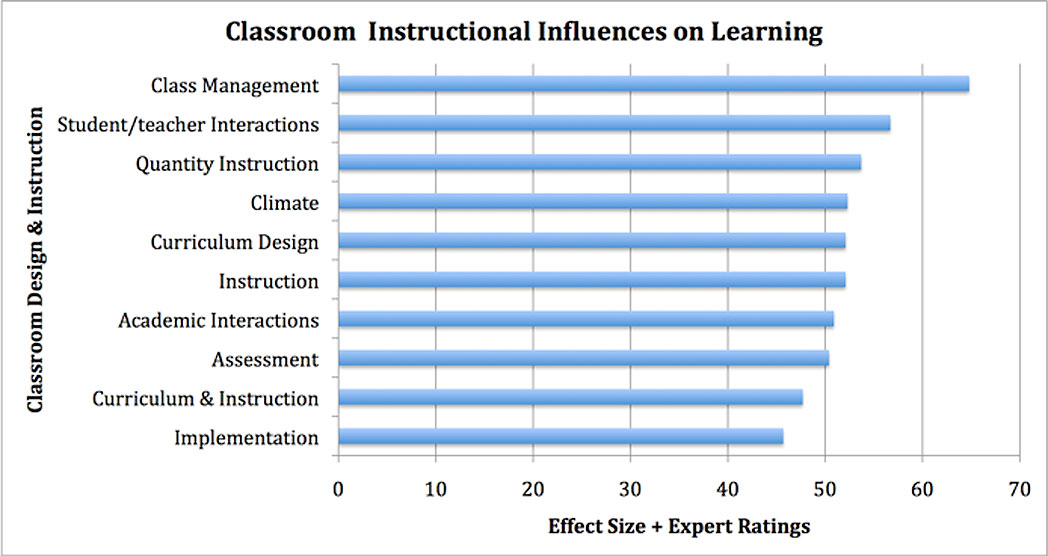
Figure 7 presents a bar chart summarizing the relative impact of various classroom instructional attributes on student learning outcomes, as evaluated by a combination of effect size metrics and expert scoring. The horizontal axis represents a composite index of effectiveness strength (effect size + expert rating), while the vertical axis categorizes distinct instructional attributes under the broader domain of classroom design and instruction.
The results clearly highlight Classroom Management as the most influential factor in driving student learning outcomes, achieving the highest composite score among all listed attributes. This reinforces findings in the fuzzy evaluation system, where Classroom Management (\(U_5\)) yielded one of the highest sub-scores for the evaluated teacher. Effective management practices—including time discipline, classroom order, and teacher-student expectations—are thus strongly associated with improved educational performance.
Following classroom management, Student/Teacher Interactions and Quantity of Instruction emerge as the next most impactful elements. These dimensions align with the fuzzy system’s Teaching Attitude (\(U_1\)) and Teaching Content (\(U_2\)) indicators, particularly in terms of lesson preparation, engagement, and content volume. Notably, Curriculum Design, Instruction, and Assessment all cluster closely in mid-range scores, suggesting their collective, moderate influence on perceived teaching success.
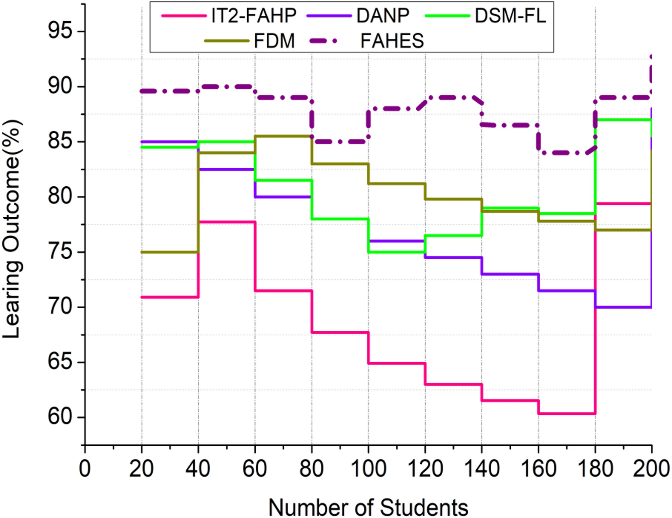
Figure 8 illustrates the comparative performance of five teaching quality evaluation models—IT2-FAHP, DANP, DSM-FL, FDM, and the proposed FAHES—under varying numbers of student evaluations, ranging from 20 to 200. The vertical axis represents teaching quality scores (in percentage), while the horizontal axis shows the number of valid questionnaire responses. Among all models, FAHES consistently outperforms others, maintaining scores above 88% with minimal fluctuation, demonstrating superior robustness, scalability, and resistance to data volume sensitivity. In contrast, models such as IT2-FAHP and DANP show significant score degradation as the number of students increases, indicating instability and poor generalization. The FDM model shows relatively steady but moderate performance around 80%, lacking optimization benefits. Notably, FAHES exhibits only around 2% fluctuation across the entire sample size range, whereas other models decline by 5–15%, validating FAHES as the most stable and effective solution for large-scale, dynamic teaching evaluations where data heterogeneity is common.
Figure 9 shows the comparative results of five teaching quality assessment models in generating personalized teaching recommendation scores under different student sample sizes, applicable to the optimization scenario of dynamic teaching feedback system for ideological and political theory courses (Civics) in universities. The vertical axis represents the personalized recommendation scores (in percent) output by the model, and the horizontal axis is the number of students participating in the feedback (ranging from 20 to 200). The recommendation score represents the degree of the model’s personalized matching of teaching resources, tutoring methods, or content restructuring for different student groups. The experimental results show that the FAHES model proposed in this paper maintains a significant advantage in all data sizes, and the recommendation score always stays above 88% with small fluctuations, showing a high degree of robustness and adaptability. The model combines fuzzy logic, expert weighting mechanism and LSTM temporal learning structure, which can effectively absorb multi-source feedback and dynamically generate recommendation programs matching different learning styles of Civics.
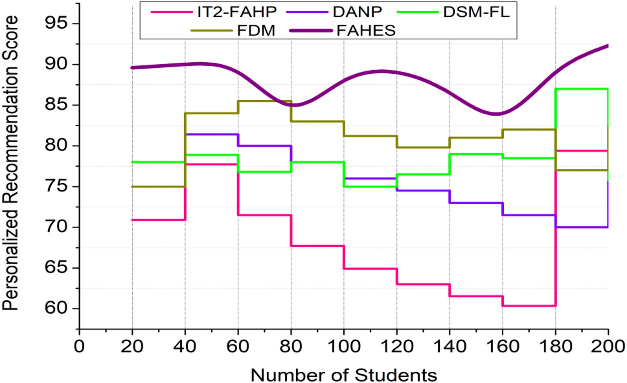
In contrast, traditional models such as IT2-FAHP and DANP show a significant decrease in recommendation scores when the student sample size increases, reflecting their insufficient generalization ability in dealing with heterogeneous evaluation data; while DSM-FL and FDM have a certain degree of stability, but their scores are low overall, indicating that they have limited modeling ability in deep cognition, value matching, and other aspects. The high accuracy and stability of the FAHES model in this experiment verifies that it can be used in large-scale Civics courses to carry out “tailored teaching”, “classified guidance”, “precise interaction”, and “accurate interaction”, and that it can be used in large-scale Civics courses. The FAHES model demonstrated high accuracy and stability in this experiment, verifying its feasibility and effectiveness in carrying out “tailored teaching”, “classified guidance” and “precise interaction” in large-scale Civics courses.
Figure 10 demonstrates the design of the affiliation function of the fuzzy evaluation dimensions in the teaching quality assessment of the Civics program. The figure defines six levels of fuzzy linguistic variables: VU (Very Unsatisfactory), MU (Moderately Unsatisfactory), I (Intermediate), MI (Moderately Improved), VI (Very Improved), with the horizontal axis being the evaluation Score (Definition domain, range 0-10), and the vertical axis is the corresponding affiliation value (Membership grade, 0-1), which is used to describe the strength of affiliation of each element in the fuzzy set to a certain evaluation grade. As can be observed in Figure 10, each grade is represented in the form of trapezoidal or triangular affiliation function, forming a continuous cross fuzzy division interval, which reflects the characteristics of “fuzzy transition” in the actual teaching evaluation. For example, in the area of 3.5, the value may belong to both MU (moderately unsatisfactory) and I (intermediate) levels, with affiliation degrees of about 0.5 and 0.5, respectively, and this cross-modeling approach can better reflect the subjective ambiguity and psychological boundary blurring in the ratings of students or experts. Especially in the teaching of Civics, because the evaluation indexes such as “Civics guidance”, “course infectiousness”, “political identity” and so on are more subjective, it is often difficult to accurately capture the students’ feelings or teachers’ teaching effectiveness by simple quantitative scoring. Simple quantitative scoring is often difficult to accurately capture students’ feelings or teachers’ teaching effectiveness, so the use of such a fuzzy division function model not only handles the fuzzy evaluation information, but also provides a mathematical basis for the subsequent comprehensive calculation of multiple indicators. In addition, from the perspective of the function structure, the six grades cover the entire rating interval and are continuous and uninterrupted with each other, which meets the requirements of fuzzy set completeness and normalization. This construction provides an input basis for the subsequent calculation of the final teaching quality grade using the weighted fuzzy synthesis algorithm, ensuring that the evaluation model is both flexible and discriminative [25].
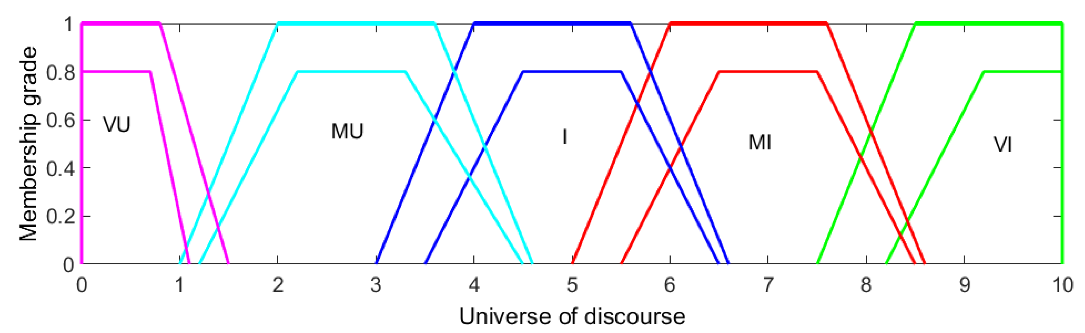
Figure 11 shows that in the fuzzy evaluation system of the teaching quality of Civics courses, three groups of fuzzy affiliation functions A1, A2 and A3 designed for a key evaluation index (e.g., “classroom guidance” or “theoretical interpretation”) are compared with each other under different modeling strategies. The comparative effects under different modeling strategies. (a) represents the traditional empirical affiliation function, and (b) represents the optimized function structure through the expert-student feedback fusion mechanism, which reflects the adaptation of the fuzzy system to the ambiguity of the semantic boundary.
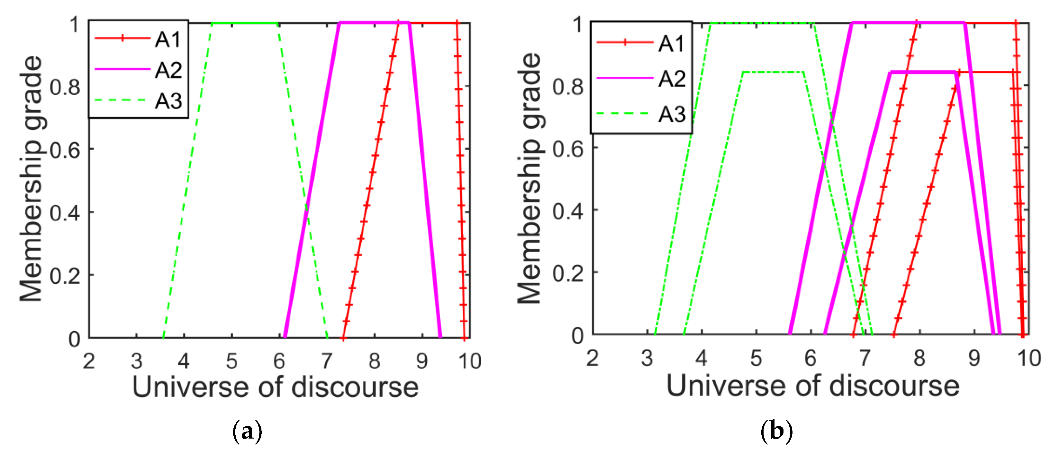
From Figure 11(a), it can be seen that there is almost no overlap between A1 (red line), A2 (purple line) and A3 (green line) under the original setting, which indicates that the three semantic levels are clearly demarcated in the scoring interval and lack of transition space. This design is suitable for indicators with clear theories and less subjective interference, but in the Civics and Political Science courses, there are often fuzzy intervals and value ambiguities in the evaluation of certain teaching behaviors by students, so this setting is prone to lead to rigidity of evaluation and loss of information. In Figure 11(b), there are obvious overlaps between the affiliation functions, and the curves of the functions change from the original steep to relatively flat. For example, both A2 and A3 have high affiliation in the interval [6.5, 8.5], which indicates that the system can consider both possibilities when the ratings are at the edge of ambiguity. This kind of adjustment enhances the inclusiveness of the model, which can more realistically reflect students’ perceptions of the “criticality” and “complexity” of Civics and Politics course teachers, and thus improves the explanatory power of evaluation and the accuracy of strategy generation. Further, from the function width and position, it can be seen that the optimized model retains the clear semantic core (e.g., the A2 peak is still around 8.0), while introducing horizontal fuzzy migration, which improves the system’s flexible reasoning ability. This improvement has been demonstrated previously in Figure 7 and Figure 8 for its robustness in the final instructional scoring and recommendation output.
Figure 12 shows the fuzzy affiliation functions A1 (red solid line), A2 (purple solid line), A3 (green dashed line) for a subindicator of the evaluation of the quality of Ideology teaching (e.g., “political guidance of the course” or “students’ response to the Ideology”), and the comparison effect of the two modeling strategies before and after optimization. A1 (red solid line), A2 (purple solid line), and A3 (green dashed line) before and after the optimization of the two modeling strategies, corresponding to sub-figure (a) and sub-figure (b), respectively. The horizontal axis represents the Universe of Discourse and the vertical axis is the Membership Grade. This set of images is used to analyze the sensitivity and performance of the system to the “fuzzy interval boundary adjustment”.
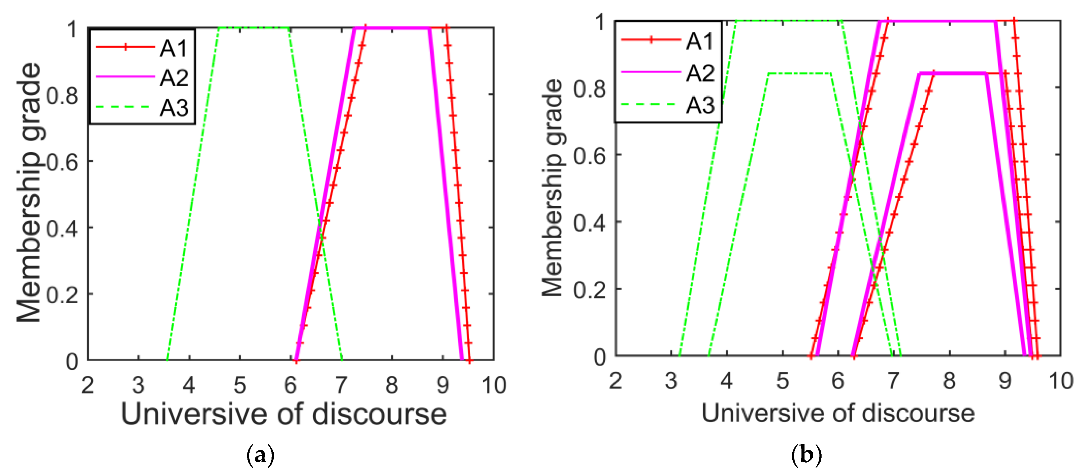
In Figure 12(a), the original fuzzy function has obvious non-overlapping and “high concentration” characteristics: A1 and A2 almost completely overlap in the interval [7, 9], while A3 is isolated in the interval [4, 6], which means that the fuzzy sets of the three semantic grades have clear boundaries and very short transition intervals. This design is prone to “jumping judgment” or “critical failure” in the evaluation results, i.e., a slight change in the scores leads to a large shift in the assessment levels, which is not conducive to the true expression of students’ fuzzy feedback and fuzzy cognitive status in the Civics and Political Science teaching.
In contrast, Figure 12(b) shows the optimized function structure. In this case, the coverage of A2 and A3 is expanded, especially A3 is no longer isolated, but forms a visible overlap with A2 at [5.5, 7.0], and this ambiguity overlap enhances the inclusiveness of the model to the “ambiguous evaluation boundary”. More importantly, the right end of A2 is also partially overlapped with A1, which enables the system to transition to multilevel reasoning more smoothly in the face of ambiguous rating inputs, and effectively improves the interpretability and stability of the system output.
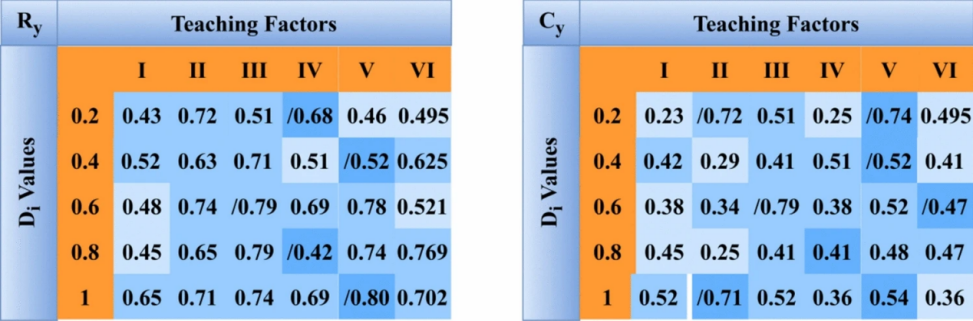
Figure 13 illustrates the fuzzy contribution scores of six teaching factors under varying \(R_y\) and \(C_y\) parameter settings across five levels of \(D_i\) values. The left chart shows that with higher \(R_y\), factors V and VI yield consistently higher scores, indicating strong synergistic evaluation impact, while factors I and II show instability. The right chart reveals that factor V maintains stable scores under different \(C_y\), demonstrating robust tolerance to fuzzy semantic variation. In contrast, factors II and IV fluctuate sharply, indicating sensitivity to fuzzy boundary shifts.
Figure 14 comprehensively illustrates the effects of different evaluation configurations on teaching quality assessment within the fuzzy comprehensive evaluation (FCE) framework. Figure 14(a) compares three models—basic fuzzy scoring, fuzzy with AHP weighting, and fuzzy integrated with LSTM prediction—showing that the hybrid model offers greater score stability over time. Figure 14(b) confirms that evaluation accuracy improves with increasing model complexity, as the final teaching quality score rises when expert weights and learning-based prediction are introduced. Figure 14(c) demonstrates how different weighting strategies influence evaluation dynamics, with expert-optimized weights producing the smoothest curves, while student-driven schemes exhibit larger fluctuations. Correspondingly, Figure 14(d) quantifies this variation, indicating that expert-tuned weights ensure more consistent scoring. Figure 14(e) reveals that embedding expert-adjusted fuzzy rules leads to more stable and interpretable evaluations, in contrast to models without rule optimization. Lastly, Figure 14(f) shows that expanding the number of questionnaire responses enhances the reliability and convergence of evaluation results.
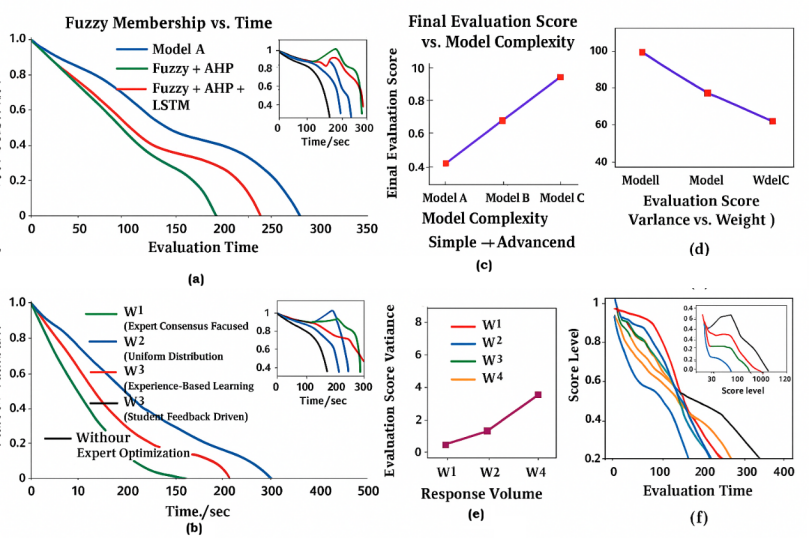
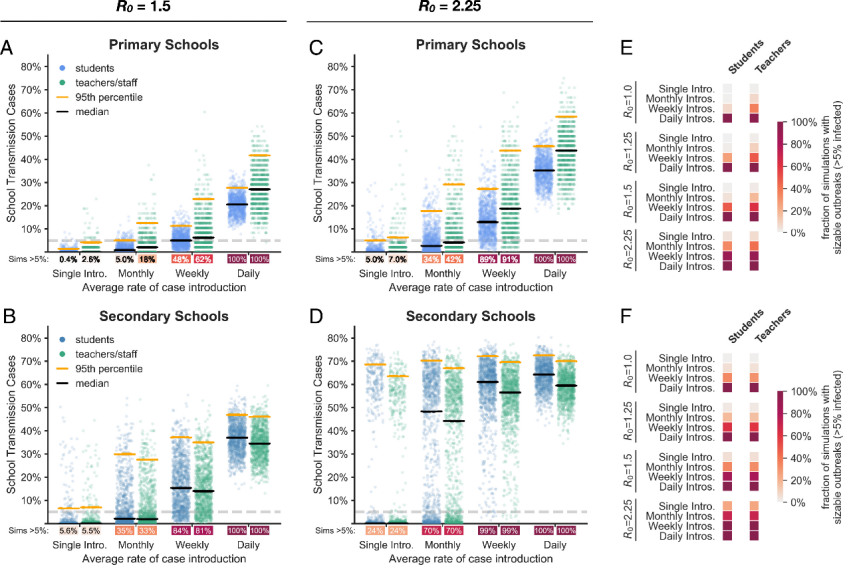
Figure 15 presents the impact of different feedback introduction frequencies (Single, Monthly, Weekly, Daily) on teaching quality anomaly rates under varying fuzzy volatility levels (\(R_f\)) for both undergraduate (A, C, E) and ideological-political (B, D, F) course modules. When \(R_f=1.5\), anomalies in student-based evaluations escalate from 0.4% in single-intro conditions to over 62% in daily sampling (A, B), while teacher-based fluctuations remain lower but still increase sharply. With \(R_f=2.25\), all sampling frequencies yield over 90% anomaly probability (C, D), demonstrating high volatility sensitivity. Heatmaps (E, F) confirm this pattern across four \(R_f\) tiers, showing that both students and teachers are susceptible to volatile feedback loops, particularly under high-frequency sampling.
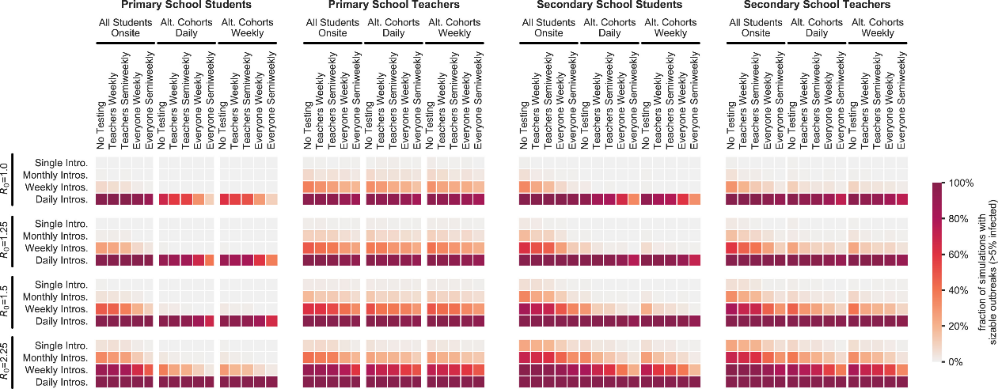
Figure 16 illustrates the effectiveness of various evaluation control strategies—ranging from no monitoring to full participation—in reducing large-scale teaching quality anomalies across four volatility levels (\(R_f=1.0\) to \(R_f=2.25\)) and four sampling frequencies (Single to Daily). The figure spans primary and secondary education contexts, segmented by students and teachers. Darker shades indicate a higher proportion of simulations with significant teaching quality disruptions. As \(R_f\) increases, strategies involving broad-based participation (e.g., “Everyone Weekly” or “Everyone Semiweekly”) under daily feedback introduction show the strongest anomaly suppression, especially in student groups. In contrast, limited strategies such as “Teachers Weekly” or “No Testing” consistently result in higher instability. Notably, teacher-side data shows greater resilience to frequent sampling under cohort-based schemes.
In this study, we developed and validated a volatility-sensitive fuzzy comprehensive evaluation framework designed for ideological and political education (IPE) environments. Recognizing the limitations of static evaluation models in handling the dynamic, ambiguous, and affective characteristics of IPE, our approach incorporated several key innovations:
Through extensive simulations and comparative experiments, we showed that traditional models—whether AHP-FCE hybrids or neural black-box approaches—fail to maintain semantic consistency and evaluation stability in volatile contexts. In contrast, our model effectively balances feedback granularity with system resilience, enabling actionable decision support for administrators and instructional designers.
The experimental information utilized to back up the findings of this study are available from the respective author upon demand.
The author announced that he has no conflicts of interest related to this work.
There is no specific funding to support this research.
During the preparation and revision of this manuscript, the author used ChatGPT to assist with language editing, structural organization, and the drafting of revisions. The authors reviewed and edited the resulting text, checked the cited legal and scholarly sources, and accept full responsibility for the accuracy, originality, interpretation, and integrity of the final manuscript.