
In the natural world, organisms exhibit complex and adaptive behaviors in response to changing environmental conditions. Biological systems survive through coordinated activity, continuous information exchange, efficient energy distribution, functional specialization, and adaptation to internal and external disturbances. These characteristics provide a potentially useful conceptual analogy for examining how modern industries, particularly the digital economy and manufacturing industry, evolve and reorganize their processes [1]–[3]. Like biological systems, industrial systems consist of interconnected components whose performance depends on coordination, resource availability, information transmission, environmental responsiveness, and the capacity to adapt to change. However, the use of biological terminology in this study is conceptual: it offers an interpretive framework for economic and industrial relationships rather than constituting direct biological or biomechanical measurement.
The development of the digital economy has substantially changed the mechanisms through which information, technology, capital, labor, and production resources are allocated. Digital infrastructure, data analytics, industrial platforms, cloud computing, artificial intelligence, and networked communication systems can reduce information asymmetry and improve coordination among firms, suppliers, consumers, and public institutions. These developments may contribute to industrial upgrading by lowering transaction costs, increasing production flexibility, accelerating innovation, and supporting more efficient resource allocation [4]–[6]. Nevertheless, the benefits of digitalization may not be distributed equally. Regional differences in infrastructure, technological capacity, workforce skills, investment, market development, and institutional support can produce substantial variations in the extent to which manufacturing industries benefit from digital transformation.
Within the biological analogy adopted in this study, the digital economy can be compared with an information-transmission network similar to a nervous system. It supports the collection, transmission, processing, and coordination of information across different components of an industrial system. The manufacturing sector may be compared with an operational or productive system that converts resources, information, labor, and technological inputs into material outputs. This analogy emphasizes interdependence: information systems cannot generate industrial transformation independently, while manufacturing enterprises cannot fully exploit digital resources without suitable infrastructure, organizational capacity, and technological integration. The analogy is therefore used to clarify relationships among information flows, resource coordination, industrial specialization, and adaptive production.
The comparison with biological systems should not be interpreted as evidence that economic variables are equivalent to physiological structures or that manufacturing systems obey biomechanical laws. Economic elasticity, industrial resilience, production flexibility, and resource mobility are conceptually different from the elasticity, force transmission, and movement of biological tissues. Nevertheless, both domains involve questions of system organization, responses to disturbances, and the distribution of limited resources. A carefully bounded analogy can therefore support theoretical interpretation, provided that metaphorical similarities are not presented as experimentally established equivalences.
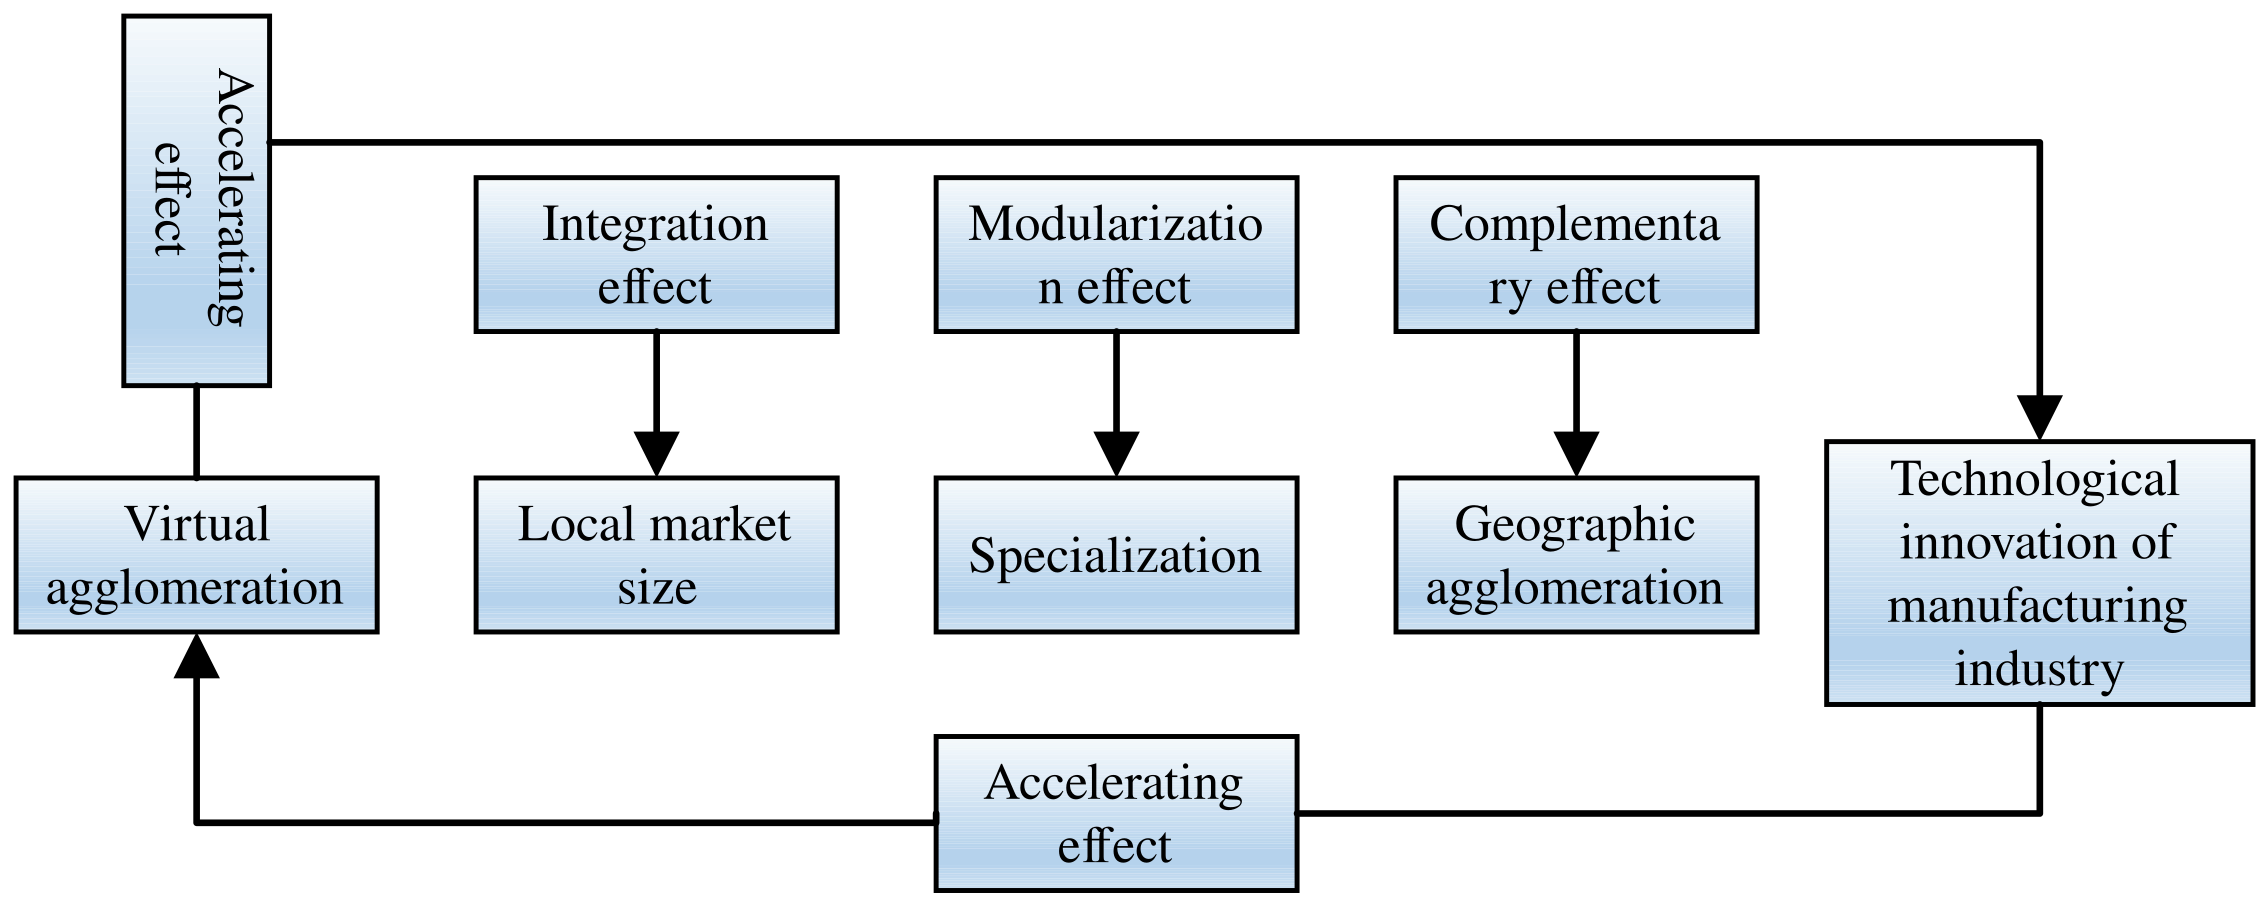
The transformation and upgrading of manufacturing involve more than the introduction of individual digital technologies. Industrial upgrading may include improvements in productivity, technological intensity, organizational flexibility, product quality, innovation capability, energy efficiency, and participation in higher-value segments of production networks. Digitalization may influence these outcomes through several mechanisms. First, an integration effect can connect previously separated production stages and improve coordination across enterprises. Second, a modularization effect can facilitate specialization while preserving interoperability among production units. Third, a complementarity effect can strengthen the combined value of data, skilled labor, machinery, and organizational knowledge. Fourth, an acceleration effect can shorten the time required for information exchange, operational adjustment, innovation, and market response.
These mechanisms are closely related to the geographical organization of economic activity. Improved digital connectivity may reduce certain forms of market segmentation and enable firms to coordinate activities across greater distances. At the same time, digital industries may remain concentrated in regions with advanced information infrastructure, research institutions, skilled labor, investment resources, and established industrial networks. Digitalization can therefore produce both dispersive and agglomerative effects. It may expand access to information and markets while simultaneously reinforcing the advantages of regions that already possess strong technological and institutional foundations.
The D–S model provides a theoretical basis for examining the relationships among market scale, product differentiation, transportation or transaction costs, industrial concentration, and geographical agglomeration. Extending this framework to the digital economy makes it possible to consider how reduced information costs and improved connectivity may alter the spatial organization of manufacturing. In this context, digital technologies can affect the conditions under which firms choose locations, coordinate production, enter markets, and participate in specialized industrial networks. The extended D–S framework is used in this study to interpret the effects of digitalization on manufacturing transformation without assuming that all regions or industries respond uniformly.
In addition to the theoretical model, principal component analysis (PCA) provides a method for reducing a group of correlated indicators to a smaller number of composite dimensions. This approach can be used to assess regional differences in digital-economy development when multiple indicators reflect related aspects of infrastructure, industrial capacity, technological innovation, and digital activity. The resulting component scores permit comparative evaluation of the selected regions. However, the interpretation of these scores depends on transparent variable definitions, consistent data sources, appropriate standardization, and a clearly specified observation period.
Vector autoregressive (VAR) analysis offers a complementary framework for examining dynamic associations among time-dependent economic variables. Rather than imposing a strictly one-directional relationship, a VAR model treats the included variables as jointly evolving processes whose present values may be associated with their own past values and the lagged values of other variables. In the present study, the VAR framework is intended to examine temporal interactions between indicators of digital-economy development and manufacturing transformation. These relationships must be interpreted as model-based dynamic associations rather than definitive causal effects because causality cannot be established solely through coefficient estimates, lag selection, impulse-response functions, or variance decomposition.
Digital transformation can also affect the organization of human labor in manufacturing. Automation, robotics, intelligent production systems, wearable devices, and digitally assisted workstations may change task allocation, worker-machine interaction, posture, repetition, and physical workload. These issues create an important connection between digital manufacturing and occupational ergonomics. Biomechanical research could, in principle, measure movement trajectories, joint angles, external forces, muscle activity, fatigue, and energy expenditure before and after the implementation of digital production technologies. Such measurements could help determine whether digital transformation improves productivity while protecting worker health.
The present study, however, does not report a participant-based biomechanical experiment. It does not provide measured movement trajectories, joint forces, muscle-activation signals, gait recordings, physiological responses, or validated fatigue assessments. Accordingly, biomechanical examples are employed only to illustrate possible future applications of the proposed interdisciplinary framework. They should not be interpreted as empirical findings concerning workers, workplace injuries, ergonomic improvement, energy consumption, or production efficiency. Direct evaluation of these outcomes would require a defined worker sample, ethical approval, calibrated motion-capture or force-measurement equipment, standardized production tasks, repeated observations, and appropriate statistical analysis.
This distinction is particularly important because conceptual resemblance does not establish empirical correspondence. For example, the transmission of force through biological tissues may offer a metaphor for the transmission of information across industrial networks, but these processes are governed by different mechanisms and measured using different variables. Similarly, biological adaptation may help illustrate industrial adjustment to market change, but it does not demonstrate that firms behave as organisms. The biological analogy is therefore used as an explanatory device that complements, rather than replaces, established economic concepts and quantitative analysis.
The existing literature has examined digital-economy development, industrial transformation, technological innovation, resource allocation, and regional differences from several perspectives. However, additional analysis is required to explain how information infrastructure and digital coordination interact with manufacturing agglomeration, modular specialization, innovation capability, and adaptive capacity. There is also a need to distinguish clearly between economic evidence derived from regional indicators and conceptual propositions concerning human performance or biological systems. Combining these dimensions without defining their respective evidentiary status can lead to unsupported causal claims and ambiguous interpretations.
To address this issue, the present study develops an analytical framework comprising three connected but distinct components. First, an extended D–S model is used to explain how digitalization may influence transaction costs, industrial organization, and geographical agglomeration. Second, PCA is employed to construct a composite assessment of digital-economy development and compare the selected Chinese regions. Third, VAR analysis is applied to investigate temporal associations among the selected economic indicators. Biological-system concepts are used only to interpret coordination, adaptation, and resource distribution at a conceptual level.
Accordingly, this study aims to answer three principal questions. First, how can the D–S framework be extended to explain the influence of digital technologies on manufacturing transformation and spatial organization? Second, what regional differences emerge from the composite assessment of digital-economy development? Third, what dynamic associations are observed among the selected indicators within the VAR framework? Addressing these questions provides a more coherent basis for evaluating the role of the digital economy in manufacturing transformation while maintaining a clear separation between theoretical analogy, economic modeling, and any future biomechanical investigation.
The contribution of this study lies in its integration of spatial-economic reasoning, multivariate regional assessment, and time-series analysis within a carefully limited biological-systems analogy. The framework emphasizes that manufacturing transformation depends on interactions among information infrastructure, technological innovation, industrial organization, regional capacity, and adaptive coordination. It also identifies a future research direction in which independently collected biomechanical and ergonomic data could be integrated with production and economic indicators. Such future integration may support a more comprehensive evaluation of productivity, worker health, and sustainable industrial development, but it must be based on transparent data collection and direct empirical measurement.
During manufacturing transformation under the digital economy, processes such as information transmission, resource allocation, functional specialization, feedback, and system adaptation may be interpreted through a carefully bounded biological-systems analogy. Biological systems maintain their functions through interactions among specialized components, the distribution of energy and materials, and continuous responses to internal and external changes. Industrial systems similarly depend on communication, coordination, resource availability, organizational structure, and the capacity to respond to changes in technology and market demand. Applying this analogy to industrial ecosystems may provide an additional perspective for interpreting coordination, adaptation, and collaborative development within the digital economy [17].
This comparison is employed as a conceptual and explanatory framework rather than as a direct application of biomechanical laws to economic systems. Biomechanics investigates the forces, motions, deformations, and material properties associated with biological structures. Manufacturing transformation, by contrast, concerns economic, technological, organizational, and spatial processes. Although both fields address coordination, transmission, stability, efficiency, and adaptation, their variables and causal mechanisms are not equivalent. The analogy therefore helps organize the theoretical discussion but does not replace economic modeling or constitute empirical biomechanical evidence.
In biological systems, coordinated transmission enables specialized tissues and organs to function as components of an integrated organism. Mechanical forces may be transmitted through muscles, tendons, bones, and joints, while neural and biochemical signals coordinate responses across different regions of the body. The effectiveness of the system depends not only on the performance of individual components but also on the reliability and efficiency of the connections among them.
A comparable principle can be used to interpret resource coordination within digitally connected manufacturing systems. Digital platforms link enterprises, suppliers, production facilities, logistics providers, consumers, and regulatory institutions. These connections facilitate the exchange of production information, inventory data, market signals, technical specifications, and operational instructions. By reducing delays and information asymmetries, digital platforms may improve the coordination of geographically or organizationally separated manufacturing activities.
The analogy between tendons or ligaments and digital platforms should be interpreted cautiously. Tendons and ligaments transmit or constrain mechanical forces within biological joints, whereas digital platforms transmit information and facilitate organizational coordination. The two systems do not perform identical functions and are not governed by the same physical principles. Their conceptual similarity lies in their connective roles: both contribute to system-level coordination by linking otherwise separate components.
Modularization represents another relevant characteristic of digitally transformed manufacturing. A manufacturing process may be divided into specialized modules that perform distinct functions while remaining connected through common technical standards, data interfaces, and production requirements. This organization can improve flexibility because individual modules may be modified, replaced, expanded, or relocated without requiring the complete reconstruction of the production system. Within the biological analogy, this arrangement resembles functional specialization among organs or tissues, although the similarity remains organizational rather than biomechanical.
Biological organisms also depend on the regulated distribution of energy and materials. Metabolic pathways transport and transform substances to support cellular maintenance, growth, repair, and activity. In manufacturing systems, materials, energy, capital, labor, equipment, and information must similarly be directed toward processes in which they are most needed. Big-data analytics, industrial Internet of Things systems, enterprise platforms, and automated monitoring technologies can assist managers in identifying shortages, bottlenecks, excessive consumption, equipment failures, and variations in production demand.
Digital monitoring does not automatically guarantee optimal resource allocation. Its effectiveness depends on data quality, interoperability, organizational capacity, cybersecurity, workforce skills, infrastructure reliability, and managerial decision-making. Nevertheless, when these conditions are satisfied, digital technologies may support more timely allocation of production resources, reduce avoidable delays, limit material waste, and improve coordination among different stages of the manufacturing process.
The concept of energy flow must also be defined carefully. In a biological system, energy flow refers to physiological and biochemical processes. In manufacturing, it may refer to electrical energy, fuel consumption, human labor, financial expenditure, or the metaphorical movement of productive capacity. These meanings should not be treated as interchangeable. In the present conceptual framework, energy flow refers broadly to the allocation and utilization of production-related resources rather than to a directly measured biomechanical variable.
Biological systems demonstrate an ability to respond to changes in load, temperature, terrain, resource availability, and other environmental conditions. These responses may involve immediate regulation, behavioral adjustment, or longer-term adaptation. Manufacturing enterprises also operate in changing environments and must respond to variations in consumer demand, input prices, technological standards, supply-chain conditions, regulatory requirements, and competitive pressure.
The digital economy can strengthen industrial responsiveness by improving the speed with which information is collected, analyzed, and transmitted. Real-time production monitoring can help enterprises identify operational disruptions, while demand analysis can support adjustments in production volume and product configuration. Digitally connected supply chains may also allow firms to locate alternative suppliers, redirect logistics, modify inventories, and reorganize production schedules when established arrangements are disrupted.
External shocks, including public-health emergencies, natural disasters, geopolitical disruptions, and sudden market fluctuations, can expose weaknesses in conventional production and supply systems. During such disturbances, digital communication, remote coordination, automated monitoring, and data-supported decision-making may improve organizational flexibility. However, digital dependence can create additional vulnerabilities, including cybersecurity risks, platform concentration, system incompatibility, and unequal access to technical infrastructure. Digitalization should therefore be understood as changing the nature of industrial resilience rather than guaranteeing resilience under all conditions.
The response of a biological limb to uneven terrain provides a limited analogy for industrial adjustment. A biological system redistributes muscular activity and mechanical loading to maintain balance, whereas a manufacturing enterprise may reallocate materials, labor, capital, or production capacity to preserve operational continuity. The similarity concerns adaptive redistribution in response to disturbance. It does not indicate that the economic process is biomechanical or that the industrial response can be evaluated using physiological measurements. Similarly, digital tools may enable manufacturers to dynamically reallocate resources, prioritize production activities, and reorganize supply chains in response to changing consumer demand and external disruptions [18].
Feedback is central to both biological regulation and digitally supported manufacturing. In biological systems, sensory information can trigger rapid responses that help maintain stability. In manufacturing, sensors, production-management systems, and digital platforms can provide continuous information concerning equipment condition, process quality, inventory, energy consumption, and production output. Managers or automated control systems may then use this information to modify operations and reduce emerging inefficiencies.
Digital-twin technology offers a particularly relevant example of feedback-based industrial coordination. A digital twin represents selected characteristics and behaviors of a physical asset, production line, or manufacturing process within a digital environment. When connected to current operational data, it can support monitoring, simulation, fault detection, predictive maintenance, and evaluation of alternative production decisions. Its function may be compared conceptually with a feedback mechanism, but it should not be equated with a biological reflex arc because the underlying structures and response processes are fundamentally different.
The biological-systems analogy therefore highlights three general characteristics of manufacturing transformation: coordination among specialized components, regulated allocation of resources, and adaptation through feedback. These characteristics provide a useful vocabulary for interpreting the organization of digitally connected manufacturing. Nevertheless, the explanatory value of the analogy depends on maintaining a clear distinction between metaphor and measurement. Claims concerning manufacturing productivity, resource efficiency, resilience, or regional development must ultimately be evaluated using transparent economic and industrial data rather than inferred solely from biological similarity.
The extension of the D–S model provides a mathematical framework for examining the relationships among the digital economy, differentiated production, transaction costs, geographical agglomeration, and manufacturing transformation. Within this framework, digital-economy development can influence manufacturing by reducing information-search costs, improving interregional coordination, supporting modular production, and strengthening the circulation of production-related information. The biological-systems perspective introduced in the preceding section complements the economic model by emphasizing coordination, adaptation, resource distribution, and dynamic adjustment. However, this perspective remains an interpretive analogy and does not represent direct biomechanical measurement or the application of biomechanical equations to economic data.
In biomechanics, elastic biological tissues can deform under an applied load and recover some or all of their original configuration after the load is removed. This property contributes to force absorption, load redistribution, movement, and structural protection. Economic elasticity has a different technical meaning: it describes the responsiveness of one economic variable to a change in another. Although the two concepts share the general idea of responsiveness, biological elasticity and economic elasticity should not be treated as equivalent quantities.
Within manufacturing, organizational flexibility allows firms to adjust production volumes, product configurations, supply arrangements, and labor allocation in response to changes in demand or technology. Digital platforms and information systems may improve this flexibility by accelerating communication and making production information available across organizational boundaries. In this limited conceptual sense, a flexible manufacturing network may be compared with an adaptive biological structure that distributes demands among its interconnected components.
The modular division of labor provides one example of this organizational responsiveness. Different production units can perform specialized functions while remaining connected through common technical standards, digital interfaces, and supply-chain arrangements. This modular structure allows enterprises to reorganize or replace individual production components without reconstructing the entire manufacturing system. The arrangement resembles the coordinated contribution of specialized biological structures, but the resemblance concerns functional organization rather than a measurable biomechanical relationship.
The integration effect of the digital economy may also help manufacturing systems respond to market volatility and other external disturbances. Improved information exchange can support the redistribution of materials, capital, labor, and production capacity across firms or regions. This process may help enterprises maintain operational continuity and respond more rapidly to changes in consumer demand. Nevertheless, the capacity to absorb economic shocks depends on infrastructure, organizational competence, institutional conditions, and access to resources; it cannot be inferred solely from the biological analogy.
Ecology, rather than biomechanics in a narrow sense, examines population-level phenomena such as migration, competition, cooperation, and the distribution of organisms across resource environments. These ecological processes provide a limited analogy for the geographical concentration and interaction of manufacturing enterprises. The D–S framework examines industrial agglomeration by considering differentiated products, increasing returns, market size, and the costs associated with trade or spatial separation.
Just as biological populations may concentrate in environments with favorable resources, manufacturing enterprises may agglomerate in regions possessing developed digital infrastructure, skilled labor, research institutions, financial resources, transportation networks, and established supply chains. Industrial clustering can improve access to specialized services, facilitate knowledge exchange, and reduce certain coordination and transaction costs. At the same time, agglomeration can intensify competition for labor, land, capital, energy, and other limited resources.
The movement of biological populations toward resource-rich environments provides another conceptual analogy for the spatial reorganization of manufacturing activity. Digital logistics, electronic marketplaces, data-based transportation planning, and networked supply-chain systems may enable firms to reach distant markets and coordinate production over wider geographical areas. Nevertheless, digital connectivity does not eliminate physical distance because manufactured products must still be transported, and firms remain affected by infrastructure, delivery time, institutional differences, and transportation costs.
These conceptual parallels provide an additional way to interpret the spatial and organizational effects of digitalization [17]. However, biological migration, industrial relocation, and economic agglomeration are governed by different mechanisms. The analogy is therefore used to support theoretical explanation and is not treated as proof of the geographical effects derived from the D–S model.
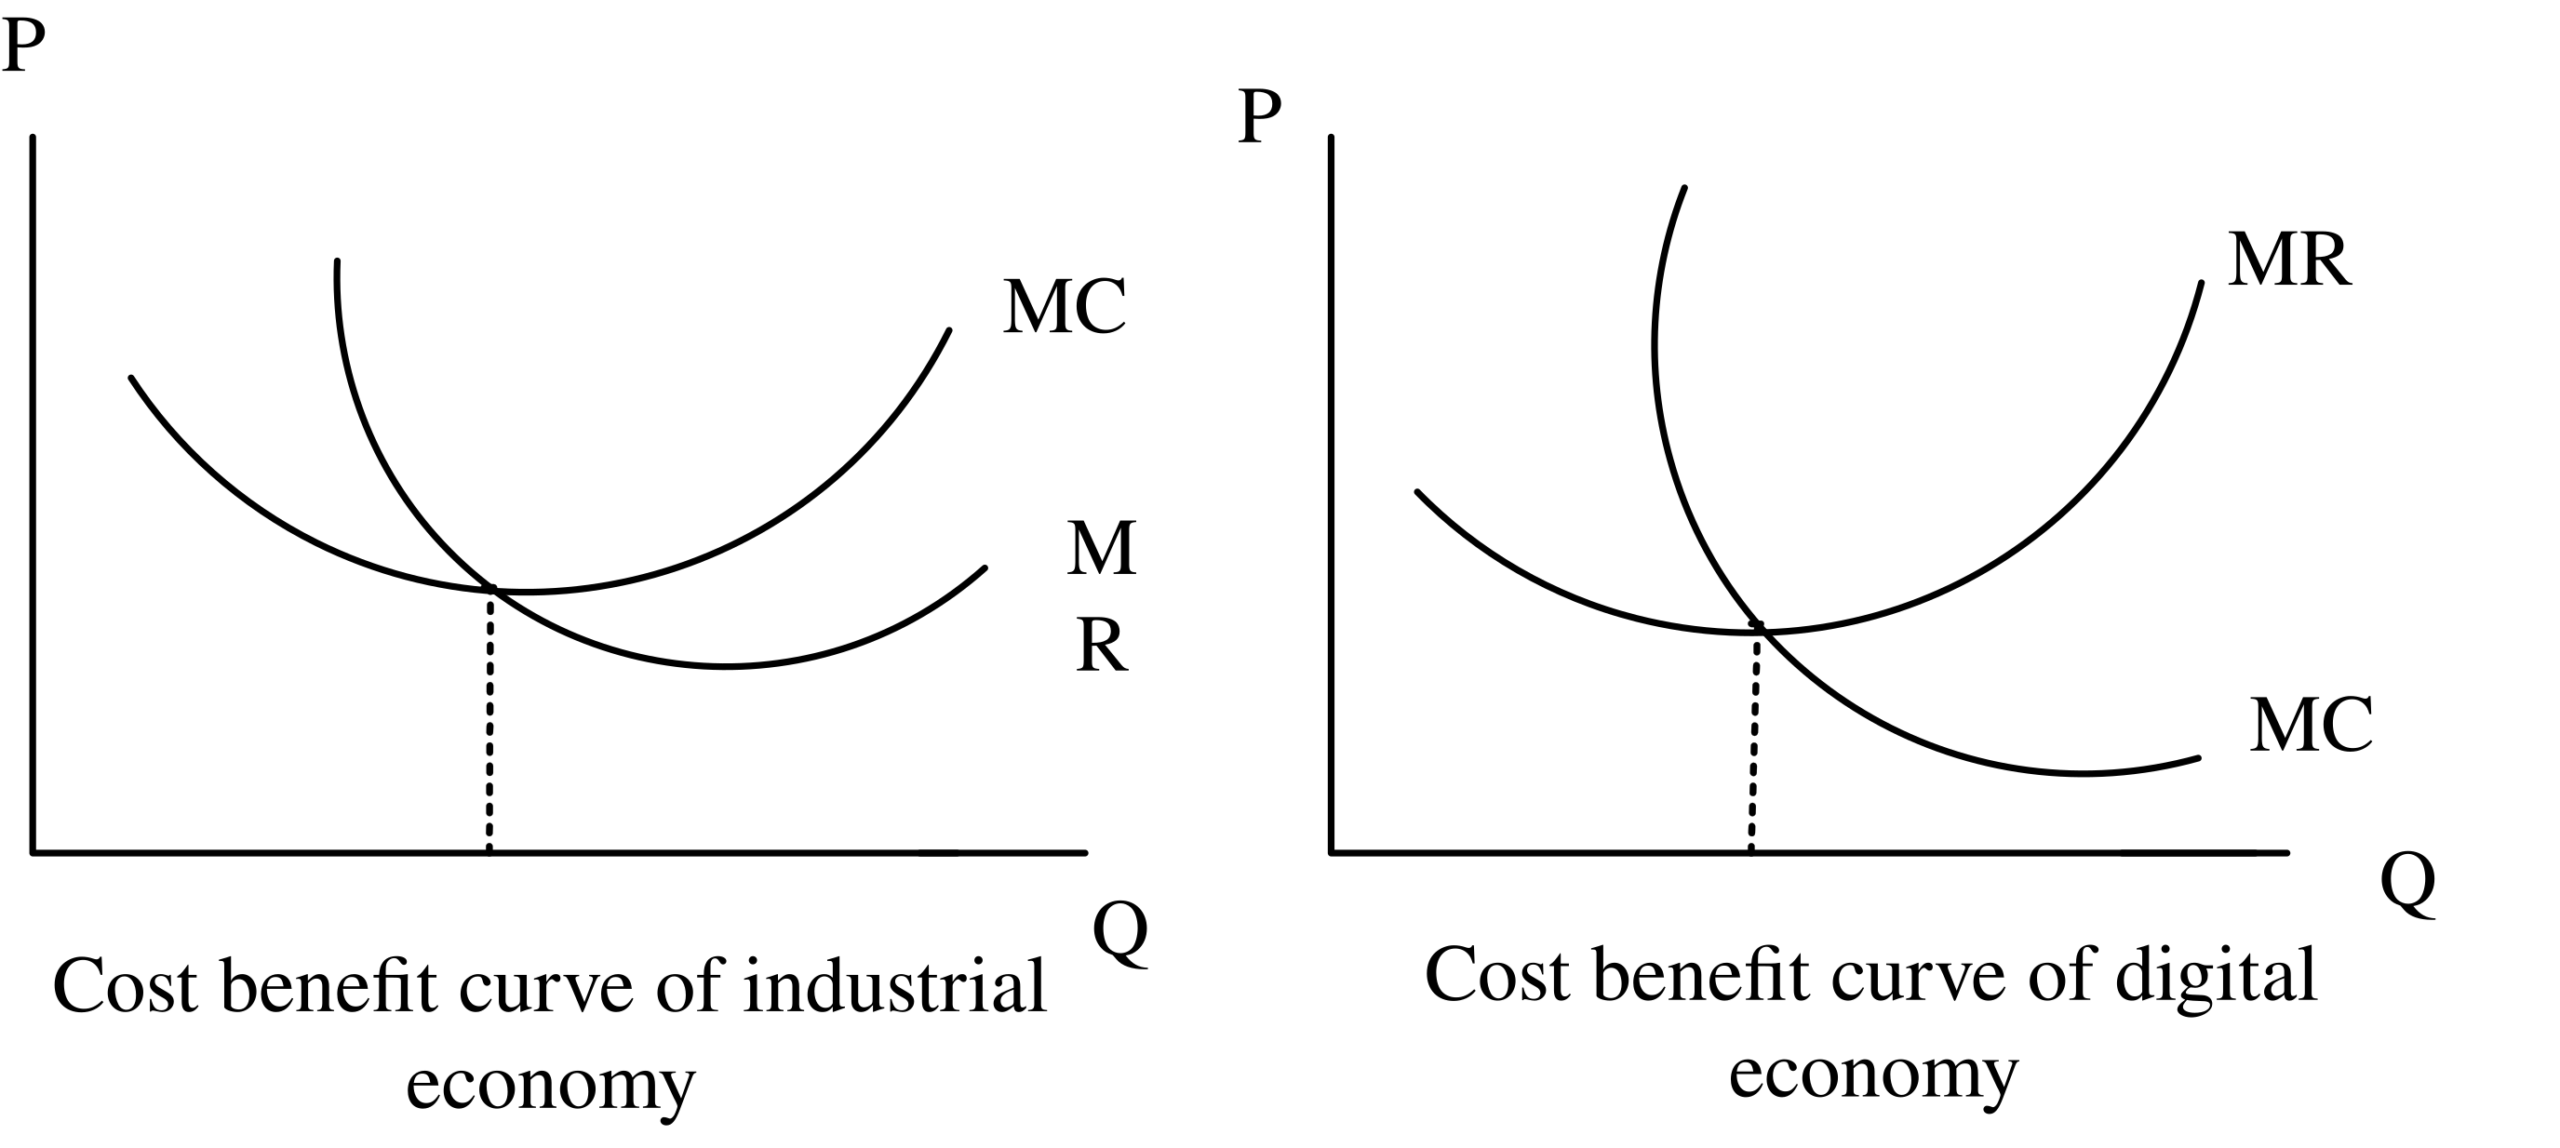
The expansion of the digital economy has introduced cost structures and benefit patterns that may differ from those associated with conventional industrial production. In a traditional manufacturing setting, marginal benefits may decline as output expands, while marginal costs may increase because of capacity constraints, additional labor requirements, material scarcity, congestion, or other production limitations. Digital products, by contrast, may involve substantial initial development costs but comparatively low marginal reproduction or distribution costs.
Figure 1 provides a conceptual representation of these contrasting tendencies. The curves are schematic and are not estimated from the empirical dataset used in the subsequent statistical analysis. Accordingly, the figure should be interpreted as a theoretical illustration rather than as evidence that marginal benefits and marginal costs always move in opposite directions in digital and industrial markets.
The relationship shown in Figure 1 suggests that conventional economic assumptions may require careful reconsideration when they are applied to information-intensive products and digitally mediated production. However, the direction and magnitude of marginal costs and benefits depend on the type of digital product, market structure, network effects, infrastructure expenses, data-management costs, cybersecurity requirements, and regulatory environment. The digital economy should not therefore be assumed to possess universally decreasing marginal costs or increasing marginal benefits.
Consumer-centered production has become increasingly important within digitally connected markets. Personalized production, flexible manufacturing, environmentally responsible production, and cost-efficient intelligent manufacturing represent important directions for industrial development. Digital technologies may strengthen interactions among manufacturers, suppliers, logistics providers, and consumers by improving the speed and accuracy of information exchange.
From a geographical perspective, digitalization may exert both dispersive and agglomerative effects. On the one hand, digital platforms may reduce certain forms of local market segmentation by improving access to information, services, suppliers, and consumers across regions. On the other hand, digital industries and advanced manufacturing activities may remain concentrated in locations with strong infrastructure, skilled labor, research capacity, investment, and supportive institutions. Digitalization may therefore reduce some barriers associated with geographical separation while reinforcing the advantages of already-developed industrial regions.
From the production perspective, new information technologies may improve the coordination of manufacturing activities and reduce information-related transaction costs. Big-data analysis can support demand forecasting and production scheduling, while digital logistics systems can assist in the optimization of transportation routes. Digital platforms may also promote modular specialization by enabling different enterprises or production units to coordinate their activities through shared data, standards, and interfaces.
The principal mechanisms considered in this study are summarized in Figure 2. These mechanisms comprise the integration effect, modularization effect, complementarity effect, and acceleration effect. The integration effect refers to improved coordination among production stages and participating organizations. The modularization effect concerns the division of complex production processes into specialized but interoperable components. The complementarity effect reflects the combined value produced when digital technologies, capital, skilled labor, and manufacturing equipment are used together. The acceleration effect describes the reduction of delays in information transmission, production adjustment, innovation, and responses to market demand.
Figure 2 presents these mechanisms as a conceptual classification. It does not provide numerical estimates of their individual effects or establish causal relationships among them. Such conclusions would require operational definitions, measurable indicators, appropriate data, and empirical tests. Nevertheless, the classification provides a structured basis for developing the mathematical extension and interpreting the subsequent statistical analysis.
From the perspective of new economic geography, the spatial agglomeration of manufacturing enterprises is influenced by market size, increasing returns, product differentiation, and transaction or transportation costs. Digital technologies may reduce information-search and communication costs, while big-data-supported logistics may reduce some transportation and coordination expenses. Physical transportation costs, institutional differences, market regulations, and cultural differences nevertheless remain relevant, particularly across geographically distant regions.
To formulate the model, let \(P_m\) denote the price of a differentiated manufactured product, \(w\) the wage rate, \(b_m\) the marginal labor requirement, \(F_m\) the fixed labor requirement, and \(\rho(I)>1\) the elasticity-related parameter associated with the level of information-industry or digital-economy development \(I\). Under monopolistic competition, the representative firm’s markup-pricing rule is expressed as
Eq. (1) indicates that the price is determined by the wage-adjusted marginal labor requirement and the markup associated with the elasticity parameter. As \(\rho(I)\) changes, the implied markup also changes. This expression is theoretical and requires an explicit empirical measure of \(I\) and a justified functional form for \(\rho(I)\) before it can be estimated from observed data.
Under the zero-profit condition, the equilibrium output of an independently operating representative firm is
where \(Y\) denotes the firm’s equilibrium output. Eq. (2) links equilibrium production to the fixed labor requirement, marginal labor requirement, and elasticity-related parameter. The expression assumes identical firms, monopolistic competition, increasing returns arising from fixed production requirements, and free entry sufficient to eliminate long-run economic profit.
For a firm that sells its product in another region, profit is expressed as
where \(\pi_2\) is interregional profit, \(Y_1\) is the quantity sold in the destination region, \(\tau\) is the transaction-related factor used in the model, and \(F_t(I)\) represents the additional information- or trade-related cost associated with interregional sales. This formulation retains the structure of the original model. The economic meaning and sign convention of \(\tau\) must remain consistent throughout the derivation, particularly if it is interpreted as an iceberg trade-cost factor.
Combining the markup-pricing rule in Eq. (1) with the zero-profit condition associated with Eq. (3) gives the interregional equilibrium output
Under the stated assumptions, the corresponding transaction factor is written as
Eqs. (4) and (5) describe the modeled relationship among interregional output, fixed production requirements, trade-related costs, wages, and information-industry development. These expressions are conditional on the assumptions of the model and should not be interpreted as empirically verified relationships without parameter estimation and robustness testing.
Differentiating Eq. (5) with respect to \(I\) gives
The factor outside the brackets in Eq. (6) is positive when \(w>0\), \(F_m>0\), and \(\rho(I)>0\). Consequently, the sign of \(d\tau/dI\) depends on the expression inside the brackets. More specifically, it depends on how digital-economy development affects the trade-related cost function \(F_t(I)\), how it changes the elasticity-related parameter \(\rho(I)\), and the ratio of the existing transaction cost to \(\rho(I)\). A negative derivative is therefore a conditional result rather than an automatic consequence of digitalization.
When interregional transaction costs are relatively small, as may occur within a closely connected urban region, improvements in digital connectivity can reduce information-related costs and facilitate the export of manufactured products to nearby markets. Under these conditions, locally advantaged manufacturing subsectors may become more concentrated. In geographically distant markets, physical transportation costs, institutional differences, regulatory barriers, and cultural differences may remain substantial. Firms may consequently serve those markets by relocating production, establishing branches, or reorganizing their supply chains.
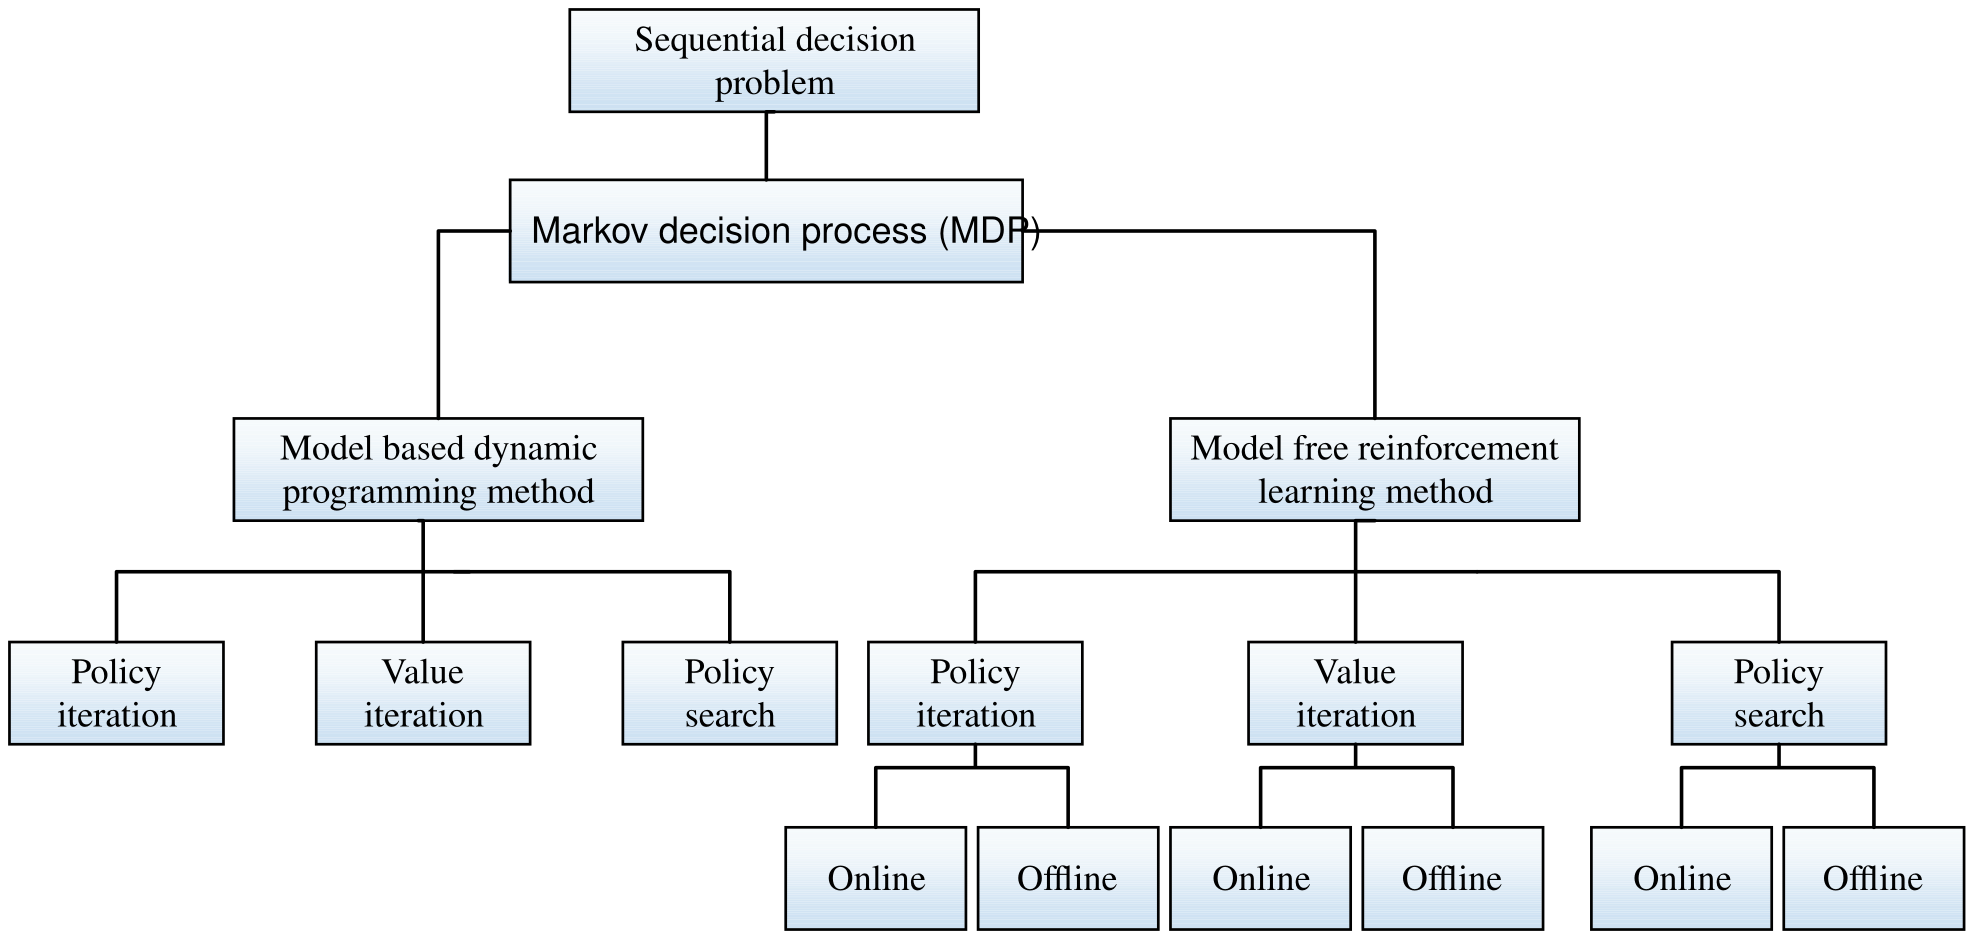
The iterative conceptual process through which digital development may alter transaction costs, firm location, production organization, and industrial agglomeration is shown in Figure 3. The diagram represents the logical structure of the model rather than a computational algorithm validated with independent experimental observations.
The model uses a composite information-goods index and a composite manufactured-goods index, represented by \(I\) and \(M\), respectively. Both indices are assumed to follow a constant-elasticity-of-substitution form. The information-goods composite is expressed as
where \(I(j)\) denotes the quantity of information-product variety \(j\), \(N\) denotes the number or range of information-product varieties, and \(\rho>1\) represents the elasticity of substitution among differentiated varieties.
Similarly, the manufactured-goods composite is written as
where \(m(i)\) denotes the quantity of manufactured-product variety \(i\), and \(r\) represents the number or range of manufactured-product varieties. Eqs. (7) and (8) define composite indices and do not directly represent the distribution of labor between the manufacturing and information industries.
For labor allocation, let \(\beta\) represent the proportion of the total labor force employed in manufacturing and \(1-\beta\) represent the proportion employed in the information industry. The allocation identity is therefore
Eq. (9) provides a simplified representation of labor distribution across the two sectors. The division of labor can be interpreted through the broader biological-systems analogy: specialized components contribute to the performance of a larger system while coordinating their activities. This comparison concerns functional specialization and does not imply that industrial labor allocation follows the mechanics of muscle recruitment or biological force distribution.
For analytical simplicity, the manufacturing and information industries are assumed to use fixed and variable labor inputs in producing their respective products. All workers are allocated between the two industries, and all firms are assumed to possess the same technological level. Each firm produces one differentiated product. Increasing returns to scale arise from the existence of fixed production requirements combined with the expansion of differentiated product varieties.
Under these assumptions, the labor required to produce the final manufactured product is the sum of fixed and variable labor requirements:
where \(L_Y\) denotes total labor required for output \(Y\). Eq. (10) states that labor demand increases linearly with output after accounting for the fixed labor requirement. The equation is an economic production relationship and does not measure physiological energy expenditure.
A biological analogy may nevertheless assist conceptual interpretation. An organism requires a baseline amount of energy to maintain essential functions and additional energy to perform a particular activity. Similarly, the representative firm incurs a fixed requirement before production begins and an additional variable requirement as output expands. This analogy illustrates the distinction between fixed and variable requirements but does not establish mathematical equivalence between labor costs and biological metabolism.
The profit of a representative final-product enterprise is defined as the difference between sales revenue and labor-related production costs:
Eq. (11) combines the product price, output, wage rate, fixed labor requirement, and marginal labor requirement. Together, Eqs. (1), (2), (10), and (11) describe the pricing, output, labor, and profit conditions of the representative manufacturing firm under the assumptions of monopolistic competition and free entry.
The model suggests that timely and accurate information transmission may assist manufacturing firms in identifying market demand and adjusting production. Manufacturing enterprises may also need to strengthen their innovation capabilities to provide differentiated, higher-quality products. Conversely, improvements in manufacturing innovation may increase demand for advanced information products that support data collection, modular production, interfirm coordination, logistics, and market analysis [19]. The resulting relationship is potentially reciprocal: digital development can facilitate manufacturing upgrading, while the transformation of manufacturing can generate additional demand for digital technologies and information services.
The model derivation therefore provides a theoretical explanation of how digital-economy development may influence transaction costs, product differentiation, labor allocation, firm organization, and geographical agglomeration. The biological-system comparisons clarify selected ideas concerning adaptation, specialization, and resource coordination, but the conclusions of the model depend on its economic assumptions. Empirical validation requires transparent definitions of all variables, reliable regional and temporal data, parameter estimation, specification testing, and robustness analysis.
This section presents a proposed analytical framework for integrating biomechanical measurements with dynamic time-series analysis to investigate relationships among workers’ movement patterns, production conditions, technological change, and manufacturing productivity. The framework combines kinematic and kinetic principles with a vector autoregressive model containing exogenous variables (VARX). Its purpose is to specify how future empirical research could quantify worker movement patterns and evaluate their temporal associations with productivity, labor input, automation, and technology-related indicators.
The proposed framework should not be interpreted as evidence that participant-based biomechanical measurements were collected in the present economic study. No worker sample, motion-capture experiment, force measurement, electromyographic recording, or validated fatigue assessment was reported. Accordingly, the biomechanical variables and diagrams presented in this section are theoretical and illustrative. They define a possible extension of the economic analysis rather than report experimentally observed worker behavior, joint loading, muscle fatigue, energy expenditure, or ergonomic improvement.
Biomechanical modeling commonly includes kinematic and kinetic analyses. Kinematics describes motion without directly considering the forces that produce it and may include position, displacement, velocity, acceleration, joint angles, and movement trajectories. Kinetics examines the forces and moments associated with motion, including external forces, joint moments, contact forces, and mechanical work. When appropriate instruments and experimental procedures are used, these two forms of analysis can provide complementary information regarding how workers perform production tasks.
In a manufacturing environment, potentially relevant movement characteristics include trunk posture, upper-limb trajectory, hand manipulation, joint angles, reaching distance, gait, repetition rate, task duration, and movement variability. Potentially relevant kinetic characteristics include applied force, joint moment, contact force, mechanical power, and cumulative mechanical exposure. These variables can be examined together with production outcomes such as cycle time, units produced, error frequency, interruption time, and task-completion efficiency.
Repetitive movements, forceful exertions, constrained postures, and insufficient recovery may contribute to worker discomfort, fatigue, or musculoskeletal risk. However, these outcomes cannot be inferred solely from a schematic model. Their evaluation requires direct measurements obtained from a clearly defined worker sample under standardized task conditions. Depending on the research question, an empirical investigation may require optical or inertial motion-capture systems, force plates, instrumented tools, electromyography, pressure sensors, wearable devices, and validated self-report instruments.
A rigorous application of the proposed framework would document participant characteristics, task definitions, equipment models, sensor placement, calibration procedures, sampling frequencies, filtering methods, trial duration, repetition counts, and outcome definitions. It would also require an appropriate ethics-review determination and informed consent when identifiable human participants are involved. Because these elements were not included in the available study, the present section remains a methodological proposal.
A vector autoregressive model can be used to investigate dynamic relationships among several endogenous time-series variables. In a conventional VAR model, each endogenous variable is modeled as a function of its own lagged values and the lagged values of the other endogenous variables. A general VAR model of order \(p\) is expressed as
where \(\mathbf{Y}_t\) is a vector of endogenous variables observed at time \(t\), \(\mathbf{c}\) is a vector of intercepts, \(\mathbf{A}_1,\mathbf{A}_2,\ldots,\mathbf{A}_p\) are coefficient matrices associated with lags \(1,2,\ldots,p\), and \(\boldsymbol{\varepsilon}_t\) is a vector of innovations or error terms.
Depending on the empirical design, \(\mathbf{Y}_t\) could contain production efficiency, labor input, technological level, automation intensity, or other repeatedly measured production indicators. All included variables would require explicit operational definitions, consistent units, compatible observation frequencies, and a sufficiently long time series. The stationarity properties of the variables would also need to be evaluated before model estimation.
If biomechanical measurements are introduced as external predictors rather than jointly endogenous outcomes, the appropriate formulation is a VARX model:
where \(\mathbf{X}_t\) represents a vector of exogenous or predetermined biomechanical variables, \(\mathbf{B}_j\) contains the corresponding coefficients, and \(q\) is the maximum lag assigned to those predictors. Possible elements of \(\mathbf{X}_t\) include movement duration, path length, joint-angle variability, repetition rate, measured external force, or another biomechanical indicator obtained through a validated procedure.
If worker-movement variables are expected to respond dynamically to changes in automation or productivity, they should not automatically be treated as exogenous. Instead, they may need to be incorporated into the endogenous vector \(\mathbf{Y}_t\), or the analysis may require a structural VAR, panel VAR, vector error-correction model, or another design capable of representing the hypothesized relationships. This decision must be based on the study design and theoretical assumptions rather than on convenience.
The lag orders \(p\) and \(q\) should be selected using justified information criteria and diagnostic testing. Model evaluation should include stationarity testing, residual autocorrelation analysis, stability assessment, and examination of heteroskedasticity where appropriate. If the variables are nonstationary but cointegrated, a vector error-correction framework may be more suitable than an unrestricted VAR model.
Estimated VAR or VARX relationships should not automatically be interpreted as causal. Lagged association, Granger-predictive content, impulse-response behavior, and forecast-error variance decomposition can describe temporal dependence within an estimated system, but they do not independently eliminate confounding, measurement error, reverse causality, or contemporaneous interaction. Strong causal conclusions would require additional identifying assumptions, appropriate experimental or quasi-experimental variation, and robustness analysis.
Kinematic analysis characterizes the spatial and temporal properties of worker movement. In manual production or assembly tasks, potentially relevant characteristics include the trajectories of the hands and arms, reaching distances, movement velocities, accelerations, joint-angle ranges, cycle duration, and the number of unnecessary or repeated movements. These measurements may help identify inefficient movement patterns, but their relationship with productivity must be evaluated empirically.
For motion under the restrictive assumption of constant acceleration, the position vector can be represented as
where \(\mathbf{r}(t)\) is the position vector at time \(t\), \(\mathbf{r}_0\) is the initial position vector, \(\mathbf{v}_0\) is the initial velocity vector, and \(\mathbf{a}\) is the constant acceleration vector. Eq. (14) is appropriate only when acceleration can reasonably be treated as constant over the analyzed interval. Human movement normally involves time-varying acceleration; therefore, direct motion data would generally be analyzed using numerical differentiation, filtering, and segment-specific models.
Under the same constant-acceleration assumption, velocity is expressed as
where \(\mathbf{v}(t)\) is the velocity vector at time \(t\). For experimentally recorded movement, velocity and acceleration would normally be estimated from a sequence of time-stamped position measurements. The resulting estimates would depend on the sensor sampling frequency, coordinate system, calibration accuracy, differentiation method, and filtering procedure.
A complete movement analysis would first define the task and the anatomical landmarks or body segments being tracked. The corresponding coordinate system would then be established, and each sensor or camera would be calibrated. Multiple task repetitions would be recorded to characterize both average performance and within-worker variability. Where more than one worker is included, the analysis should distinguish within-worker changes from between-worker differences.
The conceptual movement route illustrated in Figure 4 shows how joint positions, angular changes, and upper-limb trajectories could be represented during a production task. The figure is a schematic illustration and does not show measurements obtained from an identified participant, production facility, or experimental trial.
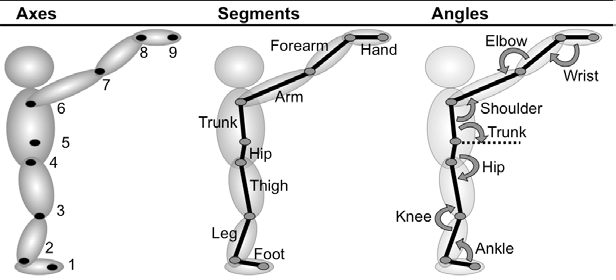
As illustrated conceptually in Figure 4, movement efficiency could be evaluated using measures such as hand-path length, movement duration, peak velocity, acceleration variability, joint-angle range, and the number of direction changes. A shorter movement path cannot automatically be considered safer or more productive because task accuracy, required force, posture, equipment arrangement, and production quality must also be considered.
Similarly, long-term repetition cannot be assumed to cause fatigue solely on the basis of trajectory data. Fatigue assessment would require repeated observations over time and suitable physiological, mechanical, performance-based, or self-reported indicators. Any conclusion that an optimized trajectory reduces fatigue or improves productivity would need to be supported by comparisons under controlled and reproducible conditions.
Kinetic analysis examines the forces and moments associated with movement. In manufacturing research, it may be used to investigate forces applied to tools, loads acting on the upper or lower limbs, contact forces, joint moments, mechanical work, and power. These quantities require measurements or model-based estimates derived from known body-segment characteristics, external forces, and kinematic data.
Newton’s second law can be expressed in vector form as
where \(\sum\mathbf{F}\) is the resultant external force acting on the modeled body or segment, \(m\) is its mass, and \(\mathbf{a}\) is the acceleration of its center of mass. In a worker biomechanical model, \(m\) should not automatically represent the worker’s total body mass. The appropriate mass depends on whether the analysis concerns the whole body, an individual limb, or another defined body segment.
The moment of a force about a joint or reference point is more accurately represented as
where \(\boldsymbol{\tau}\) is the moment vector, \(\mathbf{r}\) is the position vector from the joint center or reference point to the point of force application, and \(\mathbf{F}\) is the applied force vector. Its magnitude is
where \(\theta\) is the angle between \(\mathbf{r}\) and \(\mathbf{F}\). The simplified expression \(\tau=Fr\) is valid only when the force acts perpendicular to the moment arm.
Estimating internal joint loading normally requires inverse-dynamics analysis rather than multiplication of an external force by an unspecified distance. Such an analysis may incorporate segment masses, segment centers of mass, moments of inertia, joint-center locations, external forces, and measured kinematics. Muscle forces cannot generally be determined uniquely from joint moments because several muscles may contribute simultaneously to the same movement.
Figure 5 illustrates the types of information that could be considered in a joint-load analysis. It is presented as a schematic diagram rather than as a graph of measured elbow, shoulder, knee, or muscle loading.
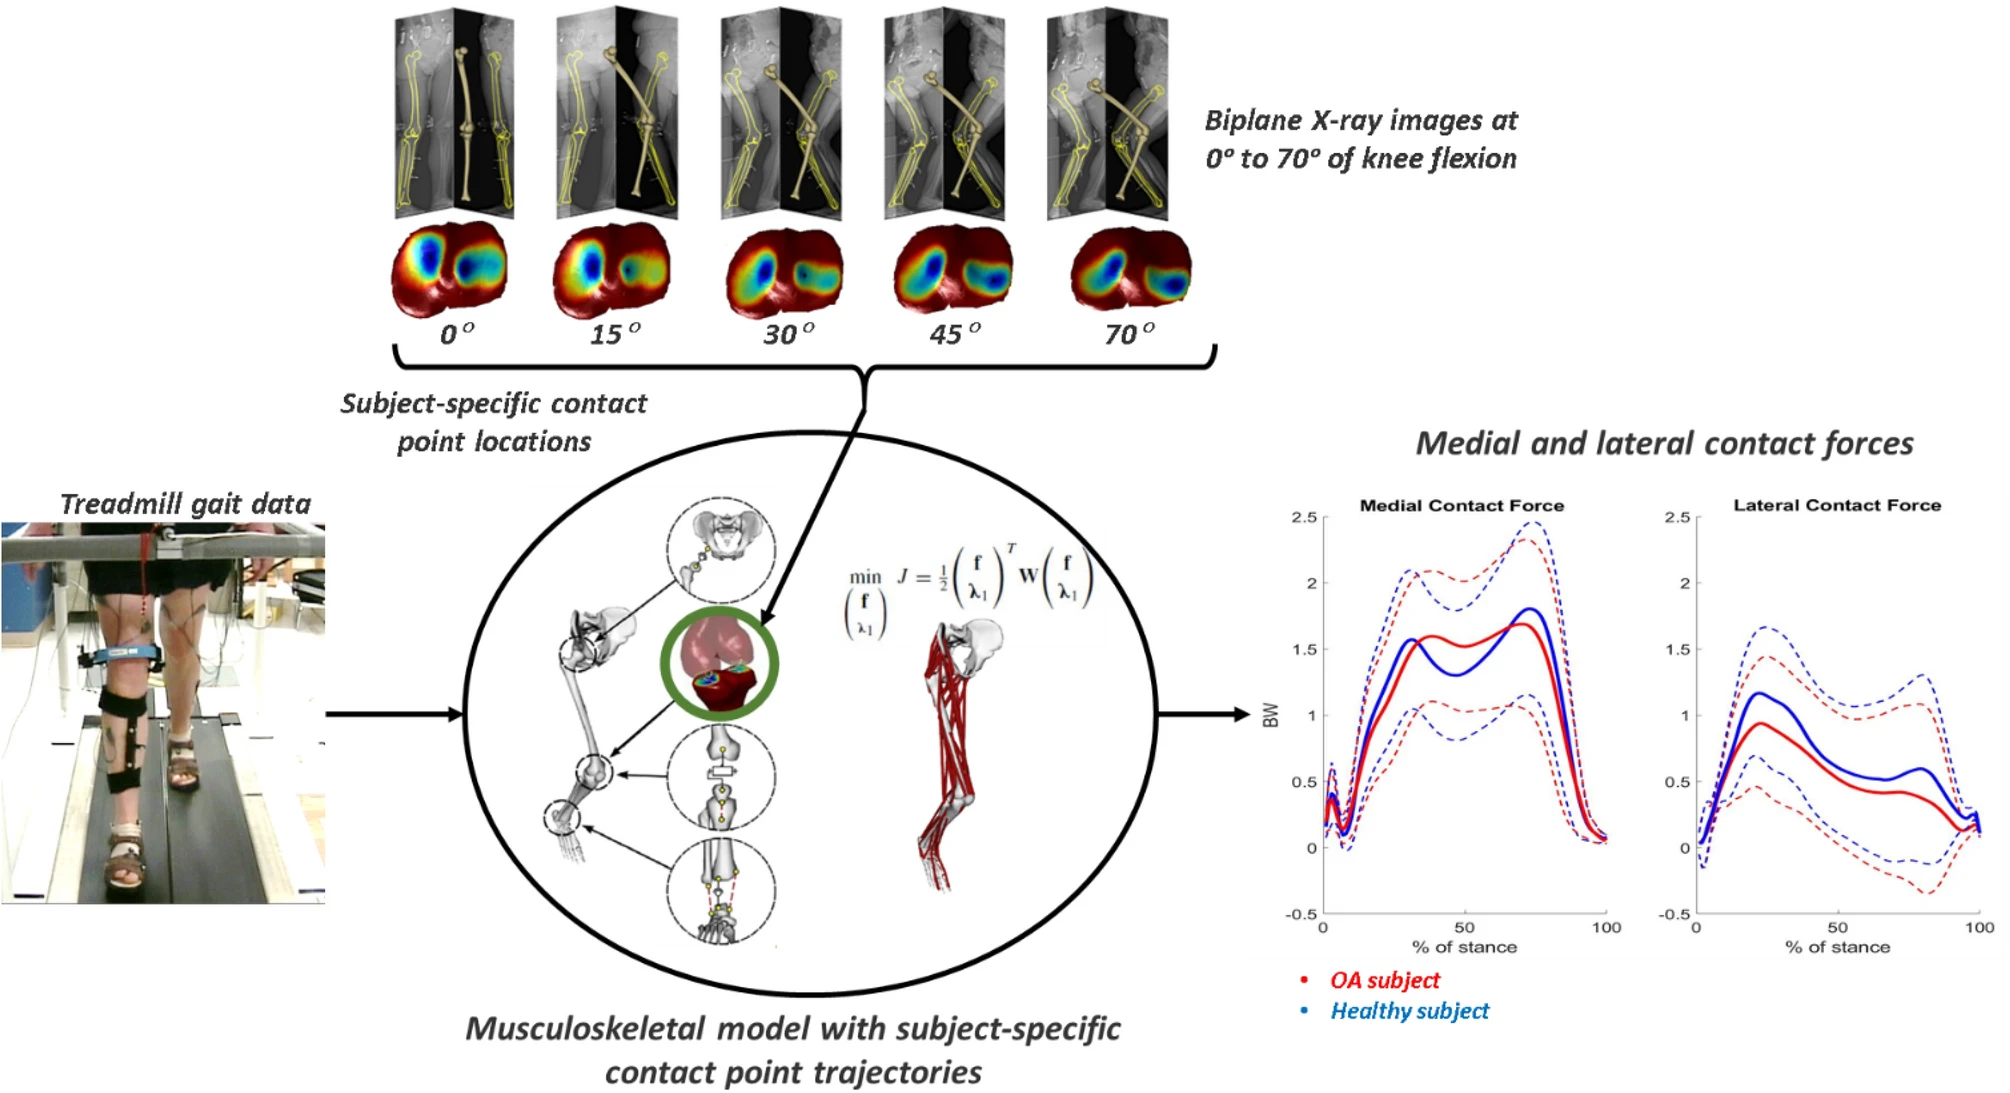
As indicated conceptually in Figure 5, repeated measurements could be used to examine whether joint moments or external forces change during a specified task. However, changes over time cannot be interpreted as fatigue unless fatigue is independently operationalized and measured. Likewise, the presence of a particular joint moment does not by itself establish tissue damage or injury risk.
A future ergonomic optimization study could compare workstation configurations, tool designs, task sequences, or levels of digital assistance. Suitable outcomes might include task-completion time, production errors, external force, joint-angle range, joint moment, repetition rate, physiological effort, and reported discomfort. The study would require baseline and comparison conditions, adequate replication, participant-level analysis, and uncertainty estimates.
Digitalization and automation can alter the physical and organizational conditions under which manufacturing tasks are performed. Automated equipment may remove certain force-intensive activities while introducing monitoring, loading, maintenance, interface-control, or human-robot collaboration tasks. Consequently, technological advancement does not necessarily reduce every form of physical exposure; it may redistribute exposure across body regions, task types, or stages of production.
A fully implemented biomechanical framework could quantify how movement patterns and external forces change when workers interact with automated systems. For example, measurements could be collected before and after the introduction of a digitally assisted workstation. These data could then be analyzed together with production indicators to determine whether changes in technology are temporally associated with changes in worker movement, physical workload, and productivity.
Real-time sensing and data availability may also support feedback-based ergonomic management. Wearable sensors, motion-capture devices, instrumented tools, and production-monitoring platforms could provide synchronized information about worker movement and task performance. Such information might assist in identifying inefficient movements or demanding task periods. However, sensor data must be validated, securely managed, and interpreted in relation to individual differences and task requirements.
Within a dynamic-system model, digitalization may affect worker movement by changing task allocation, equipment configuration, production speed, or the level of human-machine interaction. Worker performance may, in turn, affect productivity, error rates, equipment utilization, and the demand for additional automation. These reciprocal relationships justify a multivariate dynamic framework, but they also complicate causal interpretation.
The proposed VARX framework provides one possible method for representing these temporal relationships. Biomechanical variables could be entered as predictors when their exogeneity is defensible, or they could be modeled jointly with productivity and technological variables when mutual feedback is expected. The suitability of either approach would depend on the observation frequency, number of time points, measurement reliability, and theoretical structure of the empirical study.
Accordingly, the framework developed in this section establishes a methodological pathway for future integration of digital-economy indicators, manufacturing outcomes, and directly measured worker biomechanics. It does not demonstrate that digital technologies have already reduced joint loading, fatigue, energy expenditure, or injury risk in the examined manufacturing context. Those conclusions require participant-based empirical evidence. The present contribution is therefore limited to specifying relevant variables, correcting the mathematical representation of motion and joint moments, and identifying the conditions under which biomechanical data could be incorporated into a dynamic economic analysis.
This section presents the reported results of the sampling-adequacy assessment, principal component analysis (PCA), vector autoregressive (VAR) model evaluation, and the conceptual extension concerning worker biomechanics. The economic results are distinguished from the illustrative biomechanical scenarios because the available study materials do not document a participant-based biomechanical experiment, measurement protocol, or worker-level dataset.
Before performing PCA, the Kaiser–Meyer–Olkin (KMO) measure and Bartlett’s test of sphericity were used to evaluate whether the reported correlation structure was suitable for component extraction. The corresponding results are presented in Table 1.
| Test | Statistic | Reported value |
|---|---|---|
| Kaiser–Meyer–Olkin measure of sampling adequacy | KMO | 0.82 |
| Bartlett’s test of sphericity | Approximate chi-square | 738.42 |
| Degrees of freedom | 65 | |
| Significance | \(p<0.001\) |
As shown in Table 1, the reported KMO value was 0.82, exceeding the commonly applied minimum criterion of 0.50. Bartlett’s test was also reported as statistically significant, with an approximate chi-square value of 738.42 and \(p<0.001\). Taken at face value, these results indicate that the variables shared sufficient correlation for PCA.
Nevertheless, the reported degrees of freedom require verification. For a Bartlett test based on \(k\) variables, the degrees of freedom are ordinarily calculated as \(k(k-1)/2\). The reported value of 65 does not correspond to an integer number of variables under this expression. It is also inconsistent with both the 12 variables mentioned in the PCA narrative and the seven variables displayed in Tables 3 and 4. Therefore, although the KMO and significance values support the stated suitability of the correlation matrix, the Bartlett-test degrees of freedom and the number of analyzed variables must be reconciled with the original statistical output before the analysis can be considered fully reproducible.
PCA was conducted using SPSS to reduce the dimensionality of the digital-economy indicator set and construct composite measures for regional comparison. The reported eigenvalues and explained-variance percentages for the first three components are provided in Table 2.
| Component | Initial eigenvalues | Extraction sums of squared loadings | ||||
|---|---|---|---|---|---|---|
| Total | Variance (%) | Cumulative (%) | Total | Variance (%) | Cumulative (%) | |
| 1 | 8.51 | 70.86 | 70.86 | 8.51 | 70.86 | 70.86 |
| 2 | 1.41 | 11.72 | 82.59 | 1.41 | 11.72 | 82.59 |
| 3 | 0.97 | 8.08 | 90.67 | — | — | — |
Table 2 shows that the first component had a reported eigenvalue of 8.51 and explained 70.86% of the total variance. The second component had an eigenvalue of 1.41 and explained an additional 11.72%. The reported cumulative contribution of the first two components was 82.59%, indicating that these components retained a substantial proportion of the variance represented by the original indicator set. The third component had an eigenvalue of 0.97 and was not retained under the conventional criterion requiring an eigenvalue greater than 1.
The displayed percentages should be checked against the unrounded SPSS output because 70.86% and 11.72% sum to 82.58%, whereas Table 2 reports 82.59%. This small difference may result from rounding and does not materially change the component-retention decision. However, the table presents only the first three components. If 12 standardized variables were analyzed, the complete initial-eigenvalue output should contain 12 components whose eigenvalues sum to 12.
The original analysis states that the first two components were used to assess digital-economy development across Chinese provinces in 2018. However, the provincial scores and complete ranking were not included in the supplied results. Consequently, the specific provincial ordering cannot be independently reconstructed from Table 2 alone.
The reported component matrix is presented in Table 3. The first component had positive loadings across all seven displayed variables, with particularly large loadings for \(x_6\), \(x_7\), and \(x_3\). The second component was more strongly associated with \(x_1\) and \(x_2\), while its loadings for \(x_4\), \(x_5\), \(x_6\), and \(x_7\) were comparatively small or negative.
| Variable | Component loading | |
|---|---|---|
| \(a_1\) | \(a_2\) | |
| \(x_1\) | 0.35 | 0.81 |
| \(x_2\) | 0.52 | 0.63 |
| \(x_3\) | 0.83 | 0.37 |
| \(x_4\) | 0.59 | 0.02 |
| \(x_5\) | 0.73 | -0.21 |
| \(x_6\) | 0.96 | -0.19 |
| \(x_7\) | 0.94 | -0.17 |
The substantive interpretation of Table 3 depends on the definitions, units, and sources of \(x_1\)–\(x_7\). These definitions were not included in the supplied results and must be provided in the methodology. Without them, it is not possible to determine which dimensions of information infrastructure, digital activity, industrial development, or innovation capacity are represented by the two components.
The reported eigenvector matrix derived from the component results is shown in Table 4. The value reported as “033” for \(x_6\) under \(z_1\) has been corrected typographically to 0.33, which is consistent with the numerical format used for the remaining entries.
| Variable | Eigenvector coefficient | |
|---|---|---|
| \(z_1\) | \(z_2\) | |
| \(x_1\) | 0.13 | 0.68 |
| \(x_2\) | 0.19 | 0.53 |
| \(x_3\) | 0.17 | 0.21 |
| \(x_4\) | 0.26 | 0.02 |
| \(x_5\) | 0.31 | -0.16 |
| \(x_6\) | 0.33 | -0.15 |
| \(x_7\) | 0.32 | -0.14 |
As shown in Table 4, \(x_6\), \(x_7\), and \(x_5\) received the largest positive coefficients in the first principal-component expression, whereas \(x_1\) and \(x_2\) received the largest coefficients in the second. These coefficients could be used to calculate component scores after standardization of the corresponding variables. A composite regional score would additionally require an explicitly stated weighting formula based on the variance contributions of the retained components.
An important internal inconsistency remains: the narrative and Table 2 refer to 12 original variables, while Tables 3 and 4 report only seven. Before publication, the manuscript must clarify whether the PCA included seven or twelve variables and present a complete, internally consistent component matrix.
The reported interpretation suggests that provinces with comparatively high digital-economy scores were generally characterized by advanced economic development, a larger information and communication technology sector, stronger information infrastructure, and greater research and development capacity. Beijing, Shanghai, and Guangdong were described as prominent examples. These interpretations are plausible within the proposed framework, but the complete provincial score table, indicator definitions, data sources, standardization procedure, and ranking formula are necessary to verify the conclusion.
The reported VAR lag-selection statistics are presented in Table 5. The table includes the log-likelihood value, sequential likelihood-ratio statistic, final prediction error, Akaike information criterion, Schwarz criterion, and Hannan–Quinn criterion for lag orders zero through three.
| Lag | LogL | LR | FPE | AIC | SC | HQ |
|---|---|---|---|---|---|---|
| 0 | 13.21 | — | 0 | -0.91 | -0.72 | -0.88 |
| 1 | 86.05 | 109.27 | 0 | -6.60 | -5.61 | -6.41 |
| 2 | 107.31 | 23.39 | 0 | -7.13 | -5.34 | -6.78 |
| 3 | 136.30 | 20.29 | 0 | -8.43 | -5.84 | -7.92 |
The lag-zero HQ value originally reported as \(-88\) has been treated as a likely typographical omission and presented as \(-0.88\), consistent with the scale of the other information criteria. This value should nevertheless be checked against the original software output. Likewise, the FPE values are displayed as zero at every lag, indicating that insufficient decimal precision was retained. The complete nonzero scientific-notation values should be reported because rounded zeros cannot be compared for lag selection.
Based solely on the displayed values in Table 5, lag 3 minimizes the AIC, SC, and HQ criteria. Therefore, the table does not support the original statement that lag 2 was selected. If lag 2 was chosen using another criterion, a restricted sample, parameter-parsimony considerations, or an omitted selection marker from the software output, that justification must be stated. Otherwise, the model should be described as a VAR(3) according to the reported information criteria.
The stability of the estimated VAR system was evaluated using the inverse roots of the autoregressive characteristic polynomial. Figure 6 presents the reported inverse-root plot.
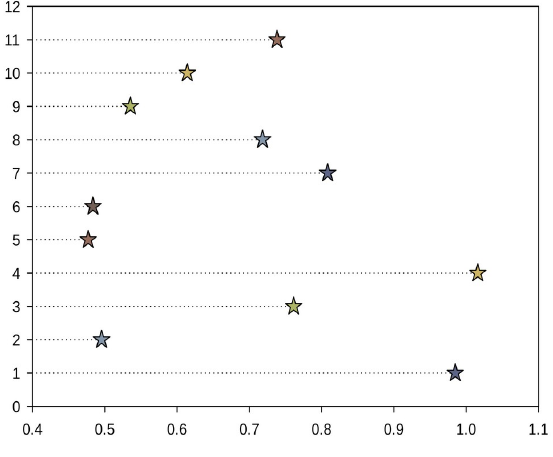
As illustrated in Figure 6, the reported inverse roots appear to lie within the unit circle. Under the conventional stability criterion, a VAR system is dynamically stable when all inverse roots have moduli strictly below one. The figure therefore visually supports the stability of the fitted system.
However, the text reports eight characteristic roots, while the dimensions of the endogenous-variable vector and the adopted lag order are not stated consistently. The expected number of companion-matrix roots depends on both the number of endogenous variables and the lag order. The number of roots shown in Figure 6 should consequently be reconciled with the final VAR specification.
Following the stability assessment, an impulse-response analysis was conducted. The reported output is shown in Figure 7.
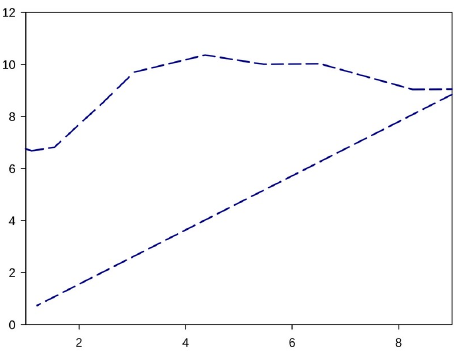
Figure 7 displays the temporal response patterns generated by the model. Nevertheless, the supplied figure does not clearly identify the impulse variable, response variable, shock normalization, ordering assumption, time-horizon unit, or confidence intervals. Without this information, the direction, magnitude, persistence, and statistical uncertainty of the responses cannot be interpreted reliably. The figure should therefore be treated as evidence that an impulse-response procedure was performed, rather than as sufficient evidence for a specific substantive conclusion.
The reported regional interpretation indicates that Beijing, Shanghai, Guangdong, and other economically advanced areas possess comparatively strong research and development capacities, developed information and software industries, substantial scientific and educational resources, and active digital consumption. In comparison, regions such as Inner Mongolia were described as having a stronger dependence on traditional industries, fewer high-technology sectors, and more limited research investment. These observations should be supported directly by the provincial scores and source indicators rather than inferred only from general regional characteristics.
The numerical examples in Tables 6–8 illustrate how future worker-level biomechanical and productivity data might be reported. The available manuscript does not provide a worker sample, experimental design, instrument specifications, data-acquisition procedure, measurement uncertainty, or statistical analysis supporting these values. Accordingly, the tables are presented as hypothetical modeling scenarios and not as empirical results from human participants.
Table 6 illustrates a possible comparison of displacement and joint-angle observations before and after a digitally supported manufacturing transformation.
| Production stage | Pre-transformation condition (displacement/joint angle) |
Post-transformation condition (displacement/joint angle) |
Reported displacement change (%) |
|---|---|---|---|
| Start of production | 0.15 m (shoulder angle: \(45^\circ\)) | 0.12 m (shoulder angle: \(40^\circ\)) | -20% |
| Middle of production | 0.25 m (knee angle: \(90^\circ\)) | 0.20 m (knee angle: \(85^\circ\)) | -20% |
| End of production | 0.10 m (trunk angle: \(30^\circ\)) | 0.08 m (trunk angle: \(28^\circ\)) | -15% |
The illustrative values in Table 6 show reductions in the reported displacement measures of 20%, 20%, and 15% across the three production stages. The accompanying joint angles also differ between the two hypothetical conditions. However, reduced displacement does not necessarily represent improved posture, reduced biomechanical loading, or increased productivity. These interpretations would require task-specific ergonomic criteria, repeated measurements, participant-level observations, and statistical uncertainty estimates. The table therefore demonstrates a possible reporting structure rather than evidence that digital technologies optimized workers’ physical condition.
Table 7 provides a second illustrative comparison involving joint loading, posture, fatigue, and productivity under conventional and optimized production conditions.
| Production environment | Illustrative joint loading | Postural assessment | Fatigue score (0–10) | Productivity (units/hour) |
|---|---|---|---|---|
| Conventional production | 50 N (knee), 40 N (shoulder) | Poor | 7 | 30 |
| Optimized production | 30 N (knee), 25 N (shoulder) | Improved | 4 | 40 |
As shown in Table 7, the illustrative optimized condition contains lower numerical loads, a lower fatigue score, and higher productivity than the conventional condition. These values demonstrate the hypothesized direction of an ergonomic intervention. They do not establish that the intervention produced these effects because no measurement protocol, participant sample, baseline comparability, variance estimate, or statistical test was supplied.
The term “joint loading” also requires technical clarification. Loads expressed in newtons ordinarily represent forces, whereas joint moments are normally expressed in newton-metres. Separate knee and shoulder values cannot be interpreted without specifying the direction of the force, anatomical reference point, task phase, measurement instrument, and calculation procedure. Similarly, the labels “poor” and “improved” require a validated postural-assessment method, while the fatigue score requires a defined and validated scale.
Table 8 illustrates how spatiotemporal gait variables and energy consumption might be compared between conventional and digitally assisted production conditions.
| Production environment | Step width and frequency | Gait speed | Energy consumption |
|---|---|---|---|
| Conventional production | Step width: 0.7 m; frequency: 1.2 Hz | 1.4 m/s | 180 J |
| Digitally assisted production | Step width: 0.8 m; frequency: 1.5 Hz | 1.7 m/s | 150 J |
The illustrative comparison in Table 8 shows higher step frequency and gait speed together with lower stated energy consumption in the digitally assisted condition. These values do not, however, demonstrate improved gait efficiency. Step width is not equivalent to stride length, and an increase in step width cannot automatically be interpreted as biomechanical optimization. Moreover, energy expressed as a single value in joules cannot be compared meaningfully without specifying body mass, distance, task duration, measurement method, and whether the value represents total mechanical work, metabolic energy expenditure, or another quantity.
Accordingly, Tables 6, 7, and 8 should be interpreted exclusively as demonstrations of variables that could be incorporated into a future biomechanical study. Empirical conclusions concerning reduced joint loading, improved posture, lower fatigue, greater gait efficiency, or increased productivity require direct participant-based measurements and a reproducible analytical protocol.
The reported KMO value and Bartlett-test significance suggest that the dataset may be suitable for PCA, although the degrees of freedom and number of analyzed variables remain internally inconsistent. The first two principal components reportedly explain approximately 82.59% of total variance, but the variable definitions, complete component output, regional scores, and ranking table are required for substantive interpretation.
The displayed VAR information criteria favor a lag order of three, whereas the original narrative selected lag two. The inverse-root plot in Figure 6 appears consistent with a stable system, but the number of variables and roots must be reconciled with the final lag specification. The impulse-response output in Figure 7 cannot support a detailed substantive conclusion until its variables, axes, ordering, horizon, and confidence intervals are identified.
Finally, the worker-movement, production-environment, and gait values in Tables 6–8 are not supported by a documented biomechanical experiment. They have therefore been retained as illustrative scenarios rather than reported as observed findings. This distinction prevents the economic analysis from being interpreted as direct evidence of worker-level biomechanical or productivity effects.
This study examined the relationship between digital-economy development and manufacturing transformation through an extended D–S framework, principal component analysis, vector autoregressive modeling, and a carefully bounded biological-systems analogy. The interaction between the digital economy and manufacturing may be understood conceptually as a complex adaptive system characterized by information exchange, resource coordination, functional specialization, feedback, and adjustment to changing external conditions. This analogy offers an interpretive framework for explaining industrial relationships but should not be regarded as evidence that manufacturing systems follow biological or biomechanical laws.
The extended D–S framework indicates that digitalization may influence manufacturing transformation by reducing information-related transaction costs, strengthening interregional coordination, facilitating product differentiation, and affecting the geographical organization of production. Four conceptual mechanisms were identified: the integration effect, modularization effect, complementarity effect, and acceleration effect. The integration effect connects previously separated production activities; the modularization effect supports specialization among interoperable production units; the complementarity effect reflects the combined value of digital technology, manufacturing equipment, capital, and skilled labor; and the acceleration effect reduces delays in information exchange, operational adjustment, and responses to market demand.
Within the biological-systems analogy, digital infrastructure resembles an information network that supports communication and resource coordination across the manufacturing system. Manufacturing enterprises use this information to adjust production, organize supply chains, coordinate specialized activities, and respond to changing market conditions. However, this comparison remains conceptual. Information transmitted through a digital industrial network is not equivalent to neural signaling, and the allocation of economic resources is not mechanically equivalent to the distribution of energy or force within an organism.
The PCA results suggest that the first two retained components captured a substantial proportion of the reported variation among the digital-economy indicators. The regional interpretation indicates that areas with comparatively developed information infrastructure, stronger research and innovation capacity, larger information-technology industries, and more advanced economic foundations generally exhibited higher levels of digital-economy development. This pattern supports the argument that digital transformation depends on an interconnected combination of technological, institutional, infrastructural, and economic conditions rather than on the presence of a single digital indicator.
The regional concentration of digital-economic activity may be compared conceptually with the heterogeneous distribution of biological populations across environments with unequal resources. Digital industries and advanced manufacturing activities are more likely to develop in regions possessing strong infrastructure, skilled workers, research institutions, investment resources, and efficient information flows. This geographical concentration may generate significant differences in manufacturing transformation across regions. Digital technologies may reduce some barriers associated with distance and market segmentation while simultaneously reinforcing the advantages of established industrial and technological centers.
The VAR framework provides a means of examining temporal relationships among indicators of digital-economy development and manufacturing transformation. Nevertheless, the results should be interpreted as model-based dynamic associations rather than definitive causal effects. The displayed lag-selection criteria, model specification, characteristic-root analysis, and impulse-response output require further clarification before strong statistical conclusions can be drawn. In particular, the selected lag order must be reconciled with the reported information criteria, and the impulse-response analysis should identify the impulse and response variables, ordering assumptions, time horizon, shock definition, and uncertainty intervals.
Several limitations should be acknowledged. The reported number of PCA variables is inconsistent across the narrative and statistical tables, while the degrees of freedom reported for Bartlett’s test require verification. The definitions and data sources for the indicator variables, the complete provincial scores, and the regional ranking procedure must also be reported to ensure reproducibility. These limitations do not eliminate the conceptual contribution of the framework, but they restrict the strength and generalizability of the empirical conclusions.
The biomechanical component of the study should also be interpreted carefully. The available analysis did not include a documented participant sample, motion-capture procedure, force measurement, electromyographic assessment, validated fatigue scale, or controlled ergonomic intervention. Therefore, the reported worker-movement, joint-loading, posture, fatigue, gait, energy-consumption, and productivity values represent illustrative scenarios rather than observed experimental findings. They demonstrate how worker-level variables might be incorporated into future dynamic-system research but do not establish that digital transformation improved worker biomechanics or occupational health.
Future research should combine transparent regional economic datasets with clearly documented statistical procedures and directly collected worker-level measurements. A comprehensive empirical design could investigate how automation, digitally assisted workstations, intelligent production systems, and human-machine collaboration affect movement patterns, mechanical workload, fatigue, task accuracy, and production efficiency. Such research would require ethical approval where applicable, calibrated biomechanical instruments, appropriate comparison conditions, repeated observations, uncertainty estimates, and statistical methods capable of distinguishing association from causation.
Overall, the study provides an interdisciplinary framework for interpreting manufacturing transformation as a process involving information transmission, resource allocation, specialization, regional concentration, and dynamic adaptation. Its principal contribution lies in connecting the extended D–S model, multivariate regional assessment, dynamic time-series analysis, and a limited biological-systems analogy. Subject to the stated methodological limitations, the framework offers a foundation for future research on digitalization, manufacturing upgrading, regional development, worker performance, and sustainable industrial transformation.
The economic indicators, statistical outputs, model-related data, and supplementary materials used to support the findings of this study are available from the corresponding author upon reasonable request. The biomechanical values presented as illustrative scenarios were not obtained from a participant-based experiment and should not be interpreted as experimental worker data.
Not applicable. The reported economic analysis did not involve human participants, identifiable personal information, human biological materials, or live animals. The biomechanical component was conceptual and did not involve participant-based data collection.
The authors declare that they have no conflicts of interest concerning this work.
This research was supported by the 2024 Research and Practice Project on Higher Education Teaching Reform in Henan Province, entitled “A Study on the High-Quality Development Path of Open Education under the Background of the Collaborative Innovation of ‘Three Teachings’,” Project No. 630.
During the revision of this manuscript, the authors used a generative artificial intelligence tool to assist with language editing, grammatical correction, academic phrasing, and improvements to the clarity and organization of the text. The tool was not used to generate, collect, manipulate, or analyze the research data or to make final scientific conclusions. The authors critically reviewed and revised all AI-assisted content, verified its accuracy and relevance, and accept full responsibility for the integrity and final content of the manuscript.