
I. Introduction
In the process of countries around the world seeking economic growth, the rapid development of industry is accompanied by the emergence of phenomena such as ecosystem degradation and tightening resource constraints. In 1972, the Club of Rome released a related report, simulating the dynamic evolution of the global economic system in the “finite world” [1]. Due to the early start of industrialization in developed countries, their development process reached the in-flection point of the environmental Kuznets curve earlier. In order to deal with the increasingly severe environmental threats, some countries, as the pioneers of green development, took the lead in combining environmental benefits with economic benefits, and in stable development on the premise of trying to achieve a virtuous circle of the ecosystem [2]. Since the 21st century, different countries have made efforts to varying degrees, but the Bank for International Settlements in 2020 indicated that climate change may lead to a systemic financial crisis and send a strong early warning signal of environmental risks. Today, the world has built a green and recyclable development model. become the general trend [3].
To strengthen the development of green industries, countries have made the following efforts. In Asia, Japan, as the first country to try green industry, mainly creates market demand for green products through green procurement, which is of great benefit to cultivating the public’s green consumption habits [4]. In the EU, Denmark, as a country with the lowest energy consumption per unit of economic growth, has not only stipulated strict emission standards for hazardous wastes such as exhaust gas, wastewater, solid waste, etc., but also established a good public-private cooperation mechanism. To fund the research and development of innovative technologies for emission reduction and pollution control [5]. In 1998, the German government realized the urgency of developing green industries and raised the whole society’s sense of responsibility for the importance of protecting the ecological environment while guiding industrial upgrading and technological innovation. Socioeconomics” [6]–[8].
Financial agglomeration – eco-efficiency is a complex system. On the one hand, financial agglomeration can promote economic growth by making full use of resources and optimizing the investment of credit funds, thereby improving the level of ecological efficiency. On the other hand, improving ecological efficiency will also promote the level of financial agglomeration. The improvement of ecological efficiency means that because of reducing resource use and environmental damage, higher economic value can be obtained at lower environ-mental costs. The agglomeration of financial institutions, financial products, technologies, etc. in a specific space can form financial agglomeration. Financial agglomeration is an important form of the financial industry. By optimizing the industrial structure to improve economic benefits, it has a positive effect on ecological efficiency [9], [10].
Eco-finance in Western countries started early, with distinct and diverse financial products, and accumulated rich experience in how to balance the nature of financial institutions’ profit-seeking nature and the nature of resource allocation [11]. First of all, from the perspective of implementation entities, it is di-vided into four categories: retail, investment banking, asset management and insurance. The target group of its green gold products is not only for enterprises, but also covers families and individuals. The retail side mainly provides ecological financial tools for residents, including green housing credit, new energy vehicle credit, green credit cards, etc.; investment banks mainly provide ecological financial products for government agencies and institutions, including green project financing and credit guarantee, technology leasing, private equity In-vestment and other products; asset management departments, such as public funds, provide low-carbon funds, green industry funds, new energy funds, etc.; insurance services cover a wide range, involving auto insurance, commercial insurance and carbon insurance.
The restrictive indicators and policies introduced by my country in the field of energy conservation and environmental protection have created a broad demand space for green industries. To promote green development, the state has continuously raised the environmental protection access threshold, strengthened the constraints of indicators such as total energy consumption and total pollutant discharge, and implemented systems such as ecological externality assessment and environmental performance assessment. The pushback of environmental policies has brought huge investment demands for green industries [12]. At the same time, the power change, green industry, as the best choice for economic development, resource conservation and environmental protection, has strong vitality [13]. However, in general, the current industrial policies and supporting mechanisms are not perfect. In the current free competition market structure, the comprehensive competitiveness of single-subject enterprises is weak, and the industrial concentration is low, making it difficult to form the core cohesion of industrial development. In particular, green small and micro enterprises with light asset attributes are in urgent need of help and support in the face of difficulties in financing and technological innovation.
The research on the relationship between economic agglomeration and ecological economic efficiency puts forward a new idea of model construction and economic development, which has certain practical significance.
The primary research question of this study is to examine the coordinated development between environmental financing and the green industry in the Yangtze River Economic Region of China. By utilizing data from 11 provinces and autonomous regions, a comprehensive evaluation model combining cluster finance and economic efficiency models was constructed. The findings of the study demonstrate an increasing level of financial groups in different provinces and cities along the Yangtze River economic zone, indicating a positive trend in the development of environmental financing. Furthermore, the research highlights the convergence of urban ecological and economic efficiency, suggesting that the promotion of environmental financing contributes to the overall sustainability and progress of the green industry in the region. Based on these findings, the paper proposes measures to further enhance ecological and financial efficiency, emphasizing the importance of regional financial and economic cooperation and the construction of an ecological civilization.
II. Ecological Finance and Coupling Collaboration Model
A. Ecological Finance
It has been more than 20 years since the birth of ecological finance. From the perspective of its development process, it generally shows the characteristics of “practice first and theory second”. Since a unified theoretical framework has not yet been formed, scholars have different opinions on the concept of “ecological finance”. Foreign scholars refer to ecological finance as environmental finance and believe that ecological finance is a means of environmental protection. Domestic scholars regard ecological finance to transform the financial industry and emphasize the importance of the financial industry as a medium in the connotation grasp.
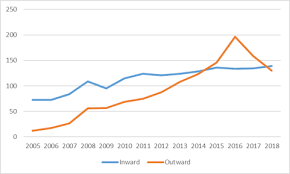
At present, in the overall structure of ecological finance in my country, more than 90% of the scale is occupied by green credit. According to data from relevant research institutions, as of 2020, my country’s green credit balance has grown to 11.95 trillion yuan, an increase of 17% from 10.33 trillion yuan in 2019. In recent years, commercial banks have launched mortgage and pledge financing services for the property rights of environmental assets, which revitalized the environmental property rights of enterprises and improved the financing difficulties of light-asset enterprises. Figure 1 shows the development of green credit after the central bank standardized the statistical caliber of green credit.
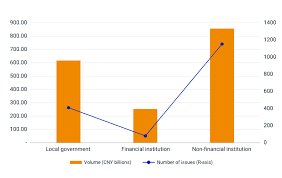
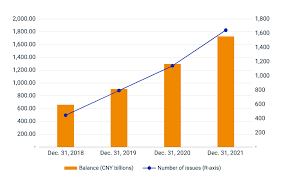
Overall, the domestic green bond market has become more active, with richer maturities and an improved overall rating. Figure 2 shows the custody volume of green bonds in my country since 2016, and Figure 3 shows the China Green Bond Index compiled by China Bond since 2010.
In recent years, the original premium income and insurance compensation expenditures in the Yangtze River Economic Belt have continued to rise, but the insurance depth is still lower than the national insurance depth, and the insurance industry in this region has a lot of room for development. As shown in Table 1.
| Years | Original insurance premium income (100 million yuan) | Insurance compensation expenditure (100 million yuan) | Insurance depth (%) |
|---|---|---|---|
| 2009 | 4582.42 | 1270.5 | 3.13 |
| 2010 | 5957.52 | 1310.02 | 3.37 |
| 2011 | 5940.78 | 1643.72 | 2.81 |
| 2012 | 6565.24 | 1990.17 | 2.76 |
| 2013 | 7175.58 | 2647.93 | 2.77 |
| 2014 | 8246.11 | 3069.77 | 2.92 |
| 2015 | 9787.49 | 3715.04 | 3.22 |
| 2016 | 12591.86 | 4495.95 | 3.74 |
| 2017 | 15160.54 | 4795.32 | 4.12 |
| 2018 | 15564.63 | 5241.69 | 3.66 |
Eco-efficiency integrates economy, environment and resources into a system, reflecting the relationship between economic development, environmental pollution and resource consumption. The connotation of eco-efficiency includes many aspects. Based on operability and scientific Ty, an eco-efficiency evaluation system should be constructed from different dimensions and in all directions.
B. Coupling Cooperation Model
This paper selects the three indicators in Table 2 as circular economy indicators, reflecting the status of the Yangtze River Economic Belt in harmony with nature while the economy is developing.
| System layer | Level I indicator | Secondary indicators | Positive and negative indicators |
|---|---|---|---|
| Ecological efficiency system \(Y\) | \(Y_1\) environmental pollution | \(Y_{11}\) Industrial wastewater discharge | – |
| \(Y_{12}\) Industrial sulfur dioxide emissions | – | ||
| \(Y_{13}\) Output of industrial solid waste | – | ||
| \(Y_2\) resource consumption | \(Y_{21}\) Annual electricity consumption | – | |
| \(Y_{22}\) Annual water consumption | – | ||
| \(Y_3\) economic performance | \(Y_{31}\) Per capita GDP | + | |
| \(Y_{32}\) Total industrial output value | + |
We take \(q\) factors as output factors, denoted as \(y_r\) \((r=1,\ldots,q)\), and because of the difference in factor weights, we denote the weights of different output factors as \(u_r\) \((r=1,\ldots,q)\). Finally, when we measure the efficiency of decision-making units, we denote the decision-making unit currently being measured as \(DMU_k\), then the ratio of output and input of this group of decision-making units is expressed by Eq. (1) as:
and, since the efficiency value cannot be greater than 1 and cannot be less than 0; so the efficiency value of this measure is limited to a minimum value greater than or equal to 0, and a maximum value less than or equal to 1, namely:
This model is based on constant returns to scale, and its linear programming model is:
Although the CCR model and the BCC model have natural advantages for measuring efficiency, these basic models still have many defects in practical application. For example, these basic models cannot compare these decision-making units when they are all at the frontier of production; and these basic models cannot measure all slack variables, and measurement errors will occur in actual operation; and these basic models also Dynamic changes in efficiency cannot be measured. The planning formula of the BCC model is as Eq. (4):
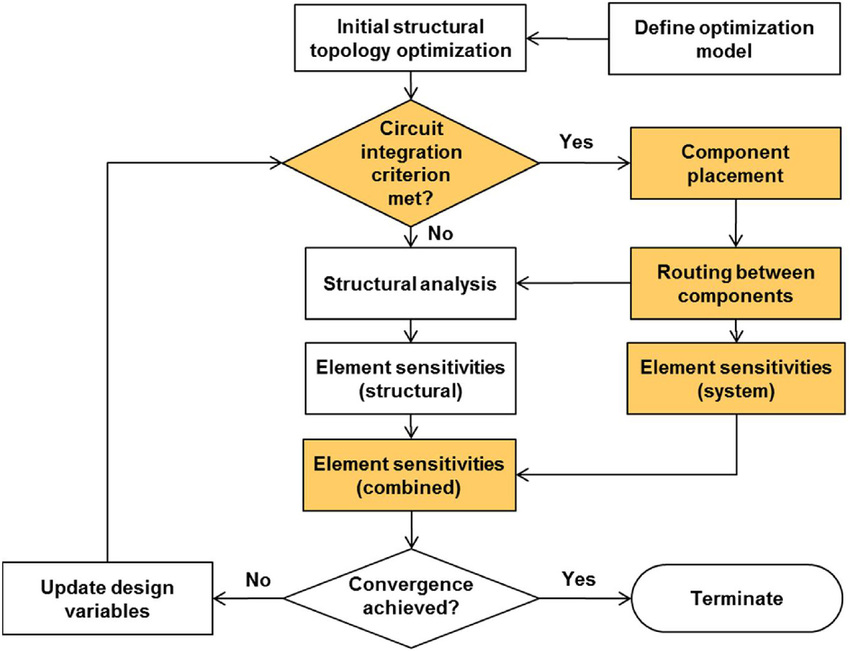
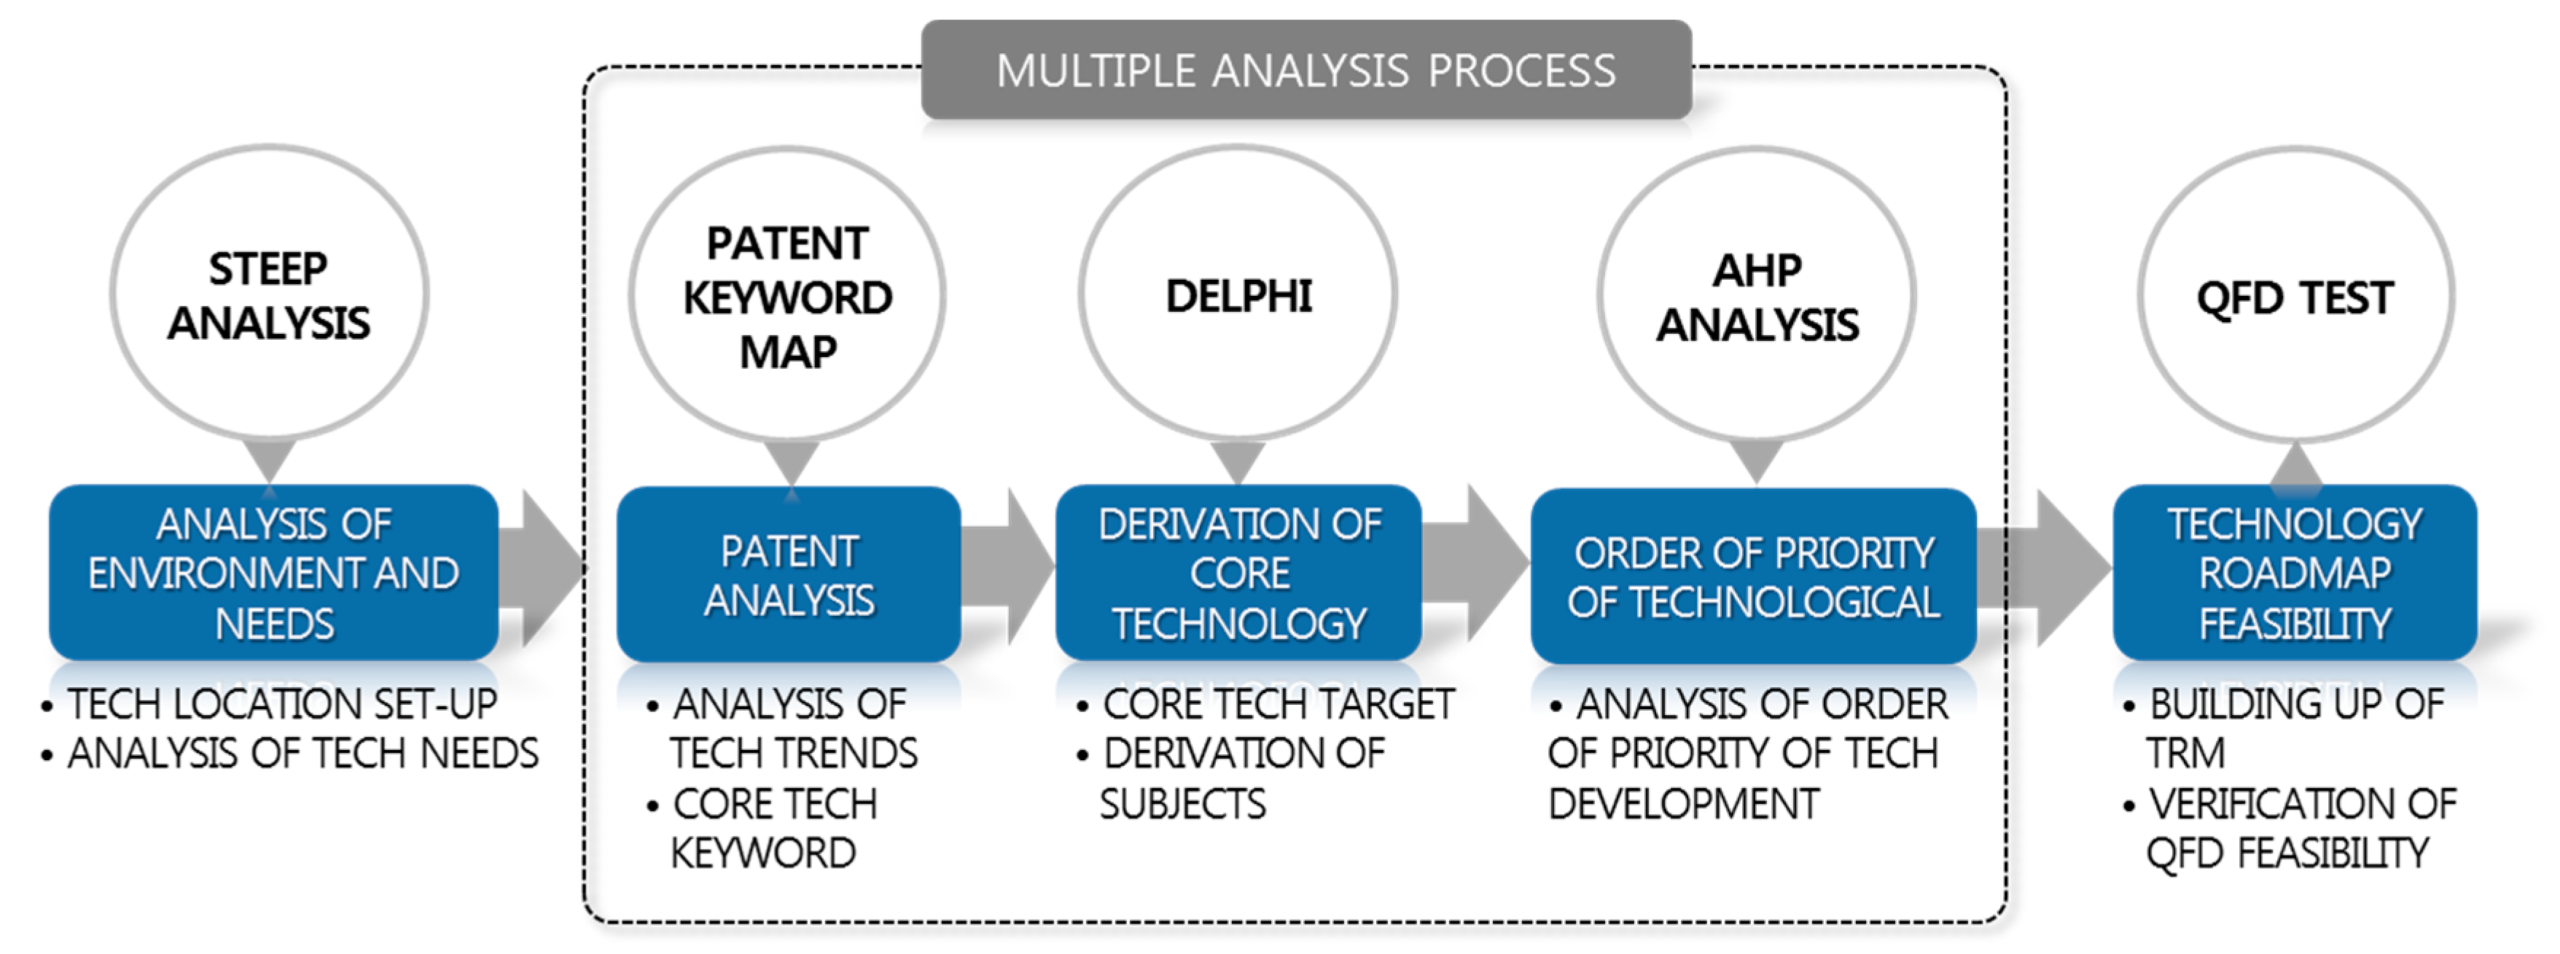
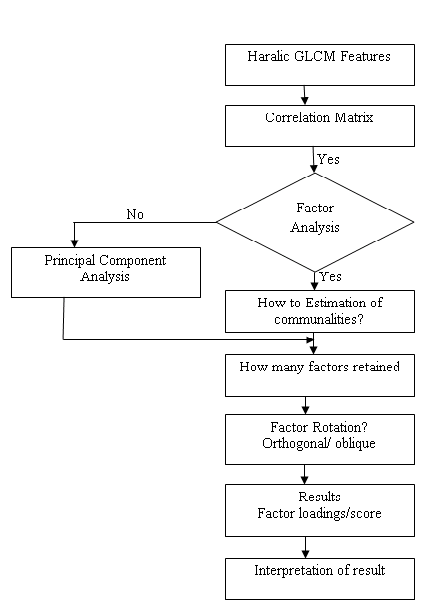
Its algorithm flowchart is shown in Figure 4 and its technical framework is shown in Figure 5. The coordinated development of ecological finance and green industry is a multi-objective system decision, and suppose the system has \(N\) targets, and now give the targets a certain efficacy coefficient \(X_{kij}\), \(0\leq X_{kij}\leq1\), because there are two subsystems, so \(K=1,2\), when the target is the most satisfactory, \(X_{kij}=1\), when the target When most dissatisfied, \(X_{kij}=0\).
For a negative power function, the larger the index value, the smaller its positive contribution to the system, as shown in the Equation.
Use the above calculation formula for the orderly efficacy of each order parameter and the following weighted arithmetic mean method to calculate the order degree of each order parameter in the ecological finance subsystem, the green industry subsystem and the ecological finance and green industry coupling system respectively. Total Contribution”, as shown in the following Equation:
The calculation parameters of coupling collaboration are shown in Table 3 and the coupling coordination degree division table are shown in Table 4.
| \(C\) reference interval | Coupling stage |
|---|---|
| 0.00–0.09 | Low level coupling stage |
| 0.10–0.19 | |
| 0.20–0.29 | |
| 0.30–0.39 | Antagonistic phase |
| 0.40–0.49 | |
| 0.50–0.59 | Running in stage |
| 0.60–0.69 | |
| 0.70–0.79 | High level resonance stage |
| 0.80–0.89 | |
| 0.90–1.00 |
| Coordination type | \(D\) reference interval | Coordination level | \(U_2i\) Relationship with \(U_1i\) |
|---|---|---|---|
| Dysfunctional recessive type | 0.00–0.09 | Extreme disorder (I) | \(U_{2i}\to0.1\) zero-point one Green finance lagging type \(|U_{2i}-U_{1i}|\leq0.1\) Synchronous type of green finance and green industry \(U_{1i}\to0.1\) Lagging green industry |
| 0.10–0.19 | Severe disorder (II) | ||
| 0.20–0.29 | Moderate disorder (III) | ||
| 0.30–0.39 | Mild disorder (IV) | ||
| Transitional type | 0.40–0.49 | Near disorder (V) | |
| 0.50–0.59 | Reluctant coordination (VI) | ||
| Coupling coordination type | 0.60–0.69 | Primary coordination (VII) | |
| 0.70–0.79 | Intermediate coordination (VIII) | ||
| 0.80–0.89 | Benign coordination (IX) |
III. Variable Selection
First, in terms of ecological financial indicators, ecological financial instruments mainly include green credit, green credit is the earliest ecological financial practice in my country, and the data structure is relatively complete. The development time of green bonds in my country is short and the availability of relevant scale data is low, so the China Green Bond Index released by China Bond Valuation Center since 2018 is used as the measurement index. The green insurance market is still in its infancy and underrepresented. As shown in Table 5.
| region | 2009 | 2010 | 2011 | 2012 | 2013 | 2014 | 2015 | 2016 | 2017 | 2018 |
|---|---|---|---|---|---|---|---|---|---|---|
| Shanghai | 0.801 | 0.796 | 0.738 | 0.699 | 0.717 | 0.694 | 0.721 | 0.721 | 0.653 | 0.678 |
| Jiangsu Province | 0.631 | 0.657 | 0.694 | 0.696 | 0.677 | 0.723 | 0.768 | 0.752 | 0.795 | 0.724 |
| Zhejiang Province | 0.561 | 0.601 | 0.623 | 0.607 | 0.625 | 0.645 | 0.710 | 0.666 | 0.692 | 0.645 |
| Anhui Province | 0.244 | 0.225 | 0.225 | 0.226 | 0.227 | 0.248 | 0.263 | 0.283 | 0.284 | 0.256 |
| Jiangxi Province | 0.087 | 0.113 | 0.087 | 0.084 | 0.085 | 0.112 | 0.128 | 0.114 | 0.115 | 0.107 |
| Hubei province | 0.225 | 0.212 | 0.227 | 0.219 | 0.221 | 0.246 | 269 | 0.247 | 0.274 | 0.257 |
| Hunan Province | 0.179 | 0.178 | 0.194 | 0.185 | 0.185 | 0.246 | 0.285 | 0.246 | 0.275 | 0.259 |
| Chongqing City | 0.192 | 0.195 | 0.169 | 0.163 | 0.161 | 0.159 | 0.147 | 0.122 | 0.139 | 0.156 |
| Sichuan Province | 0.364 | 0.382 | 0.377 | 0.377 | 0.378 | 0.394 | 0.418 | 0.429 | 0.402 | 0.364 |
| Yunnan Province | 0.136 | 0.117 | 0.105 | 0.104 | 0.106 | 0.121 | 0.106 | 0.124 | 0.104 | 0.088 |
| Guizhou Province | 0.078 | 0.090 | 0.114 | 0.085 | 0.055 | 0.054 | 0.054 | 0.058 | 0.085 | 0.087 |
A. Empirical Analysis
It is necessary to adopt the objective weighting method to analyze the correlation and information between the indicators. The subsystems allocate the weights separately. In the specific implementation of the calculation, the specific operation of the modified entropy weight method is as follows:
The single-index evaluation score is shown in the following Equation:
B. Construction of Evaluation Index System
The large scope has a great impact on it; regarding the degree of correlation between the two, some scholars have studied the impact of ecological finance on the industrial structure, and most of them focus on the research on industrial optimization of green credit and related qualitative analysis, and neither ecological finance nor green industry has formed a standard. Comprehensive evaluation index system. As shown in Table 6:
| Target layer | Criterion layer | Indicator layer | Single finger | Single indicator weight | Criteria layer weight |
|---|---|---|---|---|---|
| Green Finance | Green credit balance | RMB100mn | 0.21 | 1 | |
| Proportion of green credit in RMB loan balance | % | 0.019 | |||
| China Green bond index | Spot | 0.29 | |||
| Green industry | Green upgrading of infrastructure |
Annual cumulative amount of air pollution prevention and control equipment | Platform | 0.02 | 0.06 |
| Environmental protection equipment industry index | Spot | 0.03 | |||
| Completion of fixed assets investment in manufacturing of special equipment for environmental protection | Ten thousand yuan | 0.01 | |||
| Number of measuring points of environmental acoustic cover | individual | 0.01 | |||
| Energy saving and environmental protection |
GDP energy intensity | Tons of standard coal / 10000 yuan | 0.03 | 0.20 | |
| Water resource consumption per unit of agricultural added value | (100 million / m3) | ||||
| Environmental protection engineering and service industry index | Spot | ||||
| Total investment in national environmental pollution control | Single finger | ||||
| Total investment in national industrial pollution control | Ten thousand yuan | ||||
| Recovery of main renewable resources | 10000 tons | ||||
| Green clothes | Proportion of tertiary industry in GDP | % | 0.19 | ||
| Total amount of pollutant discharge fee paid into the warehouse | Ten thousand yuan | ||||
| Amount of environmental protection products purchased by the National Government | Single finger |
IV. Case Study
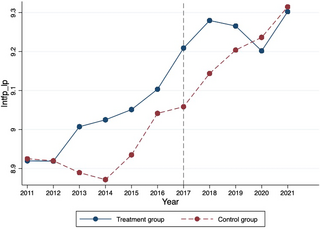
Combined with the weight of the ecological finance single indicator proposed by the previous model, multiplied with the normalized data of the original data, and then summed up different indicators to obtain the evaluation index of ecological finance for each year. Among them, the weight of the single index obtained by calculating the difference coefficient using the entropy weight method is different, and the effect of different indexes on the overall evaluation of ecological finance is also different. In the evaluation system of ecological finance, the balance of green credit accounts for 20%, the role of green credit in the balance of RMB loans accounts for 18%, the role of China’s green bond index accounts for 28%, and the six energy-intensive industries account for industrial, the proportion of industrial interest expenses accounted for 20%, and the proportion of public financial expenditures invested in energy conservation and environmental protection accounted for 15%. The experimental results are shown in Figure 7.
The results obtained through the objective weighting method are more reasonable. Green credit in ecological finance has the most mature development in China, occupying half of the ecological finance. Its development has a greater impact on ecological finance. Its positive evaluation index green credit balance and negative the six high-energy-consuming industries account for 40% of the industrial industry’s interest expenditure in the evaluation index system; the number of bond types has exceeded 80, and the number is nearly 2,100. The government, finance and public utilities are the three issuers, and their overall scale is difficult to calculate[14]–[16].
As the second largest type of eco-finance product in China, this paper selects the China Green Bond Index issued by China Bond Valuation Center as a measure of 28% of eco-finance development. The last item that accounts for 15% of the power is the proportion of public financial expenditures invested in the field of energy conservation and environmental protection. Ecological finance has obvious top-down attributes in China, and the role of government expenditure cannot be underestimated. The proportion as a measure more accurately removes the influence of the total amount, showing how the government’s cake is divided into the fields of energy conservation and environmental protection in different years, which is of representative significance for the study of the implementation progress of ecological finance. It is difficult to obtain accurate statistics on the premium income of other green insurance and the specific data of green funds, and this article does not consider it here. According to the above formula, these indexes are used to analyze the development level index of the ecological financial subsystem. The specific calculation results are shown in Table 7.
| Indicator / year | 2013 | 2014 | 2015 | 2016 | 2017 | 2018 | 2019 |
|---|---|---|---|---|---|---|---|
| Yearend balance of green credit | 0.0024 | 0.0353 | 0.0755 | 0.0957 | 0.1359 | 0.1829 | 0.2309 |
| Green credit balance / RMB loan balance | 0.0629 | 0.0865 | 0.1036 | 0.0287 | 0.0351 | 0.0372 | 0.0012 |
| Proportion of public financial expenditure invested in energy conservation and environmental protection | 0.1267 | 0.0361 | 0.0628 | 0.0539 | 0.1998 | 0.2172 | 0.2651 |
| China Green bond index | 0.0014 | 0.0365 | 0.0735 | 0.0781 | 0.0785 | 0.1138 | 0.1344 |
| China Green bond index | 0.2391 | 0.1632 | 0.3251 | 0.3504 | 0.6127 | 0.7534 | 0.8976 |
Overall, the green industry has ushered in a periodical peak in 2014 and 2016, and the growth rate compared with the previous year is particularly significant, 79.30% and 32.33% respectively, of which energy conservation and environmental protection and ecological environment have obvious driving effects. Observing the development trend of the six major criteria layers.
In addition, according to the above formula, this section also uses the subsystem development level index to performs statistical analysis on the calculation results according to the corresponding grading standards. The calculation results are shown in Table 8.
| particular year | Coupling degree (c) | Coupling stage | Coupling coordination degree D | Coordination level | Coordination type | |
|---|---|---|---|---|---|---|
| 2013 | 0.9921 | High level of | 0.4591 | Near disorder (V) | -0.0535 | Synchronous type |
| 2014 | 0.9396 | Vibration stage | 0.4826 | Near disorder (V) | 0.1699 | Green finance lagging type |
| 2015 | 0.9982 | 0.5883 | Barely coordinated (VI) | 0.0427 | Synchronous type | |
| 2016 | 0.9867 | 0.6427 | Primary coordination (VII) | 0.1367 | Green finance lagging type | |
| 2017 | 1.0000 | 0.7864 | Intermediate coordination (VIII) | 0.0122 | Synchronous type | |
| 2018 | 0.9982 | 0.8416 | Benign coordination (IX) | -0.0871 | Synchronous type | |
| 2019 | 0.9937 | 0.8945 | Benign coordination (IX) | -0.1838 | Green finance lagging type |
V. Conclusion
Eco-finance is also a branch of green development from a macro perspective and is inseparable from the performance of green industries. However, due to the special positioning of finance in the economic system, this paper considers it as a subsystem to consider whether it truly supports green industries. Its coupling degree C has always been higher than 0.9, indicating that regardless of the development level, the two have the nature of “sharing weal and woe” at any stage. The speed achieves the coupling effect of “hand in hand”. When calculating the coupling coordination degree D, the weighted average result T of the two subsystems is used as a variable, which balances the insignificant value of C, and considers the development level other than the development speed. From 2013 to 2020, the coupling coordination degree of the two climbed at a growth rate of 5.14%, 21.89%, 9.25%, 22.37%, 7.04%, 6.28%, from high-level coupling in low-level states to coordinated resonance in high-level states, this indicator reflects that the rapid development of ecological finance and green industry in recent years has achieved a leap from a low level to a high level of resonance. According to the data and results, the two carriages to achieve green development—ecological finance and green industry have cooperated tacitly in recent years. Although the level is still not stable, the growth process is full of leap forward and cyclical retreat. From quantitative change to qualitative change, we must continue to vigorously develop ecological finance and green industries and expand the green scope in the market environment. Since ecological finance has achieved a high level of coupling and coordination with the green industry, we should innovate the ecological financial service model and develop financial products suitable for different green sub-sectors, to drive the green industry to maintain vitality in the future economic environment.
While this study provides valuable insights into the coordinated development between environmental financing and the green industry in the Yangtze River Economic Region, it is important to acknowledge certain limitations. Firstly, the research focuses specifically on the Yangtze River Economic Region in China, which may limit the generalizability of the findings to other regions or countries. Additionally, the study relies on data from 11 provinces and autonomous regions, and expanding the dataset to include a broader geographical scope could enhance the robustness of the analysis. Furthermore, the evaluation model used in this research could be further refined and validated through additional empirical studies. For future directions, it would be beneficial to explore the long-term impacts of environmental financing on the sustainable development of the green industry, and to investigate the effectiveness of specific measures proposed in this study. Moreover, considering the rapidly evolving nature of environmental challenges and financial mechanisms, continuous monitoring and updating of the evaluation model will be essential to capture changing dynamics and ensure the relevance of the findings in informing policy and decision-making processes.
Data Availability
The experimental data used to support the findings of this study are available from the corresponding author upon request.
Conflicts of Interest
The author declares no conflicts of interest regarding this work.
Funding Statement
There is no specific funding to support this research.