
With the rapid development of information technology and artificial intelligence, the education sector is gradually transforming towards digitalization and intelligence. Smart classrooms, as an important component of smart education, have become a hot topic in current educational technology research [1]. In the smart classroom environment, a large amount of heterogeneous data (such as video, audio, interaction logs, and text information) is collected in real time, providing an unprecedented data foundation for teaching process analysis and learning behavior understanding. Against this backdrop, how to utilize multimodal data to objectively, dynamically, and meticulously evaluate teaching effectiveness has become one of the key issues in the development of intelligent education [2], [3].
Traditional teaching effectiveness evaluation mainly relies on exam scores, questionnaires, or subjective teacher evaluations. These methods often have limitations such as strong lag, high subjectivity, and difficulty in reflecting the dynamic changes in the learning process [4]. In contrast, automated evaluation methods based on multimodal data can characterize students’ learning status from multiple dimensions such as classroom behavior, emotional state, and cognitive activities, thus providing a more comprehensive and real-time basis for teaching effectiveness analysis. Therefore, constructing a teaching effectiveness evaluation method that can integrate multi-source information and perform high-level semantic modeling is of great significance for improving teaching quality and realizing personalized education [5], [6].
However, multimodal teaching effectiveness evaluation still faces several key challenges. First, different modalities of data differ significantly in their representation and statistical properties. For example, visual data focuses on explicit behavior, audio data reflects speech and emotional information, while logs and texts contain structured and semantic information [7], [8]. This heterogeneity complicates multimodal fusion. Second, classroom behavior exhibits distinct temporal dynamics; student engagement fluctuates with changes in teaching content, interaction pace, and cognitive load, making it difficult for traditional static modeling methods to effectively characterize this process. Third, a semantic gap exists between underlying behavioral signals and higher-level teaching effectiveness, making accurate assessment difficult with simple feature mapping alone. Furthermore, in real-world teaching scenarios, data often suffers from noise interference or modality loss, placing higher demands on the robustness and generalization ability of the model [9].
To address the aforementioned issues, existing research has explored various approaches. At the unimodal level, some works utilize computer vision techniques, employing pose estimation, facial expression recognition, and behavior detection to analyze student engagement; others leverage speech features or text content for sentiment and semantic analysis [10]. However, these methods typically rely on a single information source, making it difficult to comprehensively reflect students’ learning status. Regarding multimodal fusion, early methods often employed early fusion or late fusion strategies, which, while improving performance to some extent, remained limited due to the lack of explicit modeling of intermodal relationships. In recent years, with the development of deep learning, multimodal models based on Transformer or attention mechanisms have gradually been applied to educational analytics tasks. These methods have achieved better performance by modeling intermodal dependencies [11], [12].
Nevertheless, existing methods still have several shortcomings. First, most models focus on modality fusion itself, neglecting the semantic modeling process from “behavioral features” to “teaching effectiveness,” resulting in a lack of educational interpretability. Secondly, while some methods incorporate attention mechanisms, they fail to fully integrate the temporal characteristics of classroom behavior, making it difficult to capture dynamic changes in participation [13]. Furthermore, existing research largely focuses on participation detection or behavior recognition tasks, with less emphasis on elevating them to the higher-level goal of evaluating teaching effectiveness. Finally, in real-world smart classroom environments, data noise and modality loss are prevalent, yet related research still pays insufficient attention to model robustness [14], [15].
To address the aforementioned issues, this paper proposes a framework for evaluating the teaching effectiveness of smart classrooms based on multimodal data fusion. This method uses multimodal classroom data as input and achieves a hierarchical mapping from low-level features to high-level teaching effectiveness through behavior-driven modeling and cross-modal fusion. Specifically, this paper first extracts behavior-related features from multimodal information such as visual, audio, logs, and text, and constructs a unified multimodal representation. Second, a cross-modal attention mechanism is introduced to establish semantic associations between different modalities to enhance feature expressive power. Based on this, a temporal modeling module captures the dynamic changes in classroom behavior, thereby achieving a continuous characterization of student participation. Furthermore, this paper uses a behavior cue-driven modeling strategy to map multimodal features into participation representations in three dimensions: behavioral participation, emotional participation, and cognitive participation, which are ultimately used for teaching effectiveness evaluation.
In a smart classroom environment, student engagement can be characterized using multimodal data. Existing research indicates that engagement typically comprises three dimensions: behavioral engagement, affective engagement, and cognitive engagement. Behavioral engagement, which can be directly observed through explicit behavior, is a crucial foundation for multimodal modeling [16].
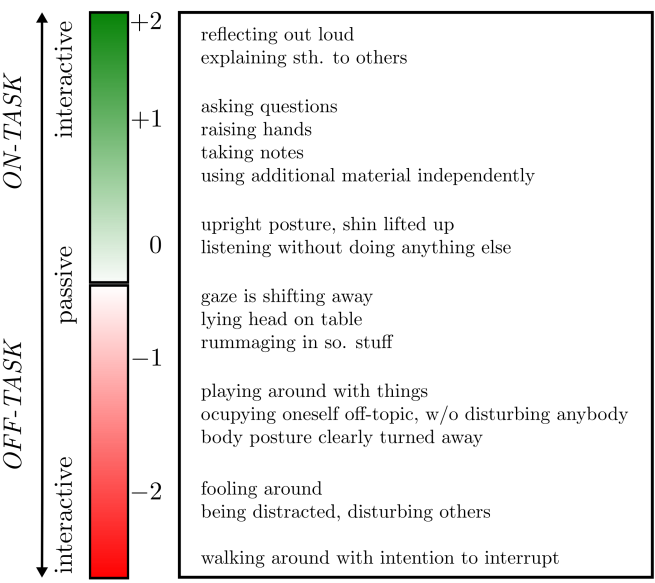
To facilitate subsequent modeling, this paper categorizes classroom behavior into positive and negative engagement behaviors, as shown in Figure 1. Positive behaviors indicate that students are actively participating and focused on learning, such as asking questions, taking notes, and attentively listening. Negative behaviors indicate a shift in attention or a lack of engagement, such as wandering eyes, engaging in irrelevant activities, or disturbing others.
From a multimodal perspective, the above behaviors can be represented by different data sources. The visual modality provides posture, facial expression, and gaze information; the audio modality reflects speech activity characteristics; the log modality records interaction behavior; and the text modality supplements semantic information. The multimodal input is defined as:
The corresponding behavioral characteristics are represented as follows:
Based on the above characteristics, behavioral engagement can be modeled as follows:
This definition provides the foundation for subsequent multimodal fusion and teaching effectiveness evaluation models.
In multimodal engagement modeling, visual information is a key source for characterizing student behavior. Compared to text and log modalities, visual modalities directly reflect students’ attention distribution, posture changes, and facial behavioral features, thus playing a crucial role in behavioral engagement modeling. Existing research has shown that computer vision-based behavioral analysis methods (such as pose estimation and facial landmark detection) can effectively capture explicit behavioral signals during the learning process and provide a reliable basis for engagement assessment [17], [18].
To achieve a structured representation of students’ visual behavior, this paper uses a combination of head pose and facial landmarks to model visual information, as shown in Figure 2.
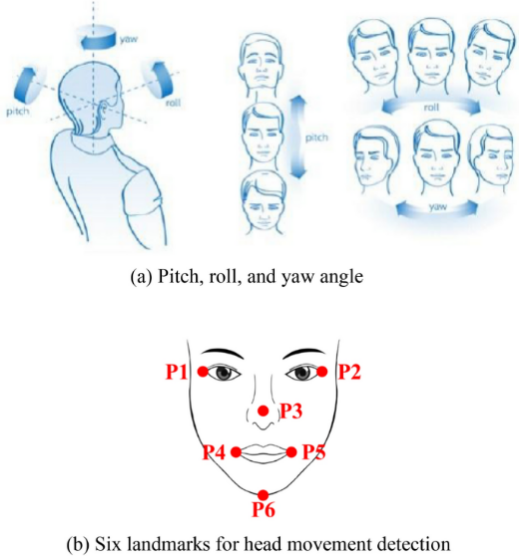
As shown in Figure 2(a), head posture is typically described using three Euler angles: pitch, yaw, and roll. Pitch reflects the vertical movement of the head, yaw represents horizontal rotation, and roll describes the degree of head tilt. These angles effectively characterize a student’s attention direction and concentration level. For example, frequent yaw changes are often associated with attentional shifts, while a stable posture corresponds to a higher level of concentration.
Furthermore, as shown in Figure 2(b), by extracting facial key points (such as the positions of the eyes, nose, and mouth), geometric constraints on head movement can be constructed. Let the set of key points be:
The head pose can then be represented as a function of the keypoint positions:
where, the function \(g(\cdot)\) represents the mapping process from 2D keypoints to 3D pose parameters. This representation not only has good computational efficiency but also adapts to different lighting and viewpoint conditions.
In the multimodal framework, visual behavioral features do not exist in isolation but complement other modalities. For example, the visual modality captures pose and attention information, the audio modality reflects speech participation, the log modality records interaction behavior, and the text modality provides semantic learning content. This cross-modal complementarity allows a single visual feature to acquire stronger expressive power during the fusion process.
Based on the above modeling method, visual modal features can be represented as:
and it participates in multimodal fusion as an important component of behavioral characteristics:
This definition provides a foundation for subsequent cross-modal feature alignment and fusion.
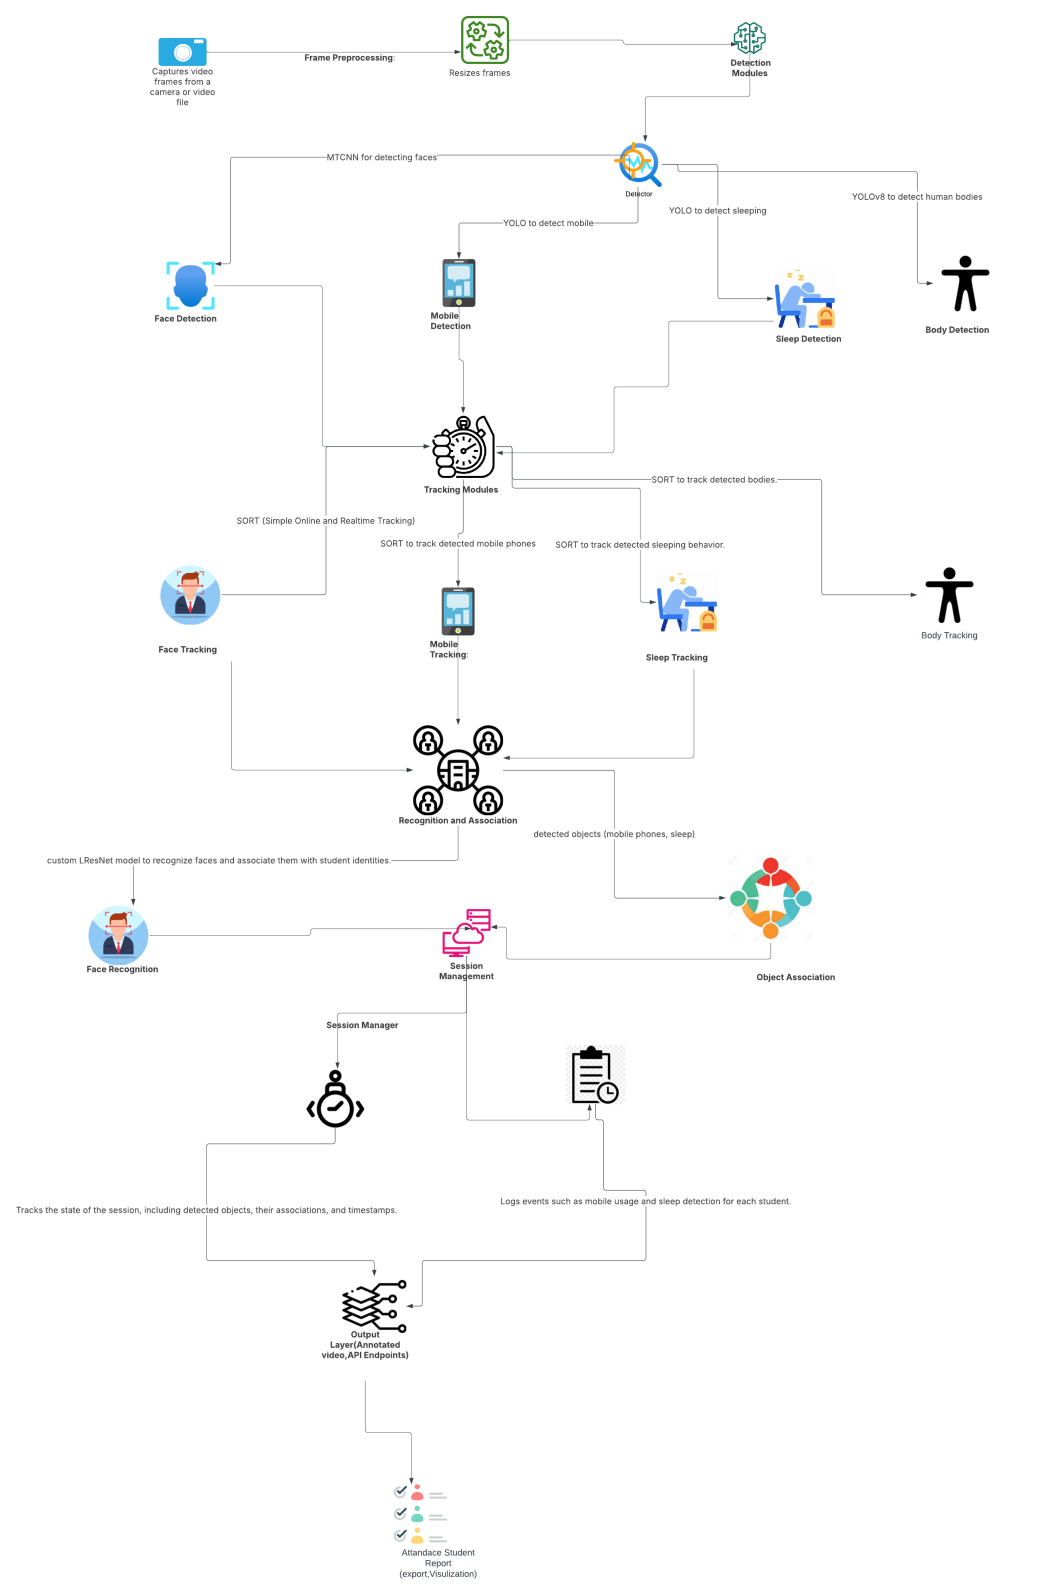
To achieve multi-dimensional evaluation of teaching effectiveness in smart classrooms, this paper proposes a unified analysis framework based on multimodal data fusion, the overall structure of which is shown in Figure 3. This framework uses classroom video streams as its core input, sequentially performing object detection, temporal tracking, identity association, and multimodal behavior modeling, ultimately outputting the teaching effectiveness evaluation results. Unlike existing methods that focus only on single behavior recognition or classroom monitoring, this paper uses the underlying visual detection results as foundational evidence for engagement modeling, further serving higher-level teaching effectiveness analysis.
Specifically, the input video first undergoes preprocessing before entering the detection module, which identifies key objects and behavioral states in the classroom, including human bodies, faces, and typical classroom behaviors (such as mobile phone use and drowsiness). Subsequently, a tracking mechanism associates the same target over time, constructing a continuous behavioral trajectory. Based on this, a face recognition and target association module is used to establish a correspondence between behavior and student identity, forming a structured “student-behavior-time” representation.
At the multimodal level, the visual branch in Figure 3, along with audio, logs, and text information, constitutes a unified input. The visual modality primarily provides explicit features such as posture, head movement, and behavioral state, while other modalities supplement speech participation, interactive behavior, and semantic information. Based on the previous definitions, this information is organized into a unified behavioral feature representation and further mapped to participation representation, ultimately used for teaching effectiveness evaluation.
Overall, this framework can be summarized as a hierarchical process from multimodal input to teaching effectiveness output:
where, \(X\)represents multimodal observation data, \(F(\cdot)\)represents the feature extraction and fusion process, and \(G(\cdot)\) represents the teaching effectiveness evaluation mapping. This expression is only used to describe the overall process; the specific model design will be discussed in subsequent sub-sections.
In addition, the framework also includes a session management and result output module, used to record behavioral events and time information during the classroom process and generate structured results for teaching analysis.
In smart classroom scenarios, data from different modalities exhibit significant complementarity and heterogeneity at the semantic level. Visual modalities characterize students’ explicit behavioral states (such as posture, attention, and actions), textual modalities reflect learning content and semantic information, while knowledge concepts provide structured teaching context. Therefore, effectively fusing multi-source information within a unified representation space is a key issue in improving the performance of teaching effectiveness evaluation [19].
As shown in Figure 4, this paper constructs a fusion model based on a cross-modal attention mechanism. This model takes multimodal features as input, first extracts features through independent encoders, then models cross-modal interactions in a shared semantic space, and finally generates a unified multimodal representation vector through temporal modeling and attention aggregation.
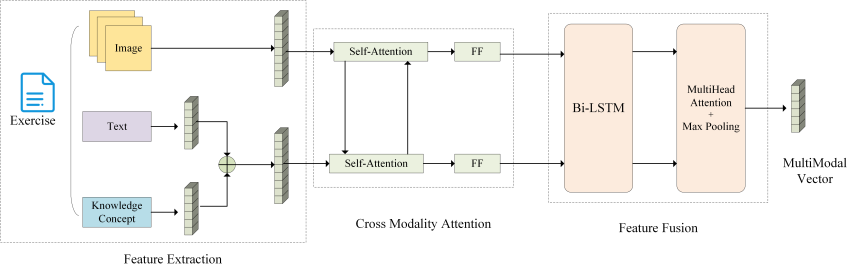
In the feature extraction stage, data from different modalities (such as images, text, and knowledge concepts) are mapped to corresponding feature representations and aligned to a unified dimensional space through linear projection, ensuring comparability and consistency in the subsequent fusion process. Unlike traditional simple concatenation methods, this paper does not directly superimpose features but instead models the dependencies between different modalities through a cross-modal attention mechanism.
Specifically, the cross-modal attention module combines self-attention and interactive attention to enable semantic alignment and information exchange between features from different modalities. The core objective of this process is to learn the relevance weights between modalities, thereby highlighting feature information more important to the current task. During this process, visual behavioral features can be associated with textual semantic information, such as the correspondence between student behavior states and current teaching content, thus enhancing the semantic consistency of engagement representation.
After completing cross-modal interaction, the model further introduces a temporal modeling module to capture the dynamic characteristics of classroom behavior over time. Considering the significant time dependence of student engagement, this paper employs a bidirectional loop structure to model the fused feature sequence, enabling the model to utilize both historical and future contextual information to obtain a more stable behavioral representation.
Subsequently, the temporal features are aggregated through multi-head attention and pooling operations to obtain the final multimodal fusion representation vector. This vector integrates visual, textual, and knowledge information, and completes a unified model of classroom behavior and learning content at the semantic level.
From an overall perspective, the multimodal fusion process can be represented as:
where,\(\mathrm{H}(\cdot)\) represents the combined mapping of cross-modal interaction and temporal modeling. This representation serves as the core input for subsequent engagement modeling and teaching effectiveness evaluation.
It should be noted that, compared with traditional multimodal methods, the key to the fusion model in this paper lies in two aspects: firstly, explicitly modeling the semantic dependencies between different modalities through a cross-modal attention mechanism, avoiding information redundancy caused by simple splicing; secondly, introducing dynamic classroom information through temporal modeling, enabling the fusion representation to more realistically reflect the changing process of student engagement.
Further, referring to Figure 5, the specific implementation process of the fusion model is described. This model uses textual and visual modalities as core inputs, and constructs a unified multimodal representation through a combination of cross-modal attention and temporal modeling to characterize the relationship between student behavior and learning content in the smart classroom.
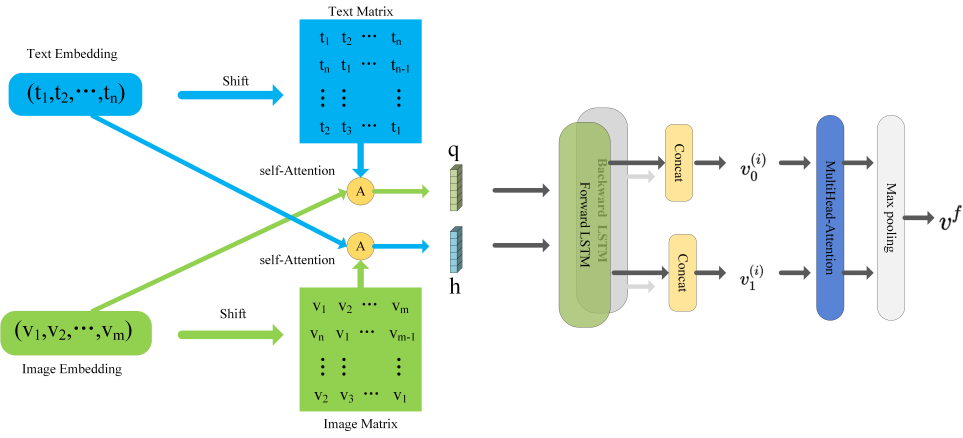
First, in the input layer, the text sequence and image features are represented as follows:
The text modality originates from classroom interaction semantics (such as asking and answering questions), while the visual modality is derived from previously extracted behavioral features (such as posture, head movements, and behavioral states). Both modalities are first mapped to a unified vector space through an embedding layer.
To enhance local contextual information, the model performs windowing rearrangement (shift operation) on the sequence and constructs a context matrix representation:
Subsequently, the model introduces a self-attention mechanism within each modality to capture dependencies within the sequence. For the text modality, its self-attention is represented as:
Similarly, for the visual modality:
Through this process, the model can model the structural relationships within both the semantic and behavioral sequences of the text.
Building on this, the model further constructs a cross-modal attention mechanism to enable interaction between textual and visual information. Specifically, it uses text as the query and visual information as the key-value pair for interaction:
Similarly, using vision as the query method yields:
Through this bidirectional interaction, the model can establish a correspondence between “behavior and semantics,” such as the association between a student’s action state and the current teaching content, thereby enhancing the expressive power of engagement modeling.
After completing cross-modal alignment, the model concatenates the interactive features and inputs them into the temporal modeling module. Considering the significant time dependence of classroom behavior, this paper adopts a bidirectional loop structure for modeling:
where, \([\cdot\mathbin{\|}\cdot]\)represents the feature concatenation operation. This structure can simultaneously utilize forward and backward contextual information to capture the dynamic trends of student behavior changes.
Finally, the model further aggregates temporal features through a multi-head attention mechanism and combines it with pooling operations to obtain a global representation:
This fusion vector integrates visual behavioral information and textual semantic information, and serves as the core input for subsequent engagement calculations and teaching effectiveness evaluations.
In smart classroom scenarios, multimodal data, even after feature extraction and fusion, remains at a low-level representation stage, making it difficult to directly use for evaluating teaching effectiveness. Therefore, it is necessary to introduce a mid-level semantic modeling mechanism to map low-level features into behavioral cues and engagement metrics with clear educational significance. To this end, this paper constructs an engagement modeling framework based on behavioral cues, the overall process of which is shown in Figure 6.
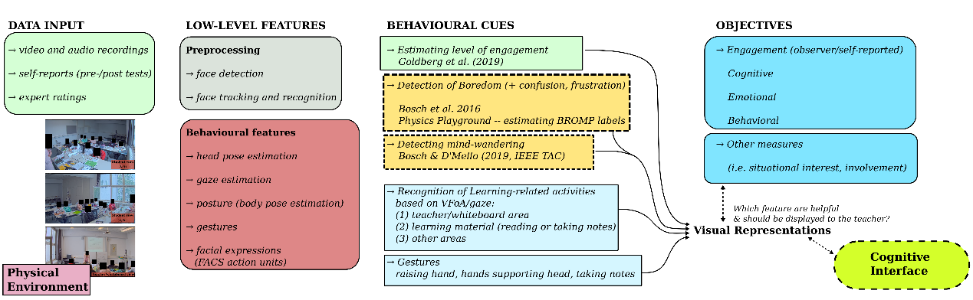
As shown in Figure 5, this process begins with multimodal data input, including classroom videos, audio recordings, and interactive information during the learning process. It can also incorporate supplementary information such as questionnaires, test results, or expert annotations. After preprocessing and feature extraction, the system obtains low-level feature representations related to vision, speech, and behavior. The visual modality primarily provides information such as head posture, gaze direction, body posture, and facial expressions; these features have already been structured and modeled previously.
Based on this, the model further maps low-level features to behavioral cues. These behavioral cues correspond to typical learning states in the classroom, such as focus, engagement, confusion, or distraction. One important type of cue is based on engagement estimation using posture and gaze, used to characterize students’ attention distribution; another type focuses on negative behaviors, such as looking down, deviating from the gaze, or actions unrelated to the classroom content, which are usually associated with boredom or confusion. Furthermore, by identifying specific learning behaviors (such as reading materials, taking notes, or raising a hand to speak), the model can further distinguish different types of engagement, thereby improving the semantic granularity of behavioral representations.
Unlike traditional methods that only classify behavior, this paper further organizes behavioral cues into engagement representations. Specifically, based on the previous definition, engagement is modeled as a comprehensive result across three dimensions: behavior, emotion, and cognition. Behavioral cues, as crucial intermediaries connecting low-level features with high-level semantics, enable the expression of information from different modalities within a unified semantic space. For example, focused postures in vision and interactive semantics in text can jointly support the judgment of high behavioral engagement, while persistent negative behavior may indicate low engagement or abnormal cognitive load.
After completing engagement modeling, the system further maps it to the teaching effectiveness evaluation objective. This objective not only includes traditional engagement indicators but can also be extended to assessments at the cognitive and emotional levels, as well as higher-level educational indicators such as contextual interest and learning engagement. Through this hierarchical modeling process, the system can gradually construct a complete semantic link from behavior to engagement and then to teaching effectiveness, starting from multimodal observation data.
To verify the effectiveness of the proposed multimodal teaching effectiveness evaluation framework, experiments were conducted on real-world smart classroom data. Experimental data consisted of classroom videos, audio recordings, and learning behavior logs, with teacher annotations and student feedback used to construct teaching effectiveness labels. The entire experimental process strictly followed the unified framework of “multimodal input, behavior modeling, engagement evaluation” proposed earlier.
In the data preprocessing stage, video frames were uniformly adjusted to a fixed resolution, and student-level behavior sequences were extracted using detection and tracking modules; audio signals were converted into time-frequency features; and log data was structured into time-series interaction records. All modal data were aligned using timestamps to ensure consistency in multimodal fusion [20].
Model training employed the Adam optimizer with an initial learning rate of \(1 \times 10^{-4}\) and a batch size of 32. The experiments were performed on a single GPU (e.g., an RTX 2080 Ti).
Since existing public datasets cannot simultaneously meet the comprehensive needs of multimodal information fusion, smart classroom scenarios, and teaching effectiveness evaluation, this paper constructs a multimodal dataset (SmartClass-MME) for real classroom environments. This dataset integrates multiple heterogeneous data sources: video modality for extracting student posture, facial expressions, and behavioral states; audio modality for analyzing classroom participation and emotional characteristics; log modality for recording student interactions (such as clicks and answering questions); and text modality for covering classroom Q&A and discussion content, thus forming a multidimensional characterization of the learning process. At the annotation level, this paper adopts a multi-source annotation strategy, unifying teacher evaluations (teaching effectiveness scores), student self-evaluations (participation scores), and expert annotations (behavioral and emotional labels) to construct a highly reliable supervisory signal. Finally, this paper represents teaching effectiveness as a unified label (Y), which can be defined as a continuous value \(Y\in\mathbb{R}\) to support regression tasks, or discretized as a rank label \(Y\in 1,2,3,4,5\) to support classification tasks, thereby meeting the needs of different evaluation scenarios [21].
To verify the effectiveness of our proposed method, several representative baseline models were selected for comparative experiments. First, regarding unimodal methods, Video-CNN (based solely on visual information) and Audio-RNN (based solely on speech information) models were employed to evaluate the ability of a single modality to model teaching effectiveness. Second, for simple fusion strategies, Early Fusion (feature-level concatenation) and Late Fusion (decision-level fusion) were introduced to analyze the performance of traditional fusion methods [22]. For deep multimodal methods, Multimodal Transformer and a BiLSTM-based fusion model (excluding cross-modal attention mechanisms) were selected for comparison to verify the importance of cross-modal modeling in complex model structures [23]. Furthermore, Engagement Detection, which only performs behavior classification, was introduced as a weak baseline to demonstrate the performance gain brought about by the improvement from behavior recognition to teaching effectiveness evaluation. Through these multi-level comparisons, the advantages of our proposed method under different modeling paradigms can be comprehensively evaluated.
Table 1 shows significant differences in performance among different methods for evaluating teaching effectiveness. First, single-modal methods (such as Video-CNN and Audio-RNN) generally perform poorly, indicating that relying on a single information source is insufficient to comprehensively depict students’ true participation in the classroom.
| Method | Modal | Acc (%) | Precision | Recall | F1 | MAE | RMSE | Pearson r |
|---|---|---|---|---|---|---|---|---|
| Video-CNN | Video | 72.3 | 0.70 | 0.72 | 0.71 | 0.68 | 0.85 | 0.61 |
| Audio-RNN | Audio | 69.8 | 0.68 | 0.69 | 0.68 | 0.72 | 0.89 | 0.57 |
| Early Fusion | V+A+L | 75.6 | 0.74 | 0.75 | 0.74 | 0.61 | 0.78 | 0.66 |
| Late Fusion | V+A+L | 76.4 | 0.75 | 0.76 | 0.75 | 0.59 | 0.76 | 0.68 |
| BiLSTM Fusion | V+A+L+T | 78.9 | 0.78 | 0.78 | 0.78 | 0.55 | 0.70 | 0.72 |
| Multimodal Transformer | V+A+L+T | 80.2 | 0.80 | 0.79 | 0.79 | 0.51 | 0.65 | 0.76 |
| Engagement Detection | Video | 74.1 | 0.73 | 0.72 | 0.72 | 0.63 | 0.80 | 0.64 |
| Ours | V+A+L+T | 85.4 | 0.85 | 0.84 | 0.84 | 0.42 | 0.52 | 0.83 |
Visual modalities outperform audio modalities, suggesting that explicit behavioral information (such as posture and movement) has a more direct discriminative ability in participation modeling. However, due to the lack of semantic and interactive information, these methods remain limited in complex teaching scenarios.
In contrast, fusion methods show significantly improved overall performance. Early Fusion and Late Fusion methods, by integrating multimodal information, show significant improvements in accuracy and F1 scores, but their performance is still limited by simple feature concatenation or decision combination methods, failing to fully model the deep semantic relationships between modalities. Furthermore, BiLSTM-based fusion methods, by introducing temporal modeling capabilities, enable the model to capture dynamic changes in classroom behavior, thus achieving further improvements across various metrics. However, this method still does not explicitly address the alignment problem between modalities.
The Multimodal Transformer method models the global dependencies between multimodal features through a self-attention mechanism, demonstrating strong performance on Precision, Recall, and Pearson correlation coefficients, indicating the effectiveness of deep multimodal modeling in this task. However, this method’s modeling of temporal structure is relatively implicit and it is not specifically designed for behavioral semantics.
In contrast, our proposed method achieves state-of-the-art results across all evaluation metrics, particularly excelling in RMSE and Pearson correlation coefficient. This shows that our proposed fusion model not only more accurately predicts teaching effectiveness scores but also better aligns with human evaluation results. The performance improvement stems from three main aspects: first, the cross-modal attention mechanism effectively models the correspondence between visual behavior and textual semantics; second, the introduced temporal modeling module enhances the ability to characterize dynamic classroom behavior; and finally, engagement modeling based on behavioral cues further improves the semantic consistency of feature representations.
To verify the actual contribution of each key module proposed in this paper to the overall model performance, an ablation experiment was designed based on the complete model. The cross-modal attention module, temporal modeling module, and behavior modeling module were removed respectively, and the results were compared under the same experimental settings. Since the task in this paper includes both teaching effect classification and rating prediction objectives, the experiment also reports classification performance, regression error, and consistency index with human ratings to more comprehensively analyze the impact of different modules on model performance.
As shown in Table 2, the complete model achieved optimal results across all evaluation metrics, indicating that each component module designed in this paper plays a positive role in evaluating teaching effectiveness. Specifically, removing the cross-modal attention module decreased the model’s F1 score from 0.84 to 0.78, while the RMSE increased from 0.52 to 0.66, demonstrating the crucial role of cross-modal attention in semantic alignment and information interaction between modalities. Due to the significant heterogeneity of visual behavioral information, speech participation information, and textual semantic information in smart classrooms, the complementary relationships between different modalities cannot be fully utilized without an explicit cross-modal interaction mechanism, leading to a decline in overall representational ability. Removing the temporal modeling module also resulted in a significant degradation in model performance, with the F1 score decreasing to 0.76 and the RMSE increasing to 0.70. This indicates that classroom behavior is not a static, instantaneous event but possesses continuous and dynamic characteristics. The temporal modeling module can capture the evolution of student participation states over time, thereby enhancing the model’s ability to characterize the continuity of teaching activities. If this characteristic is ignored, the model can only make judgments based on local segments, making it difficult to accurately reflect the fluctuations in participation in real classrooms.
| Model | Acc (%) | Precision | Recall | F1 | MAE | RMSE | Pearson r |
|---|---|---|---|---|---|---|---|
| w/o Cross-Attention | 79.6 | 0.79 | 0.77 | 0.78 | 0.53 | 0.66 | 0.74 |
| w/o Temporal Modeling | 77.8 | 0.77 | 0.75 | 0.76 | 0.58 | 0.70 | 0.71 |
| w/o Behavior Modeling | 76.3 | 0.75 | 0.73 | 0.74 | 0.61 | 0.73 | 0.69 |
| w/o Text Modality | 80.8 | 0.80 | 0.79 | 0.79 | 0.50 | 0.63 | 0.76 |
| w/o Audio Modality | 81.6 | 0.81 | 0.80 | 0.80 | 0.48 | 0.60 | 0.78 |
| w/o Log Modality | 82.1 | 0.82 | 0.81 | 0.81 | 0.46 | 0.58 | 0.79 |
| Full Model | 85.4 | 0.85 | 0.84 | 0.84 | 0.42 | 0.52 | 0.83 |
In contrast, the removal of the behavior modeling module resulted in the most significant performance degradation, with an F1 score of only 0.74, an RMSE of 0.73, and a Pearson correlation coefficient dropping to 0.69. This result demonstrates that behavior modeling is a crucial component of the framework presented in this paper. As previously mentioned, teaching effectiveness cannot be directly derived from low-level multimodal features; instead, a mid-level semantic bridge needs to be established through behavioral cues and engagement representations.
To further analyze the contribution of different modalities in the teaching effectiveness evaluation task, this paper designs a modality ablation experiment, gradually increasing the combination of input modalities, and evaluates the model performance under a unified experimental setting. This experiment can reveal the role of each modal information in the fusion process and its impact on the overall performance.
Table 3 shows that different modal combinations significantly impact model performance. First, using only the visual modality, the model already achieves a certain performance level (F1 score of 0.71), indicating that visual information (such as posture, head orientation, and behavioral state) plays a fundamental role in engagement modeling. This aligns with the previous analysis, which states that the visual modality directly reflects students’ overt behavior and is one of the most crucial data sources in classroom analysis.
| Modal combination | Acc (%) | Precision | Recall | F1 | MAE | RMSE | Pearson r |
|---|---|---|---|---|---|---|---|
| Video | 72.3 | 0.70 | 0.72 | 0.71 | 0.68 | 0.85 | 0.61 |
| Video + Audio | 77.1 | 0.76 | 0.77 | 0.77 | 0.60 | 0.75 | 0.68 |
| Video + Audio + Logs | 81.5 | 0.81 | 0.81 | 0.81 | 0.52 | 0.63 | 0.75 |
| Video + Audio + Logs + Text (Full) | 85.4 | 0.85 | 0.84 | 0.84 | 0.42 | 0.52 | 0.83 |
Introducing the audio modality significantly improves model performance (F1 score increases to 0.77, RMSE decreases to 0.75), demonstrating that audio information effectively supplements engagement features that are difficult to express in the visual modality. For example, students’speaking frequency, vocal emotion, and interaction patterns can further reflect their classroom engagement, thereby enhancing the model’s ability to characterize behavioral semantics. Furthermore, adding the log modality further improves model performance (F1 score reaches 0.81), and the regression error significantly decreases. This indicates that interactive behavior data (such as clicks, answers, and operation records) can provide more stable and structured information about the learning process. Compared to visual and audio signals, log data has stronger temporal continuity and behavioral determinism, thus playing an important supplementary role in engagement modeling.
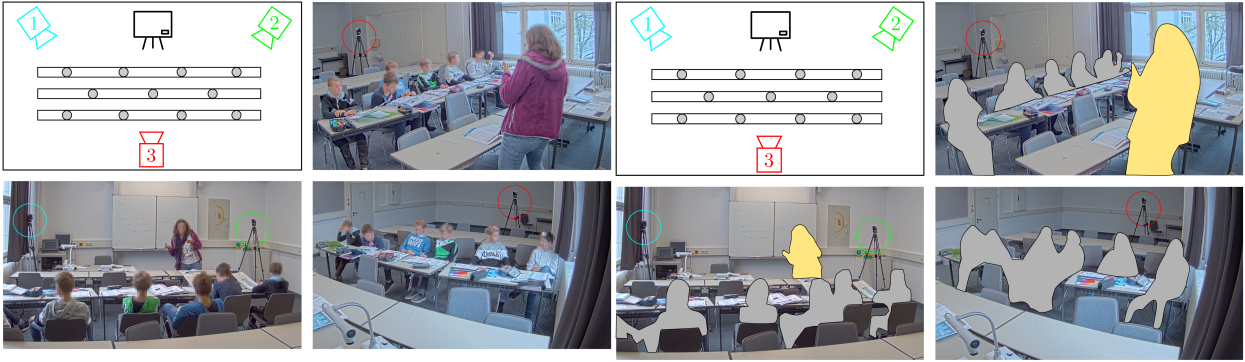
As shown in Figure 7, the proposed method was visually validated in a real smart classroom scenario. The upper part shows the original classroom images and the multi-view acquisition environment, where different camera positions (labeled 1, 2, and 3) are used to acquire multi-view behavioral information of students and teachers, thus providing basic input for multimodal modeling. Through the target detection and tracking module, the system can accurately locate key objects in the classroom (such as students and devices) and maintain stable recognition in complex environments, such as the device target shown in the red area of the figure. The lower part further presents the behavioral analysis results of the model, where the gray area represents individual student segmentation and behavioral region extraction, and the yellow area represents the teacher, thus forming a clear distinction of classroom roles. Based on this, combined with the multimodal fusion model proposed above, the system can uniformly model visual behavioral information with voice, log, and text information, realizing a hierarchical mapping from “target detection, behavioral representation, engagement analysis”.
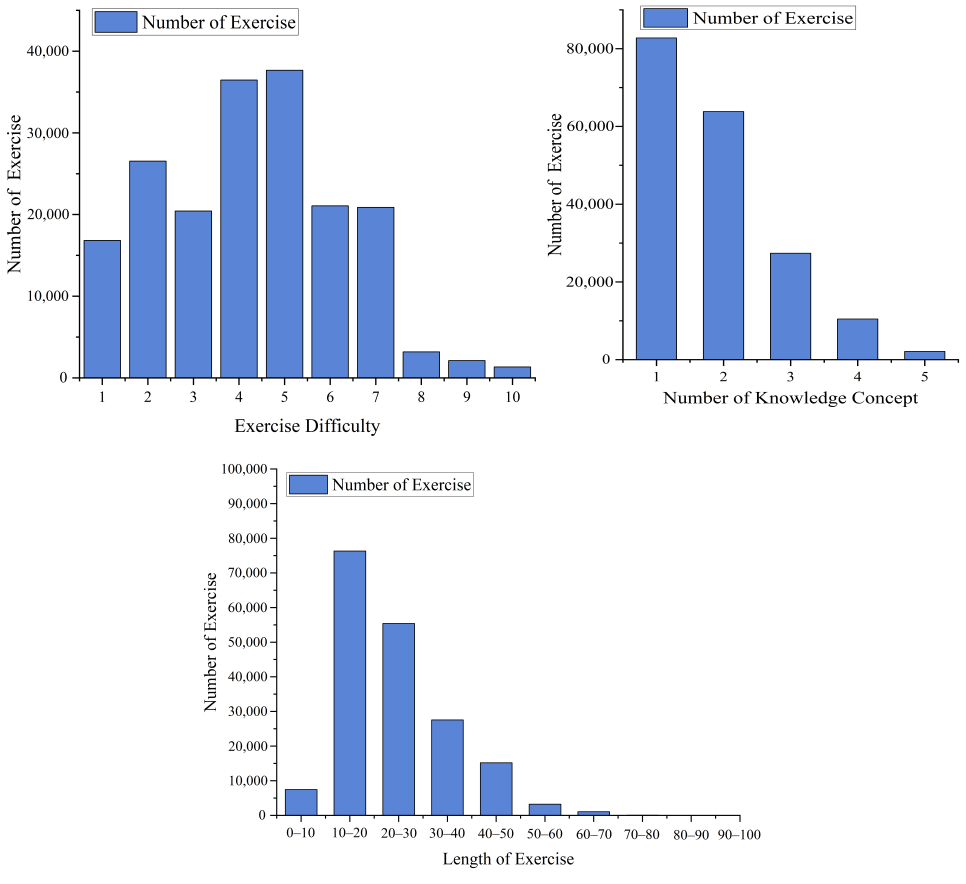
As shown in Figure 8, the dataset constructed in this paper exhibits distinct distribution characteristics across three dimensions: question difficulty, number of knowledge points covered, and question length. First, regarding question difficulty, most samples are concentrated in the medium difficulty range (approximately levels 4–6), while high and low difficulty samples are relatively few, indicating that the dataset as a whole closely reflects the characteristics of actual teaching scenarios: “primarily medium difficulty with fewer samples at both ends.” This distribution is beneficial for the model to learn student behavior and participation patterns in typical teaching situations. Second, regarding the distribution of the number of knowledge points, most questions involve only 1 to 2 knowledge points, while samples involving multiple knowledge points (\(\geq 3\)) gradually decrease, reflecting the structural characteristic of knowledge points gradually accumulating in classroom teaching. This distribution is particularly important for multimodal fusion models because changes in knowledge complexity directly affect students’ cognitive load, thereby influencing behavioral performance and participation modeling. Finally, regarding question length, most question lengths are concentrated in the 10–30 range, with significantly fewer longer text samples (>50), indicating that the data is dominated by short texts and medium-length content. This helps the model extract semantic features more stably in the text modality while avoiding noise interference from excessively long sequences.
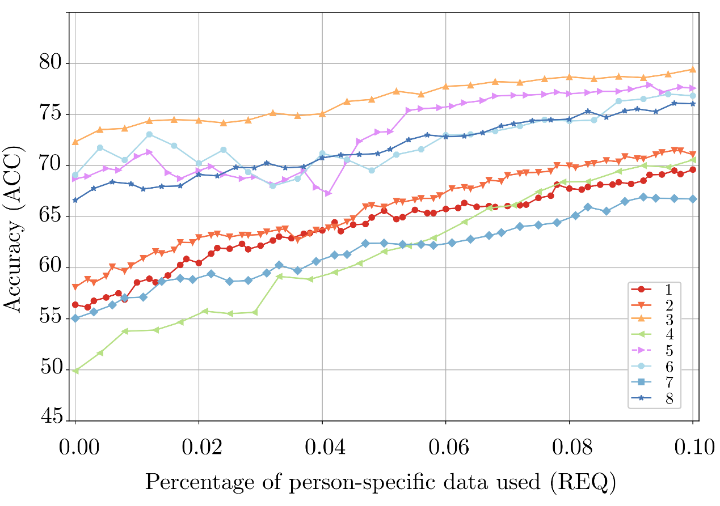
As shown in Figure 9, this paper analyzes the performance trends of various comparative methods and the proposed model in the teaching effectiveness evaluation task under different percentages of person-specific data (REQ). Overall, as REQ gradually increases from 0 to 0.10, the accuracy of each method shows a steady upward trend, indicating that introducing a small amount of individual-related data can effectively improve the model’s ability to model differences in student behavior. In the low REQ region (<0.03), the performance differences among methods are more obvious. The proposed method (curve 8) has shown a relatively stable advantage, indicating that it still has strong generalization ability under the condition of scarce individual data. This is mainly due to the multimodal fusion mechanism and behavior-driven modeling strategy proposed above, which enables the model to make full use of cross-modal shared information for inference. As REQ gradually increases, the performance of each method continues to improve, but the rate of improvement gradually slows down, indicating that when individual information reaches a certain scale, the model performance tends to saturate. In contrast, our method maintains the highest or near-highest accuracy across the entire range, and further expands its advantage in the high REQ stage (>0.07), indicating that it has a stronger adaptability in integrating individual characteristics and group patterns.
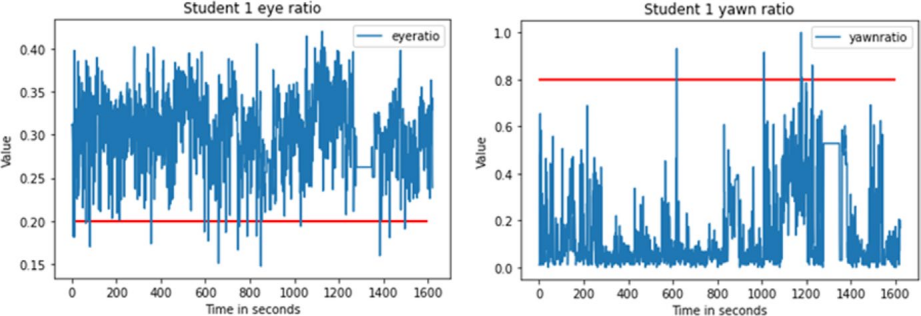
As shown in Figure 10, this paper conducts a temporal visualization analysis of key behavioral characteristics of a single student during the classroom process. The left figure represents the eye ratio, and the right figure represents the yawn ratio. The horizontal axis represents time (seconds), and the red horizontal line represents the corresponding behavior judgment threshold. The results show that the eye ratio remains at a high level and is stably distributed above the threshold, indicating that the student is relatively focused for most of the time, with only brief fluctuations in certain time periods, consistent with normal attention fluctuations in the classroom. In contrast, the yawn ratio is close to a low value for most of the time, but shows a significant peak in certain time periods (such as around 1000 seconds), even exceeding the set threshold, indicating that the student may be experiencing fatigue or decreased attention during these periods. Combined with the multimodal behavior modeling framework proposed in this paper, these temporal features can serve as an important component of behavioral cues, participating in the engagement modeling process along with visual posture, interactive behavior, and speech features. Specifically, a consistently stable eye ratio usually corresponds to high behavioral engagement, while frequent or sudden yawning may reflect excessive cognitive load or learning fatigue, thus affecting the overall engagement assessment.
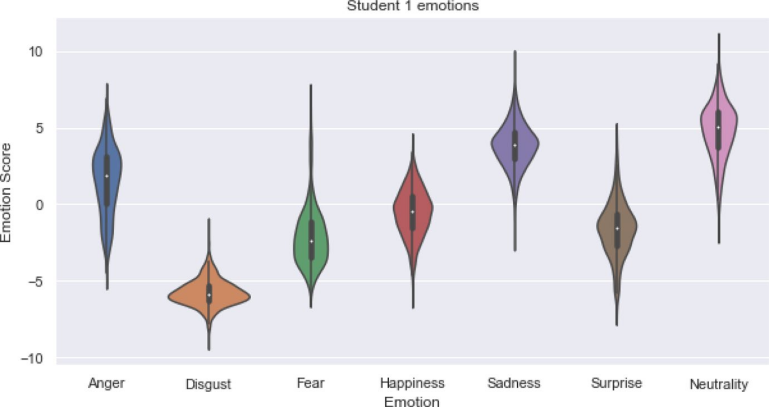
As shown in Figure 11, this paper conducted a statistical distribution analysis of the emotional states of individual students in the classroom, using a violin diagram to illustrate the score distribution under different emotion categories, including anger, disgust, fear, happiness, sadness, surprise, and neutrality. The overall distribution shows that neutral and positive emotions (such as happiness) dominate in the classroom, with scores concentrated in the higher range and a relatively stable distribution, indicating that students are in a relatively stable or positive emotional state for most of the time, consistent with emotional performance in a normal teaching environment. In contrast, negative emotions (such as disgust and fear) have a lower overall distribution and less fluctuation, indicating that strong negative emotions occur less frequently in the classroom. Notably, sadness and surprise show a larger distribution range and greater fluctuation, suggesting that students may experience emotional fluctuations due to changes in cognitive load or stimulation from teaching content at certain stages of the lesson. For example, when the difficulty of the teaching content increases or comprehension is hindered, brief negative emotions may occur; while during key knowledge point explanations or interactive sessions, emotions such as surprise or interest may be triggered.
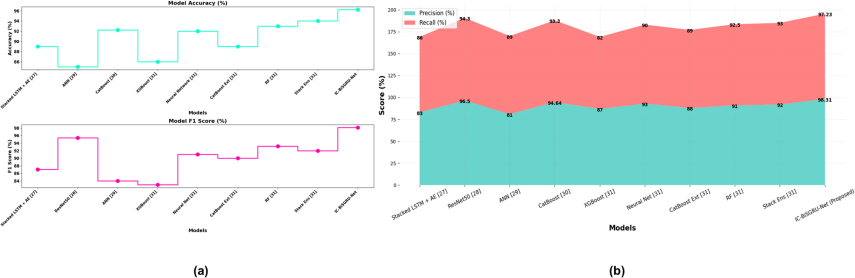
As shown in Figure 12, this paper comprehensively compares the performance of the proposed method with various comparative models on the teaching effectiveness evaluation task. Figure 11(a) shows the performance of different models in terms of accuracy and F1-score. It can be observed that as the model gradually transitions from a single-modal method to a multimodal fusion method, its overall performance shows a steady upward trend. Traditional models (such as basic RNNs or simple fusion methods) exhibit significant fluctuations in accuracy and F1 scores, indicating limited stability in complex classroom scenarios. However, after introducing multimodal information and temporal modeling, the model performance is significantly improved, especially after fusing visual behavior and semantic information, resulting in a significant improvement in F1-score. In comparison, the model proposed in this paper performs best among all methods, achieving the highest level in both accuracy and F1-score, demonstrating its advantages in multimodal feature modeling and semantic fusion. Figure 11(b) further analyzes the model performance from the two dimensions of precision and recall. As can be seen, most baseline methods have a certain trade-off between precision and recall, while the method in this paper achieves a better balance between the two, effectively identifying high-participation samples while avoiding too many misjudgments of low-participation states.
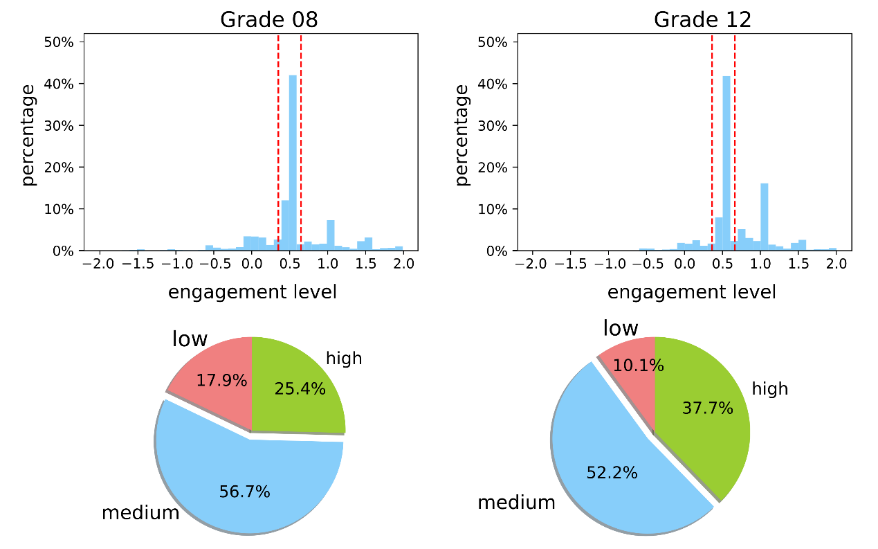
As shown in Figure 13, this paper conducts a statistical analysis of the participation distribution of students in different grades (Grade 08 and Grade 12) to verify the applicability and generalization ability of the proposed model in different teaching groups. The upper part shows the distribution of continuous participation values. It can be observed that both sets of data show a concentrated distribution trend, mainly clustered in the upper-middle range (approximately 0.3–0.7), with the red dashed line indicating the main distribution range. In contrast, the distribution of Grade 12 is slightly shifted towards the high participation area, and there is a more obvious tail in the high value range (>0.8), indicating that older students exhibit a more stable and higher level of participation in the classroom. The lower part further analyzes the proportions using the discretized participation levels (low, medium, high). For Grade 08, participation was mainly at a medium level (56.7%), with high participation at 25.4% and low participation at 17.9%. In Grade 12, while the proportion of medium participation slightly decreased (52.2%), the proportion of high participation significantly increased to 37.7%, while the proportion of low participation decreased to 10.1%. This trend indicates that as students progress through the learning stages, their overall participation level improves, and low-participation behaviors decrease significantly.
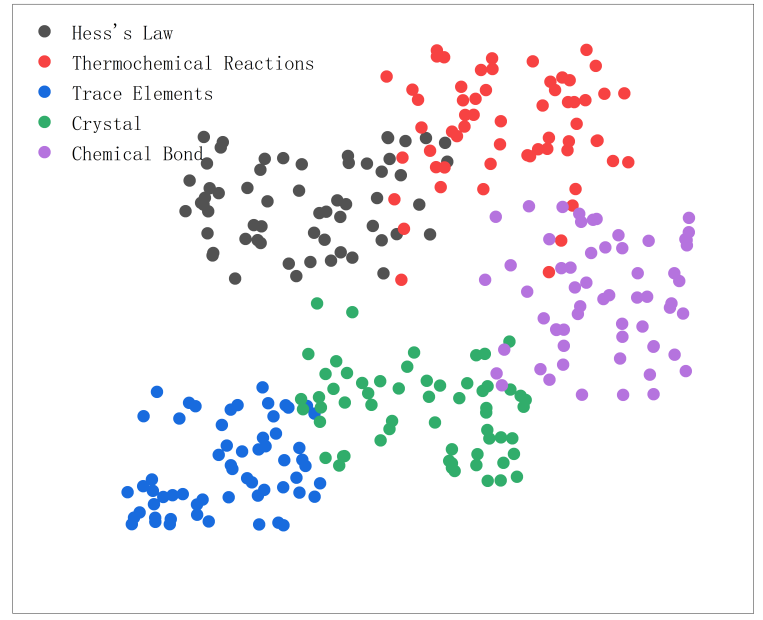
As shown in Figure 14, this paper visualizes and analyzes the multimodal feature representations output by the fusion model. Different colors correspond to different knowledge concept categories (such as Hess’s law, thermochemical reactions, trace elements, crystal structures, and chemical bonds). It can be observed that the samples of each category exhibit a relatively clear clustering structure in the embedding space, with obvious boundary separation between different knowledge concepts. This indicates that the multimodal representations learned in this paper possess good discriminative ability. In contrast, some similar concepts (such as Hess’s law and thermochemical reactions) show a certain degree of proximity distribution in the space, which is consistent with their correlation in the knowledge system. This shows that the model can not only distinguish different categories but also preserve the structural relationships between concepts at the semantic level. Combined with the multimodal fusion framework proposed in this paper, this result further verifies the effectiveness of cross-modal attention and temporal modeling in feature learning. Visual behavioral features, textual semantic information, and knowledge structure information are effectively aligned in a unified embedding space, enabling the model to extract high-level representations with semantic consistency from multi-source data.
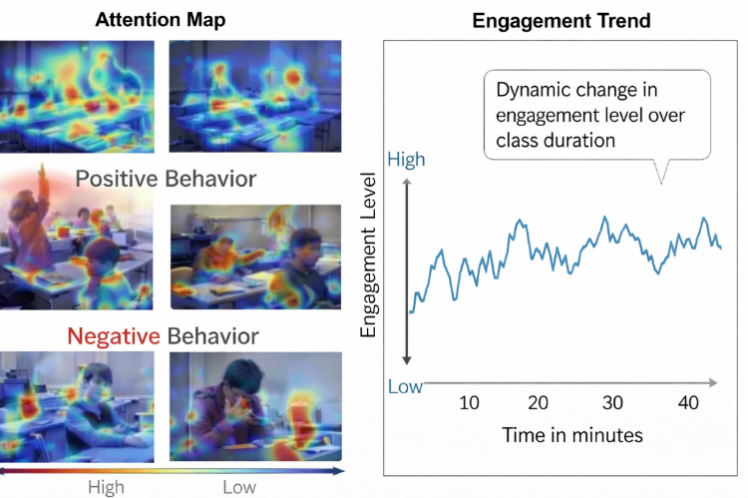
As shown in Figure 15, this paper visualizes and analyzes the model output from two aspects: attention distribution and temporal changes in participation, to verify the interpretability of the proposed multimodal fusion model in behavioral understanding and teaching effectiveness evaluation. The left side shows the attention heatmap results, which observes that the model significantly focuses on representative behavioral areas in the classroom setting. Positive behaviors such as raising hands, taking notes, and attentive listening show high-intensity responses, while negative behaviors such as looking down, distraction, and using mobile phones are also effectively identified and assigned high weights. This indicates that the model can automatically extract features crucial for participation determination from visual behavior and semantic information through a cross-modal attention mechanism. The right side shows the dynamic curve of participation changing over class time. It can be seen that participation fluctuates in stages throughout the teaching process, showing a significant upward trend during interactive or focused explanation phases, while slightly decreasing during content-intensive or distracted phases. This dynamic change is highly consistent with the real classroom teaching patterns, indicating that the proposed model can effectively capture the temporal evolution characteristics of student participation.
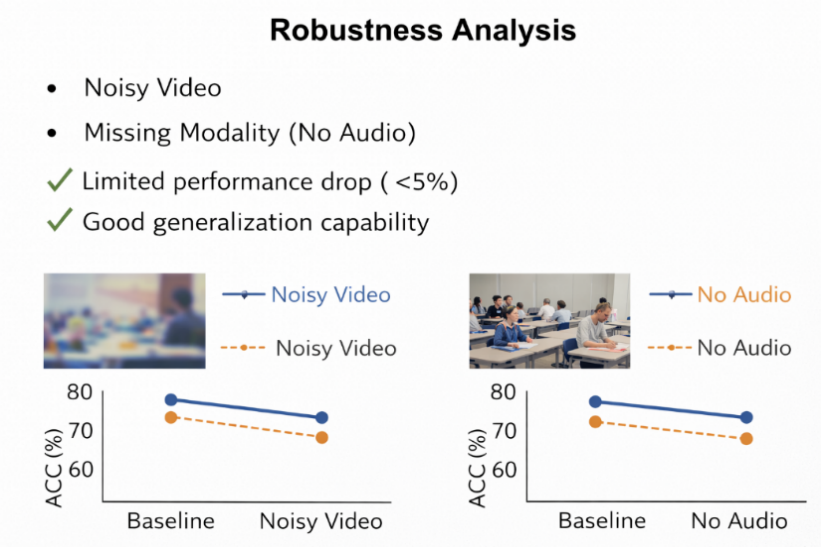
As shown in Figure 16, this paper validates the robustness of the model under two typical complex scenarios: noisy video input and modality missing (no audio) conditions. The results on the left show the trend of model performance changes when the video has noise interference (such as blur, compression distortion, or illumination changes). It can be observed that compared with the baseline input, the model accuracy only decreases slightly, and the overall performance remains stable. This indicates that the multimodal fusion mechanism proposed in this paper can effectively mitigate the impact of visual signal degradation. The results on the right further analyze the performance when the audio modality is missing. It can be seen that the model can still maintain a high accuracy level, with only a limited performance decrease.
This paper addresses the problem of evaluating teaching effectiveness in smart classroom environments by proposing a unified modeling framework based on multimodal data fusion. By integrating multi-source information such as video, audio, logs, and text, this paper constructs a hierarchical mapping relationship from low-level behavioral features to high-level teaching effectiveness, effectively overcoming the shortcomings of traditional evaluation methods that rely on a single data source and lack process modeling. Methodologically, this paper designs a fusion model based on a cross-modal attention mechanism to achieve semantic alignment between heterogeneous modalities and introduces a temporal modeling module to characterize the dynamic changes in classroom behavior. Simultaneously, through behavioral cue-driven engagement modeling, multimodal features are mapped to three dimensions: behavior, emotion, and cognition, thereby improving the model’s semantic expressiveness and interpretability. In the experimental section, this paper conducts a systematic evaluation based on a constructed smart classroom multimodal dataset. The results show that the proposed method improves accuracy and F1-score by approximately 13% compared to single-modal methods and by approximately 5% compared to mainstream multimodal Transformer models, while reducing RMSE by approximately 20%. Ablation experiments further validated the effectiveness of the cross-modal attention, temporal modeling, and behavioral modeling modules, while modal contribution analysis showed that information from different modalities has a significant complementary effect in engagement modeling.
This study used fully anonymized secondary data collected from smart classroom activities. According to the policy of Weinan Normal University, formal ethics approval was not required / was waived for this type of study. The research was conducted in accordance with relevant institutional guidelines and regulations.
Not applicable
The author declares no competing interests.
There is no specific funding to support this research.
The experimental data used to support the findings of this study are available from the author upon request.