inear algebra serves as the fundamental knowledge and vital mathematical toolset for university science and engineering students. It not only lays the groundwork for subsequent professional courses but also poses a challenge due to its highly abstract nature, often rendering the subject daunting for students. Consequently, as educators, it is imperative to innovate teaching methods, adopt more effective teaching modes, and devise strategies to enhance students’ comprehension of linear algebra’s theoretical foundations while fostering their ability to apply these concepts in practical contexts. This endeavor represents a crucial aspect of deepening the reform of the experimental teaching component within the linear algebra curriculum for engineering majors in higher education institutions and is a pertinent issue deserving of consideration by instructors within this field [1-4]. Historically, linear algebra instruction has been heavily tilted towards the exhaustive study of the course’s theoretical framework, with undue emphasis on mastering basic concepts and a neglect of practical applications. This approach, coupled with rigorous mathematical logic training and computationally intensive teaching methods, has often led to students perceiving the subject as dull and abstract, thereby diminishing their interest and enthusiasm for active learning [5-8]. However, in the 21st century, the advent of multimedia-assisted teaching technologies, particularly the integration of MATLAB mathematical software into linear algebra classrooms, has revolutionized the teaching landscape. This integration not only alleviates students from the burden of cumbersome and intricate mathematical computations but also enhances their understanding and mastery of the abstract concepts presented in textbooks.
In the mid-1970s of the last century, while instructing students in linear algebra, an American professor observed that students were expending excessive time on tedious calculations. Consequently, he developed an interface program for students, titled MATLAB, an acronym for Matrix Laboratory, signifying “matrix laboratory.” This is the origin story of the MATLAB application software [9-12]. Presently, MATLAB has emerged as an indispensable teaching tool in the foundational courses of science and technology majors at prominent universities globally. In the context of linear algebra education, MATLAB’s robust computational capabilities, straightforward programming language, and intuitive graphing features can be leveraged to visualize abstract concepts, streamline complex mathematical computations, deepen students’ comprehension of key ideas, stimulate their interest in linear algebra, and foster their autonomy in acquiring knowledge [13-18].
This paper discusses the method and effect of matlab software in the linear algebra course of university. In this paper, we present a method for visually representing experimental data and calculation results using a computer mathematical language within the MATLAB environment. This approach involves depicting implicit numerical relationships through curves, thereby facilitating the resolution of highly abstract mathematical problems. Through illustrative examples, we demonstrate the process of visualizing systems of linear equations, orthogonal transformations into quadratic forms, and positive (negative) definite quadratic forms using MATLAB. This visualization technique aids students in effectively comprehending and mastering the more intricate concepts, definitions, theorems, and corollaries in mathematics. Furthermore, we propose an experimental tiered teaching implementation plan for linear algebra and analyze its effectiveness by conducting a study with undergraduate students from College X, specifically grades 2021, 2022, and 2023, as the research participants.
Linear Algebra, a foundational mathematics course introduced as a stand-alone subject in 1996, encompasses a broad range of topics, including determinants, matrix-vector operations, eigenproblems in square matrices and linear spaces, similar diagonal matrices, real quadratic forms, and linear transformations. However, the subject is inherently abstract and axiomatic in nature, posing significant challenges for students. The traditional teaching approach, which emphasizes the formalization of the axiomatic system without sufficient integration of concepts, often leaves students struggling to grasp fundamental definitions and concepts, hindering their ability to solve proof-based problems. Consequently, students often experience frustration and disengagement. Moreover, the absence of intuitive teaching methodologies limits students’ ability to visualize linear spaces beyond abstract definitions and typical examples, impeding their comprehension of the essence of linearity and impeding the development of a diverse imagery of atypical linear spaces.
Students’ comprehension of vectors is often confined to the geometric intuition of “quantities possessing both magnitude and direction,” failing to abstract this concept to a broader mathematical context. Consequently, there exists a desire among students to delve deeper into the applications of this knowledge and to enhance the explanatory content and practical exercises. However, the matrix calculation course, which predominantly focuses on computational skills and examination performance, may inadvertently neglect the nurturing of mathematical thinking, potentially transforming students into mere problem-solving machines. Thus, the primary impetus and significance of this study lie in identifying a harmonious balance between the formalized, traditional teaching approach and the applied, problem-solving training that students aspire to. This balance aims to ignite students’ curiosity and motivation to explore knowledge, foster a deeper understanding of formal concepts, and encourage an appreciation of mathematical concepts and methodologies within the abstract realm of linear algebra.
Matlab is a high-efficiency, high-level programming language designed specifically for scientific and engineering calculations. Originating as a matrix laboratory, it initially offered an interface to matrix software packages such as LINPACK and EISPACK. Over time, Matlab has evolved into a comprehensive programming language for scientific computing, encompassing graphical interactive systems. Matlab excels not only in numerical computations but also in data visualization, providing powerful tools to create two-dimensional, three-dimensional, and even four-dimensional graphical representations of data. By manipulating graphical attributes such as elevation, color, rendering techniques, lighting, and viewpoints, Matlab enables users to fully showcase the characteristics of their data. In the context of teaching, Matlab’s visualization capabilities are particularly useful for helping students grasp the geometric meaning of concepts in linear algebra.
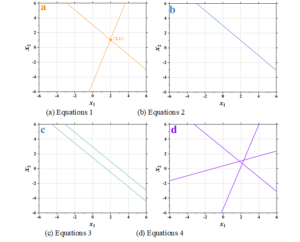
One of the primary challenges in teaching linear algebra lies in the non-intuitiveness of its concepts. To address this issue, visualization emerges as a powerful tool that can impart an intuitive understanding of certain concepts, thereby facilitating comprehension. As an illustrative example, consider the following system of four linear equations. By applying the method of solving the system through elementary transformations, the obtained results are presented as follows:
Example 1. \[\label{GrindEQ__1_} \left\{\begin{array}{l} {x_{1} +x_{2} =3}, \\ {3x_{1} +x_{2} =5}. \end{array}\right. \tag{1}\]
Example 2. \[\label{GrindEQ__2_} \left\{\begin{array}{l} {x_{1} +x_{2} =3}, \\ {3x_{1} +3x_{2} =9}. \end{array}\right. \tag{2}\]
Example 3. \[\label{GrindEQ__3_} \left\{\begin{array}{l} {x_{1} +x_{2} =3}, \\ {x_{1} +x_{2} =5}. \end{array}\right. \tag{3}\]
Example 4. \[\label{GrindEQ__4_} \left\{\begin{array}{l} {x_{1} -3x_{2} =-1}, \\ {x_{1} +x_{2} =3}, \\ {3x_{1} -x_{2} =6}. \end{array}\right. \tag{4}\]
The two-dimensional graphs of the four systems of equations are drawn as shown in Figure 1, where Figures 1 (a) to (d) correspond to the systems of equations 1 to 4. From the results of the runs, it can be seen that system of equations 1 has a solution of \(\left\{\begin{array}{l} {x_{1} =2} \\ {x_{2} =1} \end{array}\right.\), system of equations 2 has a nondigital set of solutions, system of equations 3 has no solution, and system of equations 4 has no solution. Correspondingly, it can be visualized that system of equations 1 is the intersection of two straight lines and has only one intersection, so the system of equations has a unique solution. The two lines of system of equations 2 coincide exactly, so system of equations 2 has no number of solutions. The two lines of system of equations 3 are parallel and have no intersection, so system of equations 3 has no solution. The three lines in System of Equations 4 do not share a common line, so there is no common solution, i.e., the system of equations in System of Equations 4 is also unsolved.
Example 5. Use orthogonal transformations to reduce a quadratic form, \(f(x,y)=x^{2} -8xy-5y^{2}\), to a standard form.
Let \(f(x,y)=10\), then the quadratic type becomes a quadratic curve \(x^{2} -8xy-5y^{2} =10\) and the graph is plotted in [-10,10] using Matlab 2D graphing statement \({\rm ezplpot(}x{\rm \wedge }2-8*x*y-5*y{\rm \wedge }2{\rm )=10}\). Use orthogonal transformations \(P=\left[\begin{array}{l} {2/\sqrt{5} {\kern 1pt} {\kern 1pt} {\kern 1pt} {\kern 1pt} {\kern 1pt} {\kern 1pt} {\kern 1pt} {\kern 1pt} {\kern 1pt} {\kern 1pt} {\kern 1pt} {\kern 1pt} {\kern 1pt} {\kern 1pt} {\kern 1pt} 1/\sqrt{5} {\kern 1pt} } \\ {-1/\sqrt{5} {\kern 1pt} {\kern 1pt} {\kern 1pt} {\kern 1pt} {\kern 1pt} {\kern 1pt} {\kern 1pt} {\kern 1pt} {\kern 1pt} 2/\sqrt{5} } \end{array}\right]\) to reduce the original quadratic curve to a standard type \(3x^{2} -7y^{2} =10\), and plot the graph in the same way. The two quadratic curves are plotted together to obtain the hyperbola before and after rotation as shown in Figure 2. It can be seen that the geometry of the quadratic curves is maintained as a 1:1 ratio by the orthogonal transformations, which is the meaning of orthogonal transformations.

The textbook Linear Algebra describes the definition of positive (negative) definite quadratic forms in this way:
Given that the quadratic forms \(fx)=x^{T} Ax\), \(A\) are symmetric matrices, \(f\left(x\right)\) is said to be a positive/negative definite quadratic form if for any \(x\ne 0\), there is \(f\left(x\right)>0\)/\((f\left(x\right){\rm <}0)\). This description of positive/negative definite quadratic forms from an algebraic point of view is more abstract to understand, if with the help of visualization, the use of graphical presentations to see intuitively, which helps to understand the concept.
Example 6. Plotting positive definite quadratic forms using MATLAB 3D graphical statements: \[\label{GrindEQ__5_} f\left(x,y\right)=5x^{2} +8y^{2}. \tag{5}\]
Using MATLAB 3D graphing statements, \(\left[x,y\right]={\rm meshgrid}\left(-8:0.2:6,-6:0.2:6\right)\), \(z=5*x\wedge 2+8y\wedge 2\), \({\rm mesh}(xyz)\), the 3D image of the positive definite quadratic form is plotted as shown in Figure 3. It can be seen that the positive definite quadratic form \(5x^{2} +8y^{2} {\rm >}0\) when \((xy)=0\).

Similarly, the 3D function image of the negative definite quadratic \(f(xy)=-5x^{2} -8y^{2}\) is plotted using MATLAB 3D graphical statements as shown in Fig. 4. It can be seen that the negative definite quadratic form \(-5x^{2} -8y^{2} {\rm <}0\) when \(\left(x,y\right)=0\).

The image of the 3D function of the indeterminate quadratic \(f\left(x,y\right)=5x^{2} -8y^{2}\) is plotted using MATLAB 3D graphical statements as shown in Fig. 5. It can be seen that the indefinite quadratic \(5x^{2} -8y^{2} {\rm >0}\) or \(5x^{2} -8y^{2} {\rm <0}\) when \(\left(x,y\right)=0\).

By using the MATLAB visualization effect, a clear perception of the concept of positive (negative) definite quadratic forms can be made.
In light of the inherent differences among students, reforming traditional teaching methodologies is imperative to foster more conscious learning, augment students’ interest and self-confidence in academic pursuits, and fundamentally alleviate their apprehension towards mathematics, thereby mitigating learning obstacles. Linear algebra hierarchical teaching constitutes a pivotal aspect of mathematics education reform, adhering to the principles of human cognition, acknowledging students’ cognitive disparities, and implementing tailored instruction at varying levels. By grounding our approach in the holistic development of all students, we establish differentiated teaching objectives, curate tailored content, and innovate instructional modalities, endeavoring to ensure that each student discovers an optimal learning pathway. This endeavor aims to optimize both teaching efficacy and student learning outcomes.
In the context of linear algebra, layered teaching adopts a student-centric approach, where students are categorized into distinct levels based on their mathematical foundation, interests, and cognitive ability disparities. This stratification enables the implementation of tailored teaching strategies for each level, ensuring that appropriate instructional measures are adopted. Furthermore, it facilitates the provision of differentiated counseling, question-and-answer sessions, and the development of level-specific assessment mechanisms. Consequently, students are empowered to acquire knowledge in accordance with their individual learning styles and pace.
Therefore, this paper proposes a hierarchical teaching model for linear algebra, which primarily focuses on four aspects: student stratification, teaching stratification, counseling stratification, and assessment stratification.
Students are categorized into three levels: A, B, and C. Typically, students assigned to the C level exhibit a poor mathematical foundation, weak independent learning abilities, low interest in mathematics, and a tendency to view this course solely as a means to pass the final exam. These students have minimal demands beyond passing the linear algebra exam. Conversely, students in the A level possess a solid foundation in mathematics, strong comprehension skills, and a motivation to study the course for purposes such as graduate school admission or career advancement. Consequently, students in this level have higher aspirations and expectations for their performance in linear algebra. The remaining students are categorized into the B level. While they possess the potential to achieve good results through their own efforts, these students may encounter learning difficulties that hinder their progress and require additional support. Nonetheless, they exhibit significant potential for improvement and excavation.
For students in Tier A, heuristic teaching centered on problem-solving methodologies should be consistently applied in the educational process. For students in Tier B, teaching requirements should be adjusted to a more manageable level, with a curriculum that is firmly grounded in the textbook content. The pace of instruction should be moderated to ensure comprehension, and efforts should be directed towards enhancing classroom efficiency. In contrast, the requirements for students in Tier C are relatively less stringent, and the syllabus is tailored to the personnel training program of each respective discipline, with a primary focus on fostering the students’ foundational knowledge and basic competencies.
To cater to the varying levels of students, appropriate counseling content should be devised. For students in Level A, emphasis should be placed on enhancing their understanding of the underlying concepts and mastery of the knowledge structure. For students in Level B, efforts should be made to build upon their existing foundation and practical abilities, while ensuring moderation in the pace and depth of instruction. Lastly, for students in Level C, the focus should remain on adhering to the syllabus and its practical applications, with a reduced emphasis on theoretical aspects and a heightened focus on procedural steps and hands-on practice.
The assessment should adopt a multifaceted approach, encompassing various types, methods, and frequencies. In particular, in-class activities such as questioning, speeches, student responses, tutorial participation, peer assistance, and homework completion status should serve as essential reference indicators. Additionally, it is crucial to evaluate students’ learning attitudes. The final examination is structured in a tiered manner, providing different sets of papers tailored to each student’s level, yet ensuring a uniform level of difficulty across all tiers.
Drawing upon the aforementioned concepts, this paper endeavors to elucidate the geometric interpretation of algebraic notions utilizing MATLAB, with the ultimate aim of assisting C-level students in grasping the fundamentals of linear algebra and enhancing their analytical prowess. By adopting a geometric perspective, these students can comprehend the abstract concepts of linear algebra more intuitively, thereby fostering their ability to tackle concrete geometrical problems through an abstract methodological lens. Below, we present two tailored teaching examples to illustrate this approach.
Example 7 (Geometric Demonstration of Linear Transformations). Linear transformations are one of the most important concepts in linear algebra, yet the abstract theory of matrix representations of linear algebra, and the relationship between matrices and the selection of bases in linear spaces are daunting to students. Even A-level students who have mastered the subject do not know where it is useful. Teaching in this paper using matlab to create an interactive courseware, the matrix representation of linear transformations is shown in Figure 6. Where is the transformation matrix for parameters \(a=1\), \(b=0\), \(c=0\), \(d=1\), when the matrix elements are randomly modified, you can instantly see the corresponding linear transformation effect. This demonstration aroused students’ strong interest and deepened their intuitive understanding of the concept of linear transformation.

Example 8 (Demonstration of dynamical system state trajectories using eigenvalues and eigenvectors). Consider a dynamical system \(u_{\left(k+1\right)} =Au_{k}\) described by differential equations, where A is a square matrix of order \(n\), \(k\) is a natural number, and the initial state \(u_{0}\) is known, and the equations give the evolution of a \(n\)-dimensional state vector \(u_{k}\) as \(k\) increases. The geometric interpretation of the solution is given by visualization, and the geometric description is used to complement the understanding of the algebraic operations. The evolutionary trajectory of the dynamical system is shown in Fig. 7, which shows the evolution of the trajectory of the \(\left[\begin{array}{l} {1.15{\kern 1pt} {\kern 1pt} {\kern 1pt} {\kern 1pt} {\kern 1pt} {\kern 1pt} {\kern 1pt} {\kern 1pt} {\kern 1pt} {\kern 1pt} {\kern 1pt} {\kern 1pt} {\kern 1pt} {\kern 1pt} {\kern 1pt} -1.15} \\ {-0.85{\kern 1pt} {\kern 1pt} {\kern 1pt} {\kern 1pt} {\kern 1pt} {\kern 1pt} {\kern 1pt} 1.15} \end{array}\right]\) matrix. It can be seen that in the dynamical system, the origin (0,0) is the attractor and saddle point, respectively, the eigenvalues determine the type of evolution, and the eigenvectors give the direction of trajectory approximation.

Through such dynamic demonstrations, C-level students can consolidate their understanding of important concepts such as eigenvalues and eigenvectors in linear algebra and gain a preliminary understanding of their applications, laying a foundation for future learning.
Following the implementation of tiered teaching for two consecutive semesters, as outlined in subsection 2.3, this study aims to evaluate its effectiveness by examining the undergraduate cohorts of 2021, 2022, and 2023 at College X. Notably, the Linear Algebra course for the 2021 cohort did not incorporate tiered teaching, whereas the 2022 and 2023 cohorts underwent tiered teaching according to the prescribed program. To assess the impact, we analyzed and compared the final examination scores both before and after the introduction of tiered teaching. Furthermore, we gauged students’ satisfaction with the tiered teaching mode through a combination of questionnaires and research methods.
| Grade | Total number | Average score | Rate of conformity ($$\ge 60$$)/% | Optimal rate ($$\ge 80$$)/% | |
| Class of 2021 | 1935 | 65.9371 | 59.0628 | 19.1301 | |
| Class of 2022 | Total | 2048 | 77.4349 | 73.3501 | 38.2419 |
| A | 691 | 80.0473 | 83.2374 | 54.3712 | |
| B | 937 | 78.0568 | 78.3359 | 50.2427 | |
| C | 420 | 69.1108 | 65.9067 | 26.0309 | |
| Class of 2023 | Total | 2106 | 79.6022 | 75.8564 | 40.2740 |
| A | 633 | 83.9552 | 84.0037 | 55.3683 | |
| B | 943 | 80.0374 | 75.2751 | 54.2445 | |
| C | 530 | 71.7515 | 66.3952 | 29.0837 | |
| Serial number | Survey stage | Survey content | N | Ratio |
| 1 | Pre-class preview | Can complete the preview task | 705 | 0.8813 |
| 2 | Pre-class preview | Can found the problem and make a mark | 684 | 0.8550 |
| 3 | Classroom instruction | You can focus on the content of the preview | 637 | 0.7963 |
| 4 | Classroom instruction | Be able to ask for a teacher’s help to solve the problem | 594 | 0.7425 |
| 5 | Classroom instruction | Can discuss the problem with the teacher | 588 | 0.7350 |
| 6 | Classroom instruction | Can apply computer to solve mathematical problems | 696 | 0.8700 |
| 7 | Review after class | You can summarize the focus of this section | 649 | 0.8113 |
| 8 | End of course | It is thought that stratified teaching can improve learning efficiency | 725 | 0.9063 |
Under the tiered teaching program, the final exam propositions are categorized into three distinct levels: A, B, and C. This approach, which aligns the content taught with the content tested, effectively mitigates potential unfairness in the examination process. The outcomes of the final exam paper score comparisons are presented in Table 1. The comparative analysis reveals that the average paper scores of students in Grade 2022, who underwent the first round of tiered teaching, have notably increased compared to those of Grade 2020, who did not receive tiered instruction. Specifically, the mean score improved by 11.4978 points, the passing rate rose by 14.2873 percentage points, and the proportion of students achieving good grades increased by 19.1118 percentage points. Furthermore, the improvements observed in Grade 2023, who underwent the second round of tiered teaching, were even more pronounced. Compared to Grade 2020, the mean score, passing rate, and proportion of good grades in Grade 2023 increased by 13.6651 points, 16.7936%, and 21.1439%, respectively.
Despite the observed increase in achievement across all three programs, a notable issue persists that warrants attention: the minimal changes in the academic performance of Tier C students, as measured by their average grade point average, passing rate, and excellence rate. Specifically, the average score of Tier C students in Grade 2022, when compared to Grade 2021, showed a modest improvement of merely 3.1737 points, accompanied by a 6.8439 percentage point increase in the passing rate and a 6.9008 percentage point increase in the excellence rate. While Grade 2023 continued to exhibit an upward trend relative to Grade 2021, the implementation of the program for Tier C students appears to have been less effective than that for Tier A and Tier B students.
After implementing two iterations of the layered teaching approach in linear algebra, a satisfaction survey was conducted among students of College X, specifically targeting classes 2022 and 2023, utilizing a questionnaire as the primary data collection tool. The questionnaire was structured to encompass four distinct phases: pre-class preparation, classroom instruction, post-class review, and end-of-course evaluation. A total of 800 questionnaires were disseminated, with 754 valid responses received, representing a robust response rate. The detailed findings of this survey are presented in Table 2. Based on a thorough analysis of the survey data, coupled with subsequent communication and research efforts with the students, the following conclusions can be inferred:
0.8813 of the students were able to complete pre-class pre-study in accordance with the tiered teaching program, thus making classroom listening more efficient.
0.7350 students were able to think that the classroom teaching was more effective after the classification, and they agreed with the role of the math lab, and they thought that through the math lab they were more able to actively discuss the problems with the teacher, and understand the relationship between the knowledge and the integration in a more in-depth way.
0.8113 of the students would sort out the key points and typical problem solving techniques before finishing their homework, so that they could finish their homework with high quality.
The percentage of those who are in favor of layered teaching is 0.9063, and they think that layered teaching can fully mobilize students’ initiative and motivation in learning linear algebra.
It can be seen that the tiered teaching program can, to a certain extent, enhance students’ interest in learning linear algebra courses and learning efficiency, and can effectively reduce the burden of students learning linear algebra.
In this paper, a series of mathematical experiments integrated with real-life applications have been meticulously designed, adhering to the requirements of university mathematics hierarchical teaching and the principles governing the selection of linear algebra teaching content. Additionally, MATLAB software has been utilized to visualize abstract mathematical concepts and theorems, thereby enhancing their comprehensibility. The empirical outcomes indicate that the implementation of this program led to a remarkable increase in the average score of linear algebra examinations, with a peak improvement of 13.6651 points. Furthermore, an overwhelming 90.63% of students expressed their favor and approval towards this approach. This underscores the effectiveness of the program in empowering students to not only grasp theoretical mathematical methods but also nurture their modeling skills, learn MATLAB software application, and ignite their passion for mathematics. Importantly, the hierarchical structure of the program ensures that students with diverse mathematical backgrounds can achieve growth and progress throughout the course.
In this paper, we report on a preliminary attempt to integrate mathematical experiments into the hierarchical teaching of linear algebra, which has been implemented in a select few classes. Currently, this endeavor remains in its nascent stage, necessitating the gradual accumulation of extensive teaching experience over multiple iterations and further refinement through subsequent cycles of improvement and evaluation.
This research was supported by Heilongjiang Education Science “14th Five-Year Plan” 2023 important project”: Exploration and Practice of Student-Centered First-class Advanced Mathematics Curriculum Construction” (Project number: GJB1423088).


