The study of the topological indices on the chemical structure of chemical materials and drugs can make up for the lack of chemical experiments and can provide a theoretical basis for the manufacturing of drugs and chemical materials. These results remedy the lack of chemical and medical experiments by providing the theoretical basis for pharmaceutical engineering. Determining the chemical properties of new drugs requires a large number of chemical experiments, thereby greatly increasing the workload of chemical and pharmaceutical researchers. The chemical-based experiments found that there was a strong connection between topological molecular structures and their physical behaviours, chemical characteristics, biological features, and toxicity of drugs.
The human body is made up of trillions of cells that grow and divide as needed throughout a lifetime before dying when they get old or aberrant. Cancer is a disease that occurs when one or more cells lose their ability to control their growth, which can result in haematological malignancies or solid masses of cells known as tumours. If the old or aberrant cells do not die, cancer develops as the cells continue to produce new cells [1]. These cancer cells grow out of control, crowding out healthy cells and causing the body to malfunction. Cancer-causing agents are known as carcinogens. Tobacco smoke contains carcinogens which are chemical substances that cause cancer. It can spread throughout the body.
Global Cancer Observatory (GLOBOCAN) predictions for 2020 state that there were 19.3 million incident cases of cancer worldwide. India placed in third place, after the US and China. According to GLOBOCAN’s prediction, the number of cases of cancer in India is projected to grow to 2.08 million by 2040, reflecting a 57.7% increase from 2020.
An anticancer drug, also called an antineoplastic drug, is any drug that is effective in the treatment of malignant, or cancerous, disease. There are several major classes of anticancer drugs; these include alkylating agents, antimetabolites, natural products, and hormones. Most anticancer drugs are administered intravenously, but some can be taken orally and others can be injected intramuscularly or intrathecally (within the spinal cord) [2].
An alkylating drug called carmustine is used to treat many cancers, including multiple myeloma and brain tumours. It functions by reducing or halting the proliferation of cancer cells. One class of medication used to prevent breast cancer is referred to as a selective oestrogen receptor modulator (SERM), and it is raloxifene. It can inhibit the hormone oestrogen. Podophyllum peltatum is the source of podophyllotoxin, a well-known naturally occurring aryltetralin lignans that is utilised as a chemotherapeutic treatment for a range of malignancies. An anthracycline antibiotic called daunorubicin is mostly used to treat leukaemias, namely acute myeloid leukaemia (AML).
The specificity of anticancer drugs plays an important role in reducing the severity of side effects associated with the drugs. Indeed, because cancer cells are similar to normal human cells and can cause numerous side effects, some of which are life-threatening.
Shanmukha et al. [3] computed some degree-based topological indices for anticancer drugs and presented QSAR analysis of their computations. Bokhary et al. [4] performed a QSPR analysis of drugs used for the treatment of breast cancer. Zaman et al. [5] made of some degree-based topological indices and regression models in the QSPR analysis of certain drugs used in the treatment of blood cancer. Miladiyah et al.[6] Investigated anti-cancer properties of xanthone derivatives. Dhanajayamurthy et al. [7] investigated QSPR analysis of anti-cancer drugs using some reduced neighbourhood degree-based topological indices. Havare [8] studied QSPR modelling of some drugs used in the treatment of cancer using recently introduced topological indices. Huang et al. [9] explored QSPR modelling of a set of new antiviral drugs for cancer treatment using topological indices. Zhang et al. [10] applied curve fitting models to analyze the physico-chemical properties of certain anti-cancer drugs using some degree-based indices.
The first, second, and third leap Zagreb indices were introduced in 2017 by Gutman et al. [11] and are defined as follows: \[\begin{aligned} ZC_1(G) = \sum\limits_{v \in V(G)}\tau(v)^2, \end{aligned}\] \[\begin{aligned} ZC_2(G) = \sum\limits_{uv \in E(G)}\tau(u)\tau(v), \end{aligned}\] \[\begin{aligned} ZC_3(G) = \sum\limits_{v \in V(G)}d_v\tau(v), \end{aligned}\] where \(\tau(v)\) represents the connection number of the vertex \(v\), (i.e.) the number of vertices that are at a distance two from \(v\) in \(G\). Further \(d_v\) represents the degree of a vertex \(v\) in \(G\). These indices are also known as Zagreb connection indices. Inspired by the F-index, in 2018, Kulli [12] presented the F-leap index as follows: \[\begin{aligned} FL(G) = \sum\limits_{v \in V(G)}\tau(v)^3. \end{aligned}\]
Reciprocal leap Zagreb indices of a graph are introduced in 2021 by Ammar Alsinai et al. [13]. \[\begin{aligned} RL_1(G) = \sum\limits_{v \in V(G)}\frac{1}{(\tau(v)+1)^2}, \end{aligned}\]
\[\begin{aligned} RL_2(G) = \sum\limits_{uv \in E(G)}\frac{1}{(\tau(u)+1)(\tau(v)+1)}, \end{aligned}\]
\[\begin{aligned} RL_3(G) = \sum\limits_{v \in V(G)}\frac{1}{d_v(\tau(v)+1)}. \end{aligned}\]
V.R. Kulli [14] introduced the first and second leap-hyper Zagreb indices in 2018 as \[\begin{aligned} HLM_1(G) = \sum\limits_{uv \in E(G)}[\tau(u)+\tau(v)]^2, \end{aligned}\] \[\begin{aligned} HLM_2(G) = \sum\limits_{uv \in E(G)}[\tau(u)\tau(v)]^2. \end{aligned}\]
For a few nanostructures, Basavanagoud and Chitra [15] subsequently computed the leap hyper-Zagreb indices. In 2019, Kulli et al. [16] computed the leap hyper-Zagreb indices for particular windmill graphs.
The geometric-arithmetic leap indices and sum connectivity indices of a graph are defined by Kulli [17] in 2019. They are described as \[\begin{aligned} SL(G) = \sum\limits_{uv \in E(G)}\frac{1}{\sqrt{\tau(u)+\tau(v)}}, \end{aligned}\] \[\begin{aligned} GAL(G) = \sum\limits_{uv \in E(G)}\frac{2\sqrt{\tau(u)\tau(v)}}{\tau(u)+\tau(v)}. \end{aligned}\]
In 2018, Kulli [18] introduced the Product connectivity leap index and atom bond connectivity (ABC) leap index, which are presented below. \[\begin{aligned} PL(G) = \sum\limits_{uv \in E(G)}\frac{1}{\sqrt{\tau(u)\tau(v)}}, \end{aligned}\] \[\begin{aligned} ABCL(G) = \sum\limits_{uv \in E(G)}\frac{\sqrt{\tau(u)+\tau(v)-2}}{\tau(u)\tau(v)}. \end{aligned}\]
Dayan et al. [20] formulated the first and second leap Gourava indices of graphs, which are influenced by Kulli’s [19] Gourava indices. Additionally, for a few wheel-related graphs, they calculated jump Gourava indexes in 2018. The aforementioned indices have the following definitions: \[\begin{aligned} LG_1(G) = \sum\limits_{uv \in E(G)}[\tau(u)+\tau(v)]+[\tau(u)\tau(v)], \end{aligned}\] \[\begin{aligned} LG_2(G) = \sum\limits_{uv \in E(G)}[\tau(u)+\tau(v)][\tau(u)\tau(v)]. \end{aligned}\]
The Sombor leap index was established in 2022 by Kulli [21] and is provided below: \[\begin{aligned} SOL(G) = \sum\limits_{uv \in E(G)}\sqrt{\tau(u)^2+\tau(v)^2}. \end{aligned}\]
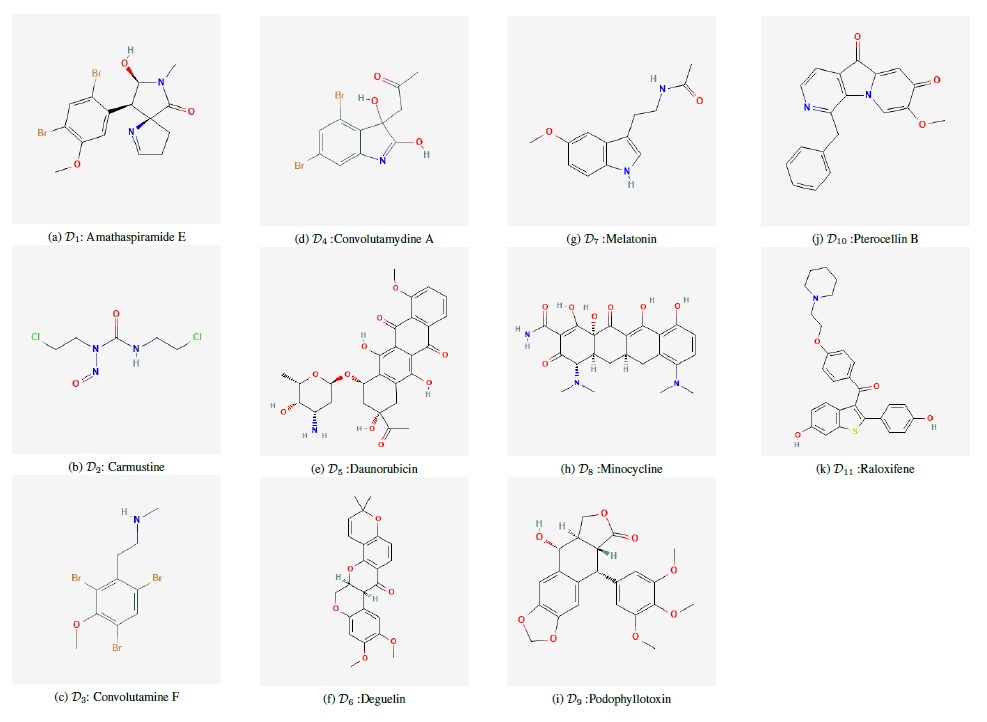
In this article, we compute the aforementioned 16 distance-based topological indices for the 11 anti-cancer drugs listed in Table 1 using vertex and edge partitions. Further, we conduct a thorough QSPR analysis to identify the best predictors for the physico-chemical properties: Molar Refractivity, Complexity, Molar Volume, Heavy Atom Count, Monoisotopic Mass and Topological Polar Surface Area of the chosen anti-cancer drugs.
| Drugs/Connection no. | \(1\) | \(2\) | \(3\) | \(4\) | \(5\) | \(6\) | \(7\) |
| Amathaspiramide (\(\mathcal{D}_1\)) | 1 | 8 | 2 | 7 | 2 | 1 | 1 |
| Carmustine (\(\mathcal{D}_2\)) | 5 | 3 | 3 | 1 | – | – | – |
| Convolutamine F (\(\mathcal{D}_3\)) | 3 | 5 | 3 | 2 | 2 | – | – |
| Convolutamydine A (\(\mathcal{D}_4\)) | 1 | 6 | 2 | 5 | 2 | – | 1 |
| Daunorubicin (\(\mathcal{D}_5\)) | 1 | 11 | 7 | 11 | 4 | 4 | – |
| Deguelin (\(\mathcal{D}_6\)) | 2 | 4 | 7 | 10 | 5 | 1 | – |
| Melatonin (\(\mathcal{D}_7\)) | 2 | 4 | 6 | 4 | 1 | – | – |
| Minocycline (\(\mathcal{D}_8\)) | – | 14 | 4 | 5 | 4 | 6 | – |
| Podophyllotoxin (\(\mathcal{D}_9\)) | 3 | 6 | 5 | 10 | 4 | 2 | – |
| Pterocellin B (\( \mathcal{D}_10\)) | 1 | 8 | 5 | 6 | 3 | 1 | – |
| Raloxifene (\(\mathcal{D}_11\)) | – | 9 | 16 | 6 | 2 | 1 | – |
This section deals with a QSPR analysis of the 11 anti-cancer drugs using linear regression model to predict the chosen physico-chemical properties via distance-based topological indices.
| \((\tau(u),\tau(v))\) | \(\mathcal{D}_1\) | \(\mathcal{D}_2\) | \(\mathcal{D}_3\) | \(\mathcal{D}_4\) | \(\mathcal{D}_5\) | \(\mathcal{D}_6\) | \(\mathcal{D}_7\) | \(\mathcal{D}_8\) | \(\mathcal{D}_9\) | \(\mathcal{D}_10\) | \(\mathcal{D}_11\) |
| (1,1) | – | 2 | 1 | – | – | – | – | – | – | – | – |
| (1,2) | 1 | 2 | 2 | 2 | 1 | 2 | 3 | – | 3 | 1 | – |
| (1,3) | – | 1 | – | – | – | – | 1 | – | – | – | – |
| (1,5) | – | – | – | 1 | – | – | – | – | – | – | – |
| (2,2) | 1 | – | – | 1 | – | – | 2 | 6 | – | 2 | 4 |
| (2,3) | 2 | 2 | 3 | 1 | 6 | 2 | – | 1 | 3 | 5 | 7 |
| (2,4) | 5 | 1 | 1 | 3 | 6 | 4 | 1 | 2 | 3 | 2 | 2 |
| (2,5) | 1 | – | 1 | – | – | 1 | – | 3 | 1 | – | – |
| (2,6) | – | – | – | – | – | – | – | 2 | – | – | – |
| \((\tau(u),\tau(v))\) | \(\mathcal{D}_1\) | \(\mathcal{D}_2\) | \(\mathcal{D}_3\) | \(\mathcal{D}_4\) | \(\mathcal{D}_5\) | \(\mathcal{D}_6\) | \(\mathcal{D}_7\) | \(\mathcal{D}_8\) | \(\mathcal{D}_9\) | \(\mathcal{D}_10\) | \(\mathcal{D}_11\) |
| (3,3) | – | 1 | – | – | – | 2 | 2 | 2 | 2 | 2 | 11 |
| (3,4) | 3 | 2 | 2 | 1 | 10 | 4 | 5 | – | 2 | 4 | 4 |
| (3,5) | 1 | – | 3 | 1 | 1 | 2 | – | 1 | 1 | 1 | 1 |
| (3,6) | – | – | – | – | – | – | – | 2 | 1 | – | – |
| (3,7) | – | – | – | 1 | – | – | – | – | – | – | – |
| (4,4) | 2 | – | – | 3 | 1 | 5 | 1 | 2 | 7 | 2 | 3 |
| (4,5) | 2 | – | 2 | 1 | 5 | 6 | 3 | 1 | 6 | 4 | 3 |
| (4,6) | 2 | – | – | – | 8 | 2 | – | 6 | 1 | 1 | 1 |
| (4,7) | 1 | – | – | 1 | – | – | – | – | – | – | – |
| (5,5) | – | – | – | 1 | 1 | 2 | – | 1 | 1 | 1 | – |
| (5,6) | 1 | – | – | – | 2 | 1 | – | 5 | 2 | 2 | 2 |
| (5,7) | 1 | – | – | 1 | – | – | – | – | – | – | – |
| (6,6) | – | – | – | – | 1 | – | – | 2 | 1 | – | – |
| (6,7) | 1 | – | – | – | – | – | – | – | – | – | – |
| \((deg(v),\tau(v))\) | \(D_1\) | \(D_2\) | \(D_3\) | \(D_4\) | \(D_5\) | \(D_6\) | \(D_7\) | \(D_8\) | \(D_9\) | \(D_10\) | \(D_11\) |
| (1,1) | 1 | 3 | 2 | – | 1 | 2 | 1 | – | 3 | 1 | – |
| (1,2) | 5 | 1 | 3 | 5 | 9 | 1 | 2 | 11 | 2 | 2 | 3 |
| (1,3) | – | – | – | 1 | 1 | 2 | – | 1 | – | – | – |
| (2,1) | – | 2 | 1 | – | – | – | – | – | – | – | – |
| (2,2) | 3 | 2 | 2 | – | 2 | 2 | 2 | – | 4 | 5 | 4 |
| (2,3) | – | 2 | 1 | – | 2 | 5 | 6 | 2 | 4 | 4 | 14 |
| (2,4) | 4 | – | 1 | 3 | 3 | 4 | 1 | 2 | 4 | 3 | 2 |
| (2,5) | – | – | – | 1 | 2 | 1 | – | – | – | – | – |
| (3,1) | – | – | – | 1 | – | – | 1 | – | – | – | – |
| (3,2) | – | – | – | 1 | – | – | – | 3 | – | – | 2 |
| (3,3) | 2 | 1 | 2 | 1 | 4 | – | – | 1 | 1 | 2 | 2 |
| (3,4) | 3 | 1 | 1 | 2 | 7 | 6 | 3 | 3 | 6 | 3 | 4 |
| (3,5) | 2 | – | 2 | – | 2 | 4 | 1 | 4 | 4 | 3 | 2 |
| (3,6) | – | – | – | – | 4 | 1 | – | 5 | 2 | 1 | 1 |
| (3,7) | 1 | – | – | 1 | – | – | – | – | – | – | – |
| (4,2) | – | – | – | – | – | 1 | – | – | – | – | – |
| (4,4) | – | – | – | – | 1 | – | – | – | – | – | – |
| (4,5) | – | – | – | 1 | – | – | – | – | – | – | – |
| (4,6) | 1 | – | – | – | – | – | – | 1 | – | – | – |
The experimental values of the physico-chemical properties for the 11 anti-cancer drugs are given in Table 5.
| Drugs | \(MR\) | \(C\) | \(MV\) | \(HAC\) | \(MM\) | \(TPSA\) |
| Amathaspiramide E | 89.4 | 489 | 233.9 | 22 | 429.953 | 62.1 |
| Carmustine | 46.6 | 156 | 146.4 | 12 | 213.007 | 61.8 |
| Convolutamine F | 73.8 | 194 | 220.1 | 15 | 398.847 | 21.3 |
| Convolutamydine A | 68.2 | 363 | 190 | 17 | 360.895 | 66.4 |
| Daunorubicin | 130 | 960 | 339.4 | 38 | 527.179 | 186 |
| Deguelin | 105.1 | 674 | 314.2 | 29 | 394.142 | 63.2 |
| Melatonin | 67.6 | 270 | 197.6 | 17 | 232.121 | 54.1 |
| Minocycline | 116 | 971 | 294.6 | 33 | 457.185 | 165 |
| Podophyllotoxin | 104.3 | 629 | 302.4 | 30 | 414.131 | 92.7 |
| Pterocellin B | 87.4 | 604 | 302.4 | 24 | 318.1 | 59.5 |
| Raloxifene | 136.6 | 655 | 367.3 | 34 | 473.166 | 98.2 |
The following table provides the values of the sixteen distance-based topological indices that are computed using the connection number-based vertex and edge partitions given in Tables 1 to 4.
| Drugs | \(ZC_1\) | \(ZC_2\) | \(ZC_3\) | \(FL\) | \(RL_1\) | \(RL_2\) | \(RL_3\) | \(HLM_1\) | \(HLM_2\) | \(PL\) | \(ABCL\) | \(SL\) | \(GAL\) | \(LG_1\) | \(LG_2\) | \(SOL\) |
| Amathaspiramide E | 298 | 374 | 184 | 1376 | 1.635478 | 1.31631 | 3.621825 | 1560 | 8306 | 2.554762 | 15.363634 | 9.053707 | 87.688739 | 558 | 3464 | 133.088933 |
| Carmustine | 60 | 62 | 50 | 174 | 1.810833 | 1.354167 | 3.066667 | 262 | 524 | 4.069444 | 6.309692 | 5.535767 | 23.490476 | 112 | 358 | 36.38872 |
| Convolutamine F | 132 | 150 | 92 | 502 | 1.628611 | 1.247222 | 3.152778 | 634 | 2044 | 3.191667 | 9.321324 | 6.472917 | 43.386508 | 242 | 1110 | 66.859408 |
| Convolutamydine A | 222 | 247 | 130 | 1016 | 1.312847 | 1.160972 | 2.877778 | 1054 | 4889 | 2.531071 | 11.835221 | 7.083061 | 60.480592 | 377 | 2188 | 94.977605 |
| Daunorubicin | 528 | 650 | 324 | 2346 | 2.542466 | 2.139376 | 5.951587 | 2684 | 12854 | 3.930278 | 26.657207 | 15.601287 | 156.300361 | 974 | 5724 | 233.071288 |
| Deguelin | 402 | 482 | 248 | 1704 | 1.941241 | 1.767063 | 4.028175 | 1984 | 8606 | 3.431389 | 20.989498 | 12.429736 | 119.925974 | 730 | 4048 | 178.181739 |
| Melatonin | 161 | 183 | 111 | 577 | 1.507222 | 1.373333 | 2.772222 | 753 | 2495 | 3.143056 | 12.007153 | 7.594599 | 53.442857 | 294 | 1334 | 79.905228 |
| Minocycline | 488 | 612 | 290 | 2336 | 2.239116 | 1.855737 | 5.479365 | 2568 | 13968 | 3.470556 | 22.751348 | 13.280368 | 137.571934 | 902 | 5816 | 210.133959 |
| Podophyllotoxin | 404 | 510 | 256 | 1758 | 2.281094 | 1.912313 | 4.534127 | 2094 | 9900 | 3.899722 | 21.553243 | 12.93474 | 124.040043 | 766 | 4438 | 183.755544 |
| Pterocellin B | 285 | 358 | 190 | 1175 | 1.79513 | 1.622857 | 3.380952 | 1464 | 6420 | 3.178889 | 17.448503 | 10.587741 | 92.617821 | 548 | 2974 | 136.010059 |
| Raloxifene | 362 | 428 | 248 | 1354 | 2.315964 | 2.386468 | 4.430952 | 1744 | 6480 | 4.484722 | 25.024903 | 15.283045 | 121.640043 | 676 | 3244 | 177.008376 |
The following table gives the calculated coefficient of determination (\(R^2\)) between distance-based indices and chosen physico-chemical properties of anti-cancer drugs using the linear regression model. The highest \(R^2\) values are highlighted in Table 7.
| Index/Property | \(MR\) | \(C\) | \(MV\) | \(HAC\) | \(MM\) | \(TPSA\) |
| \(ZC_1\) | 0.8079 | 0.9526 | 0.7106 | 0.9223 | 0.6652 | 0.6585 |
| \(ZC_2\) | 0.7892 | 0.9545 | 0.6992 | 0.9111 | 0.6512 | 0.6555 |
| \(ZC_3\) | 0.8675 | 0.9437 | 0.7926 | 0.9652 | 0.6632 | 0.6346 |
| \(FL\) | 0.7073 | 0.9413 | 0.5877 | 0.8379 | 0.6486 | 0.6800 |
| \(RL_1\) | 0.6787 | 0.6117 | 0.6176 | 0.7602 | 0.4221 | 0.6180 |
| \(RL_2\) | 0.8201 | 0.5817 | 0.8082 | 0.8203 | 0.3992 | 0.4619 |
| \(RL_3\) | 0.7278 | 0.8404 | 0.5591 | 0.8357 | 0.6382 | 0.8472 |
| \(HLM_1\) | 0.7782 | 0.9555 | 0.6809 | 0.9007 | 0.6548 | 0.6630 |
| \(HLM_2\) | 0.6325 | 0.9160 | 0.5079 | 0.7700 | 0.6051 | 0.6768 |
| \(PL\) | 0.2138 | 0.0826 | 0.2229 | 0.2210 | 0.0345 | 0.1666 |
| \(ABCL\) | 0.9433 | 0.8672 | 0.8960 | 0.9891 | 0.6268 | 0.5657 |
| \(SL\) | 0.9457 | 0.8276 | 0.9086 | 0.9849 | 0.5933 | 0.5639 |
| \(GAL\) | 0.8769 | 0.9362 | 0.8117 | 0.9716 | 0.6559 | 0.6217 |
| \(LG_1\) | 0.8162 | 0.9543 | 0.7305 | 0.9312 | 0.6572 | 0.6510 |
| \(LG_2\) | 0.7020 | 0.9425 | 0.5909 | 0.8366 | 0.6310 | 0.6739 |
| \(SOL\) | 0.8627 | 0.9466 | 0.7835 | 0.9617 | 0.6663 | 0.6402 |
The model Equations (1) to (5) are helpful in identifying the best predictors among the sixteen molecular descriptors considered for this study. \[\label{lmr} MR=7.599208(SL)+13.41353, \tag{1}\] \[\label{lc} C=0.345844(HLM_1)+14.04273, \tag{2}\] \[\label{lmv} MV=18.61086(SL)+68.37292, \tag{3}\] \[\label{lhac} HAC=1.286284(ABCL)+2.505058, \tag{4}\] \[\label{ltpsa} TPSA=42.74069(RL_3)-83.6563. \tag{5}\]
| Property | Curve equation | Predictor | \(R^2\) | \(RMSE\) | \(p\)-value | \(F\)-Stat |
| \(MR\) | () | \(SL\) | 0.9457 | 6.905676 | 0.000001 | 156.634 |
| \(C\) | () | \(HLM_1\) | 0.9555 | 62.09998 | 0.000001 | 193.0803 |
| \(MV\) | () | \(SL\) | 0.9086 | 22.37583 | 0.000001 | 89.4822 |
| \(HAC\) | () | \(ABCL\) | 0.9891 | 0.961289 | 0.000001 | 816.0337 |
| \(TPSA\) | () | \(RL_3\) | 0.8472 | 20.34631 | 0.000059 | 49.89068 |
Figures 2–4 represent the graphics of the best predictive fits given in Table 8.
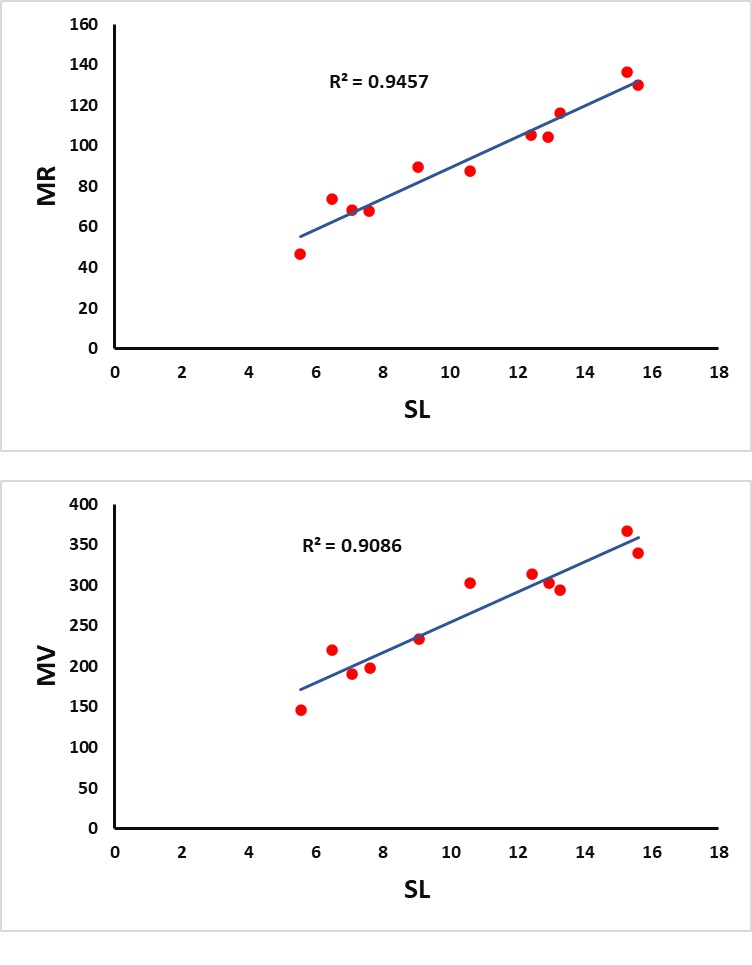
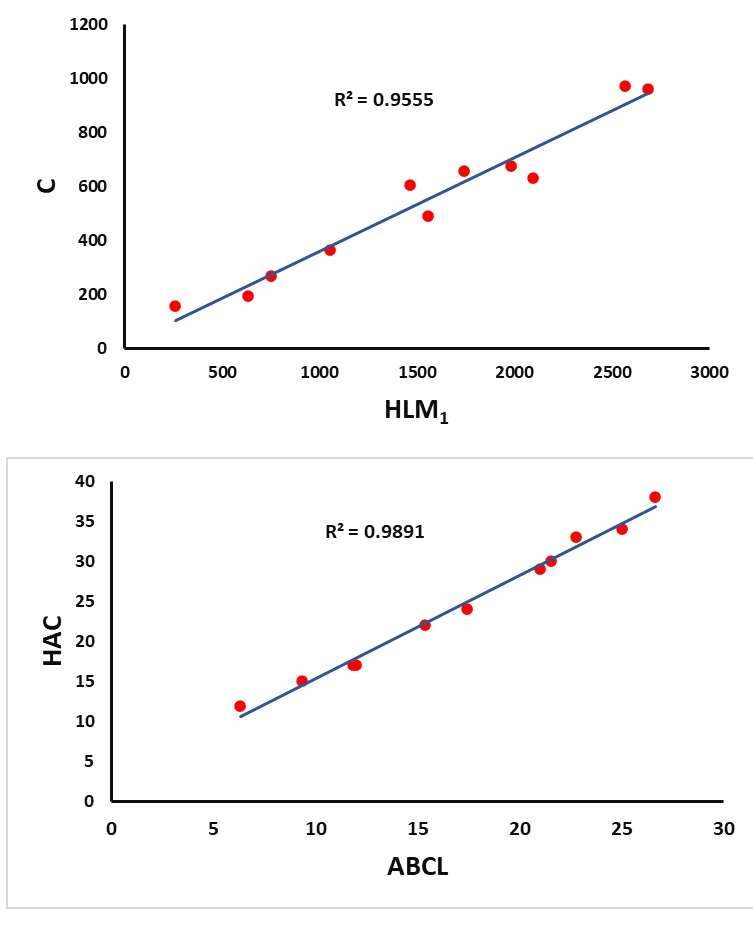

With the help of the summary given in Table 8, we observe that the index \(SL\) plays a major role in the better prediction of the properties \(MR\) and \(MV\) with \((R^2=0.9457,\; RMSE=6.905676)\) and \((R^2=0.9086,\; RMSE=22.37583)\) respectively at 5% level of significance. It is noted further that the index \(HLM_1\) is the best predictor for the property \(C\) with \(R^2=0.9555\) and \(RMSE=62.09998\). Furthermore, the index \(ABCL\) gives a better prediction of the property \(HAC\) with the highest \(R^2=0.9891\) and least \(RMSE=0.961289\) when compared to the other predictors. The index \(RL_3\) acts as the best predictor for the property \(TPSA\) with \(R^2=0.8472\) and \(RMSE=20.34631\).
Although the linear regression model helps to identify the best predictive fits for these five properties, it won’t address the property \(MM\). Therefore, we proceed with the Multiple linear regression model to search for the enhanced predictive ability of the selected indices against all six properties.
In this subsection, we carry out a QSPR study using a multiple linear regression model to cover the property \(MM\) that is not addressed by the linear regression model analyzed in the previous section.
The following are the model equations that provide the best predictors for all six properties. The summary of the best predictive fits resulting from this study is given in Table 9. \[\begin{aligned} \label{mmr} MR=&6.150771(ZC_2)+2.266407(HLM_1)\notag\\&+0.193652(HLM_2) -4.98034(LG_1)\notag\\&-1.26859(LG_2)-0.7021(ZC_1)\notag\\ &+{}6.509433(RL_3)+3.971167, \end{aligned} \tag{6}\] \[\label{mc} C=0.976849(LG_1)-6.4501, \tag{7}\] \[\begin{aligned} \label{mmv} MV=&-4.10859(ZC_1)-45.2008(ZC_2)\notag\\&-56.6554(RL_3) -0.24317(HLM_2)\notag\\&-58.316(ABCL)+28.43776(LG_1)\notag\\ &+{}1.58751(LG_2)-56.6554(RL_3)\notag\\&+114.7895, \end{aligned} \tag{8}\] \[\begin{aligned} \label{mhac} HAC=&0.256135(PCLI)+1.054287(ABC)\notag\\&+1.620144(RL_3)-0.76241, \end{aligned} \tag{9}\] \[\begin{aligned} \label{mmm} MM=&144.0558(ZC_2)+20.34892(HLM_1)\notag\\&+20.34892(HLM_2)-{}65.7588(LG_1)\notag\\&-15.9421(LG_2)-22.2702(ZC_1),\notag\\ &+{}3.77016(FL)+86.23568(RL_3)-102.2737, \end{aligned} \tag{10}\] \[\begin{aligned} \label{mtpsa} TPSA=&-3.75515(HLM_1)-0.35429(HLM_2)\notag\\&+53.90495(ABCL) +2.127128(LG_2)\notag\\&+0.4162(FL)+57.41319(RL_3)-121.426. \end{aligned} \tag{11}\]
| Property | Curve equation | \(R^2\) | Adj-\(R^2\) | \(RMSE\) | \(p\)-value | \(F\)-Stat |
| \(MR\) | () | 0.9999 | 0.9997 | 0.407216 | 0.000001 | 6804.363 |
| \(C\) | () | 0.9543 | 0.9492 | 62.92061 | 0.000001 | 187.8435 |
| \(MV\) | () | 0.9964 | 0.9878 | 7.74186 | 0.00119 | 117.0956 |
| \(HAC\) | () | 0.9997 | 0.9996 | 0.170596 | 0.000001 | 8708.619 |
| \(MM\) | () | 0.9982 | 0.9912 | 9.109898 | 0.00702 | 141.8294 |
| \(TPSA\) | () | 0.9860 | 0.9651 | 9.222352 | 0.001147 | 47.10643 |
From the summary given in Table 9, it is evident that all six physico-chemical properties of the selected anti-cancer drugs are better predicted using the multiple linear regression model with greater \(R^2\) and least \(RMSE\) when compared to the linear regression model.
QSPR analysis is one of the essential tools in predicting the physico-chemical properties of new drugs or a combination of drugs well before the wet lab experiments. This kind of study helps the pharmaceutical industry to minimize the cost while dealing with the design of new drugs to treat various diseases. In this study on anti-cancer drugs, we calculated sixteen recently introduced distance-based topological indices for eleven different drugs used in the treatment of various types of cancer. Also, we performed a QSPR analysis to identify the best predictors for six physico-chemical properties of these drugs using linear and multiple linear regression models. Our study revealed that the multiple linear regression model would give a better predictive ability than the linear regression model.


