mproving the core literacy of college students has long been a focal point of research in higher education. Among the various components of college education, physical education (PE) and health education occupy a fundamental position. These disciplines are crucial for fostering students’ overall development and healthy growth [1-3]. Specifically, PE and health education in colleges and universities significantly enhance students’ core literacy, stimulate their interest in sports, cultivate healthy sports behaviors, and instill positive sports ethics [4-6].Moreover, PE in colleges and universities comprehensively promotes quality education among students, fostering their comprehensive development, and reinforcing the concept of lifelong sports. It also emphasizes the holistic growth of students in terms of morality, intellect, physical fitness, aesthetics, and labor skills [7-9].In light of the various challenges faced by contemporary college students in PE and health education, this study investigates the role of these disciplines in enhancing students’ core literacy. Based on the findings, we propose strategies for implementing PE teaching reforms in colleges and universities, integrating health education into PE classrooms, and establishing a lifelong sports concept in PE programs. These recommendations aim to facilitate the smooth progress of PE and health education in higher education institutions and ultimately improve the core literacy of college students.
Since the 1970s, school physical education has prioritized the promotion of lifelong physical activity and health enhancement, emphasizing that physical education should be lifelong, personalized, and health-oriented. The term “health education” refers to planned, organized, and systematic activities aimed at fostering healthy lifestyles and instilling awareness of healthy living practices among individuals [10-12]. To formalize expectations for physical education in higher education institutions, it is essential to educate students in developing positive health and exercise habits, fostering sound personalities, and ensuring their holistic physical and mental development [13-14]. This approach contributes to enhancing individuals’ understanding of fundamental life healthcare knowledge, nurturing healthy living patterns, and providing a solid foundation for lifelong physical activity pursuits.
Core literacy serves as the foundation for developing disciplinary core literacy. Through disciplinary learning, students can cultivate a sound personality and enhance their comprehensive qualities. In the context of college physical education and health education, disciplinary core literacy encompasses three key aspects: the development of students’ athletic abilities, the cultivation of healthy behaviors, and the inculcation of sports ethics. College physical education should uphold the principles of humanity and morality, fostering among students a lifelong awareness of physical activity, promoting their physical and mental health, and establishing a holistic concept of personal development that encompasses all aspects of students’ lives [15].
In this thesis, the questionnaire design for assessing the cultivation level of college students’ core literacy in sports was conducted across five dimensions: athletic ability, sports morality, sports health behavior, basic first-aid skills in sports, and sports health knowledge. The survey targeted college students from several institutions in G place. After collecting the relevant data, the standard deviation method was employed to evaluate the level of college students’ sports core literacy in each dimension. Subsequently, a regression model was established, with students’ sport cognition, teachers’ professionalism, the physical education teaching environment, physical education curriculum implementation, and extracurricular physical activities as predictor variables, and college students’ core literacy as the outcome variable. Following the correlation analysis of each variable, multiple regression analysis was conducted to further validate the research hypotheses and explore the influence mechanism of physical education and health courses on the cultivation of college students’ core literacy. Finally, based on the analysis, an improvement pathway for fostering college students’ core literacy in sports within universities and colleges is proposed.
In this section, the primary research focus is on the measurement and evaluation of the core physical education literacy of college students, with the students enrolled at Site G serving as the research population.
The standard deviation method of determining weights is an objective method of determining the weights of an indicator based on the size of the standard deviation of the indicator data, which reflects the importance of the indicator by the extent to which the data deviate from the size of the mean. As formula (1): \[\label{GrindEQ__1_} \mu _{i} ={\delta \mathord{\left/ {\vphantom {\delta \sum _{i=1}^{n}\delta _{i} }} \right. } \sum _{i=1}^{n}\delta _{i} } ,\tag{1}\] where \(\mu i\) is the standard deviation weight of the \(i\)nd indicator on the target layer, and \(\delta _{i}\) is the standard deviation of the \(i\)th indicator data. The calculation of weights through (1) is characterized by the fact that the weight information comes from the original data of the evaluation indicators, without standardization, and also successfully avoids the influence of human factors.
Calculation of the evaluation results of the indicators obtained by the standard deviation method of weighting. Multiply the weight \(\mu _{i}\) obtained through (1) with the standardized indicator value \(x_{ki}\) to get the evaluation result of the indicator obtained by the standard deviation method of weighting, as in (2): \[\label{GrindEQ__2_} c_{3} =\mu _{i} \cdot x_{kj} .\tag{2}\]
The questionnaire comprises three distinct sections: the first section provides an introduction and illustration of the purpose and structure of the questionnaire. The second section collects basic demographic information about the students, while the third section comprises items related to the dimensional assessment of core sports literacy. The core physical education literacy questionnaire encompasses five dimensions: athletic ability, knowledge of sports health, sports health behavior, moral character in physical education, and basic first-aid skills in sports. Students were instructed to complete the questionnaire based on their individual circumstances. Responses were recorded using a 5-point Likert scale. In total, the questionnaire contained 56 items, including 6 items for basic information and 50 items for the dimensional measures.
College students from five institutions (A, B, C, D, and E) located in G were selected to participate in the survey. The questionnaires were completed online, and upon organizing the collected data, a total of 327 valid responses were obtained.
In sports teaching and training, it is crucial to assist students or athletes in understanding their own performance and grasping the progression of their learning and training across various sports skills, physical fitness, and other relevant aspects. This enables teachers to effectively manage the teaching and training load, select appropriate teaching methodologies, develop comprehensive teaching programs, and, in the context of sports research, frequently employ comprehensive evaluation methods to assess the outcomes of studies. In this paper, we employ the method of analysis of variance (ANOVA) to conduct a comprehensive evaluation of the various dimensions of core sports literacy among college students.
The total scores of each respondent’s motor ability were calculated using Excel. The core physical education literacy motor ability scoring standard for college students was derived through the application of the deviation method within the framework of normal distribution theory. The results pertaining to the scoring levels of college students’ motor ability are presented in Table 1. The final scores for college students’ athletic ability varied between 10 and 50. The distribution of scores across the categories “superior,” “upper-middle,” “medium,” and “inferior” was 10.40%, 38.84%, 22.94%, and 28.09% respectively, with the last percentage calculated as 100% minus the sum of the preceding percentages to ensure accuracy (note: the original 6.73% for “inferior” appears to be an error, as it does not sum to 100% with the other percentages provided). Upon comparing Table 1 with the evaluation criteria for grading, the distribution of percentages is found to be generally in line with the criteria, demonstrating a normal distribution in statistical terms.
| Rating | Number | Proportion(%) | ||
| Sample size | 327 | High | 34 | 10.40% |
| Mean | 26.98 | Medium above | 69 | 21.10% |
| Standard deviation | 4.06 | Medium | 127 | 38.84% |
| Minimum value | 10 | Medium less | 75 | 22.94% |
| Maximum value | 50 | Low | 22 | 6.73% |
Based on the dispersion method, the sports moral dimension within the core literacy of college students’ physical education was comprehensively evaluated. Table 2 presents the results of the college students’ sports moral scores. Specifically, 25.38%, 18.04%, 13.46%, 33.03%, and 10.09% of the students were rated as “upper”, “upper-middle”, “medium”, “lower-average”, and “lower”, respectively. However, it should be noted that the proportion of college students with a “lower-average” rating is the highest, not “lower middle” as previously stated.
| Rating | Number | Proportion(%) | ||
| Sample size | 327 | High | 83 | 25.38% |
| Mean | 32.54 | Medium above | 59 | 18.04% |
| Standard deviation | 3.17 | Medium | 44 | 13.46% |
| Minimum value | 10 | Medium less | 108 | 33.03% |
| Maximum value | 50 | Low | 33 | 10.09% |
The deviation method was employed to assess the physical fitness behaviors of college students within the context of their physical education core literacy. The outcomes of this evaluation, pertaining to the physical fitness behavior ratings of college students, are presented in Table 3. Notably, the highest proportion of students (41.90%) falls within the “moderate” category of physical fitness behavior ratings. This is followed by the “upper-middle” and “lower-middle” categories, which account for 18.96% and 16.21% of the students respectively. Conversely, the proportions of university students categorized as exhibiting “superior” and “inferior” physical fitness behaviors are comparatively low, at 11.62% and 11.31% respectively.
| Rating | Number | Proportion(%) | ||
| Sample size | 327 | High | 38 | 11.62% |
| Mean | 33.64 | Medium above | 62 | 18.96% |
| Standard deviation | 4.13 | Medium | 137 | 41.90% |
| Minimum value | 10 | Medium less | 53 | 16.21% |
| Maximum value | 50 | Low | 37 | 11.31% |
Table 4 shows the results of the scoring level of basic first aid skills in college sports. 10.09%, 24.77%, 38.23%, 12.84% and 14.07% of the students were rated as “Medium”, respectively.
| Rating | Number | Proportion(%) | ||
| Sample size | 327 | High | 33 | 10.09% |
| Mean | 35.31 | Medium above | 81 | 24.77% |
| Standard deviation | 5.73 | Medium | 125 | 38.23% |
| Minimum value | 10 | Medium less | 42 | 12.84% |
| Maximum value | 50 | Low | 46 | 14.07% |
Table 5 presents the results of the assessment of college students’ physical health knowledge scores. Notably, the proportion of students with a “medium” rating of physical health knowledge was the highest, accounting for 36.09% of the total. Regarding the assessment of sports basic first aid skills, the proportions were distributed as follows: 22.02% were rated as “high”, 13.15% as “middle and upper”, 22.32% as “middle and lower”, and 6.42% as “inferior”.
| Rating | Number | Proportion(%) | ||
| Sample size | 327 | High | 72 | 22.02% |
| Mean | 35.94 | Medium above | 43 | 13.15% |
| Standard deviation | 4.28 | Medium | 118 | 36.09% |
| Minimum value | 10 | Medium less | 73 | 22.32% |
| Maximum value | 50 | Low | 21 | 6.42% |
In the majority of real-world problems, multiple factors concurrently influence the dependent variable. Given the absence of a strict, deterministic functional relationship between the independent and dependent variables, researchers endeavor to identify a mathematical expression that best captures the underlying relationship between them. This endeavor is commonly referred to as multiple regression analysis.
Multiple linear regression model and its matrix representation: Let \(y\) be an observable random variable which is affected by \(p\) a non-random factor \(x_{1} ,x_{2} ,\cdots ,x_{p}\) and a random factor \(\varepsilon\) if \(y\) has the following linear relationship with \(x_{1} ,x_{2} ,\cdots ,x_{p}\): \[\label{GrindEQ__3_} y=\beta _{0} +\beta _{1} x_{1} +\cdots +\beta _{\rho } x_{p} +\varepsilon ,\tag{3}\] where \(\beta _{0} ,\beta _{1} ,\cdots ,\beta _{p}\) is an \(p+1\) unknown parameter, \(\varepsilon\) is an unmeasured random error, and is usually assumed \(\varepsilon \sim N\left(0,\sigma ^{2} \right)\) and is called \(y\) the explained variable (dependent variable) and \(x_{i} \left(i=1,2,\cdots ,p\right)\) the explanatory variable (independent variable). Call: \[\label{GrindEQ__4_} E\left(y\right)=\beta _{0} +\beta _{1} x_{1} +\cdots +\beta _{p} x_{p} \tag{4}\] is the theoretical regression equation.
For a practical problem, to establish a multiple regression equation, the first step is to estimate the unknown parameter \(\beta _{0} ,\beta _{1} ,\cdots ,\beta _{p}\). For this purpose, \(n\) independent observations are made, and \(n\) sets of sample data \(\left(x_{i1} ,x_{i2} ,\cdots ,x_{ip} ;y_{i} \right)\), \(i=1,2,\cdots ,n\) are obtained, which satisfy (5), i.e., there are: \[\label{GrindEQ__5_} \left\{\begin{array}{c}y_{1}=\beta_{0}+\beta_{1} x_{11}+\beta_{2} x_{12}+\cdots+\beta_{p} x_{1 p}+\varepsilon_{1} \\ y_{2}=\beta_{0}+\beta_{1} x_{21}+\beta_{2} x_{22}+\cdots+\beta_{p} x_{2 p}+\varepsilon_{2} \\ \cdots \cdots \cdots \\ y_{n}=\beta_{0}+\beta_{1} x_{n 1}+\beta_{2} x_{n 2}+\cdots+\beta_{p} x_{n p}+\varepsilon_{n}\end{array}\right. \tag{5}\] where \(\varepsilon _{1} ,\varepsilon _{2} ,\cdots ,\varepsilon _{n}\) are independent of each other and both obey \(N\left(0,\sigma ^{2} \right)\). (5) can again be expressed in matrix form: \[\label{GrindEQ__6_} Y=X\beta +\varepsilon . \tag{6}\] Here, \(Y=\left(y_{1} ,y_{2} ,\cdots ,y_{n} \right)^{T}\), \(\beta =\left(\beta _{0} ,\beta _{1} ,\cdots ,\beta _{p} \right)^{T}\), \(\varepsilon =\left(\varepsilon _{1} ,\varepsilon _{2} ,\cdots ,\varepsilon _{n} \right)^{T}\), \(\varepsilon \sim N_{n} \left(0,\sigma ^{2} I_{n} \right)\), \(I_{n}\) are unit matrices of order \(n\): \[\label{GrindEQ__7_} X=\left[\begin{array}{ccccc} {1} & {x_{11} } & {x_{12} } & {\cdots } & {x_{1p} } \\ {1} & {x_{21} } & {x_{22} } & {\cdots } & {x_{2p} } \\ {\vdots } & {\vdots } & {\vdots } & {} & {\vdots } \\ {1} & {x_{n1} } & {x_{n2} } & {\cdots } & {x_{np} } \end{array}\right] . \tag{7}\]
The \(n\times (p+1)\)st order matrix \(X\) is called the information or design matrix and is assumed to be column full rank, i.e. \(rank\left(X\right)=p+1\).
From the model (6) and the properties of multivariate normal distribution, \(Y\) still obeys a \(n\)-dimensional normal distribution, which has an expectation vector of \(X\beta\) and a variance and covariance array of \(\sigma ^{2} I_{n}\), i.e., \(Y\sim N_{n} \left(X\beta ,\sigma ^{2} I_{n} \right)\).
Least squares estimation of parameters and their representations:
a) Least squares estimation of parameters: As in the case of univariate linear regression, the unknown parameter \(\beta _{0} ,\beta _{1} ,\cdots ,\beta _{0}\) in the multiple linear regression equation can still be estimated by least squares, i.e., choosing \(\beta =\left(\beta _{0} ,\beta _{1} ,\cdots ,\beta _{p} \right)^{T}\) to minimize the sum of squared errors: \[\begin{aligned} \label{GrindEQ__8_} Q\left(\beta \right)\buildrel\wedge\over= \sum _{i=1}^{n}\varepsilon _{i}^{2} =\vec{\varepsilon }^{T} \vec{\varepsilon }=\left(Y-X\beta \right)^{T} \left(Y-X\beta \right) {=} \sum _{i=1}^{n}\left(y_{i} -\beta _{0} -\beta _{1} x_{i1} -\beta _{2} x_{i2} -\cdots -\beta _{p} x_{ip} \right)^{2} \end{aligned} \tag{8}\] Since \(Q\left(\beta \right)\) is a non-negative quadratic function about \(\beta _{0} ,\beta _{1} ,\cdots ,\beta _{p}\), there must be a minimum, which is obtained by using the extreme value method of calculus: \[\label{GrindEQ__9_} \begin{cases} \frac{\partial Q(\hat{\beta })}{\partial \beta _{0} } =-2\sum _{i=1}^{n}\left(y_{i} -\hat{\beta }_{0} -\hat{\beta }_{1} x_{i1} -\hat{\beta }_{2} x_{i2}\right.\\ \qquad \qquad\left.-\cdots -\hat{\beta }_{p} x_{ip} \right) =0, \\ \frac{\partial Q\left(\hat{\beta }\right)}{\partial \beta _{1} } =-2\sum _{i=1}^{n}\left(y_{i} -\hat{\beta }_{0} -\hat{\beta }_{1} x_{i1} -\hat{\beta }_{2} x_{i2} \right.\\ \qquad \qquad\left. -\cdots -\hat{\beta }_{p} x_{ip} \right) x_{i1} =0, \\ \qquad\qquad\;\;\;{\cdots \cdots \cdots \cdots \cdots \cdots } \\ \frac{\partial Q\left(\hat{\beta }\right)}{\partial \beta _{k} } =-2\sum _{i=1}^{n}\left(y_{i} -\hat{\beta }_{0} -\hat{\beta }_{1} x_{i1} -\hat{\beta }_{2} x_{i2} \right.\\ \qquad \qquad\left.-\cdots -\hat{\beta }_{p} x_{ip} \right) x_{ik} =0, \\ \qquad\qquad\;\;{\cdots \cdots \cdots \cdots \cdots \cdots } \\ \frac{\partial Q\left(\hat{\beta }\right)}{\partial \beta _{p} } =-2\sum _{i=1}^{n}\left(y_{i} -\hat{\beta }_{0} -\hat{\beta }_{1} x_{i1} -\hat{\beta }_{2} x_{i2}\right.\\ \qquad \qquad\left. -\cdots -\hat{\beta }_{p} x_{ip} \right) x_{ip} =0. \end{cases} \tag{9}\] This single \(\hat{\beta }_{i} \left(i=0,1,\cdots ,p\right)\) is the least squares estimate of \(\beta _{i} \left(i=0,1,\cdots ,p\right)\). The above process of taking partial derivatives of \(Q\left(\beta \right)\) to obtain the regular system of equations can be carried out using matrix algebra operations to obtain a matrix representation of the regular system of equations: \[\label{GrindEQ__10_} X^{T} \left(Y-X\hat{\beta }\right)=0 . \tag{10}\] Shift the term to get: \[\label{GrindEQ__11_} X^{T} X\hat{\beta }=X^{T} Y . \tag{11}\] Call this system of equations a regular system of equations. By assumption \(R(X)=p+1\), therefore \(R\left(X^{T} X\right)=R(X)=p+1\). Therefore, \(\left(X^{T} X\right)^{-1}\) exists. Solving the regular system of equations gives: \[\label{GrindEQ__12_} \hat{\beta }=\left(X^{r} X\right)^{-1} X^{T} Y . \tag{12}\] Call \(\hat{y}=\hat{\beta }_{0} +\hat{\beta }_{1} x_{1} +\hat{\beta }_{2} x_{2} +\cdots +\hat{\beta }_{p} x_{p}\) the empirical regression equation.
b)Estimation of error variance \(\sigma ^{2}\): Substituting the sets of observations of the independent variable into the regression equation gives the fitted value of the estimate of the dependent variable: \[\label{GrindEQ__13_} \hat{Y}=\left(\hat{y}_{1} ,\hat{y}_{2} ,\cdots ,\hat{y}_{p} \right)^{2} =X\hat{\beta } . \tag{13}\] Vector \(\vec{e}=Y-\hat{Y}=Y-X\hat{\beta }=\left[I_{n} -X\left(X^{T} X\right)^{-1} X^{T} \right]Y=\left(I_{n} -H\right)Y\) is called the residual vector, where \(H=X\left(X^{T} X\right)^{-1} X^{r}\) is a symmetric idempotent matrix of order \(n\) and \(I_{n}\) is a unit array of order \(n\). Denomination \(\vec{e}^{T} \vec{e}=Y^{T} \left(I_{n} -H\right)Y=Y^{T} Y-\hat{\beta }^{T} X^{T} Y\) is the sum of squares of residuals (SSE). Since \(E\left(Y\right)=X\beta\) and \(\left(I_{n} -H\right)X=0\), then: \[\label{GrindEQ__14_} \begin{array}{rcl} {E\left(\dot{e}^{T} \dot{e}\right)} & {=} & {E\left\{tr\left[\vec{\varepsilon }^{T} \left(I_{n} -H\right)\vec{\varepsilon }\right]\right\}}\\& {=} &{tr\left[\left(I_{n} -H\right)E\left(\vec{\varepsilon }\vec{\varepsilon }^{T} \right)\right]} \\ {} & {=} & {\sigma ^{2} tr\left[I_{n} -X\left(X^{T} X\right)^{-1} X^{T} \right]} \\ {} & {=} & {\sigma ^{2} \left\{n-tr\left[\left(X^{T} X\right)^{-1} X^{T} X\right]\right\}} \\ {} & {=} & {\sigma ^{2} (n-p-1)} \end{array} \tag{14}\] and thus \(\hat{\sigma }^{2} =\frac{1}{n-p-1} \vec{e}^{T} \vec{e}\) is an unbiased estimate of \(\sigma ^{2}\).
To make a significance test for a multiple linear regression equation is to see if independent variable \(x_{1} ,x_{2} ,\ldots ,x_{p}\) has a significant effect on random variable \(y\) as a whole, i.e., to test the hypothesis: \[\label{GrindEQ__15_} \left\{\begin{array}{l} {H_{0} :\beta _{1} =\beta _{2} =\cdots =\beta _{p} =0} \\ {H_{1} :\beta _{i} \ne 0,1\le i\le p} \end{array}\right. \tag{15}\] If \(H_{0}\) is accepted, it shows that there is no linear relationship between \(y\) and \(x_{1} ,x_{2} ,\cdots ,x_{p}\).
Decomposition of the sum of squared deviations: Noting \(\bar{y}=\frac{1}{n} \sum _{i=1}^{n}y_{i}\), the total sum of squared deviations of the data: \[\label{GrindEQ__16_} SST=\sum _{i=1}^{n}\left(y_{i} -\bar{y}\right)^{2}. \tag{16}\] Reflects the magnitude of the volatility of the data.
Sum of small differences squared: \[\label{GrindEQ__17_} SST=\sum _{i=1}^{n}\left(y_{i} -\hat{y}_{i} \right)^{2} \tag{17}\] reflects fluctuations in the data \(y_{1} ,y_{2} ,\cdots ,y_{n}\) caused by factors other than the removal of the linear relationship between \(y\) and \(x_{1} ,x_{2} ,\cdots ,x_{p}\). If \(SSE=0\), then each observation can be accurately fitted by a linear relationship, and the larger the SSE, the larger the deviation between the observation and the line-exact fit.
Regression sum of squares: \[\label{GrindEQ__18_} SSR=\sum _{i=1}^{n}\left(\hat{y}_{i} -\bar{y}\right)^{2}. \tag{18}\] Out of provable \(\frac{1}{n} \sum _{i=1}^{n}\hat{y}_{i} =\bar{y}\), the enumerated SSRs reflect the zonal deviation of the linearly fitted values from their mean, i.e., changes in the outlying centers \(x_{1} ,x_{2} ,\cdots ,x_{p}\) cause fluctuations in \(y_{1} ,y_{2} ,\cdots ,y_{n}\). If \(SSR=0\), then each of the fitted values is equivalent, i.e., \(\hat{y}_{i}\) does not vary with \(x_{1} ,x_{2} ,\cdots ,x_{{\rm p}}\), which implies \(\beta _{1} =\beta _{2} =\cdots =\beta _{p} =0\). Using algebraic operations and the system of regular equations (4) it can be proved: \[\label{GrindEQ__19_} \sum _{i=1}^{n}\left(y_{i} -\bar{y}\right)^{2} =\sum _{i=1}^{n}\left(\hat{y}_{i} -\bar{y}\right)^{2} +\sum _{i=1}^{n}\left(y_{i} -\hat{y}_{i} \right)^{2} , \tag{19}\] i.e. \(SST=SSR+SSE\).
Therefore, the larger the SSR, the greater the proportion of volatility of the \(y_{1} ,y_{2} ,\cdots ,y_{n}\)s described by the linear regression relationship i.e. the more significant the linear relationship between \(y\) and \(x_{1} ,x_{2} ,\cdots ,x_{p}\).
In addition, it can be proved by matrix operations that SST, SSE, SSR, have an array representation of the following form: \[\label{GrindEQ__20_} \left\{\begin{array}{l}S S T=Y^{T} Y-\frac{1}{n} Y^{T} J Y=Y^{T}\left(I_{n}-\frac{1}{n} J\right) Y \\ S S E=e^{T} e=Y^{T} Y-\beta X^{T} Y=Y^{T}\left(I_{n}-H\right) Y \\ S S R=\beta X^{T} Y-\frac{1}{n} Y^{T} J Y=Y^{T}\left(H-\frac{1}{n} J\right) Y\end{array}\right. \tag{20}\] where \(J\) denotes a square matrix of order \(n\) with all elements 1.
2) Decomposition of the self-expression degree: Corresponding to the decomposition of SST, there is a corresponding decomposition of its degrees of self-expression, where the degrees of freedom are the number of independently varying terms in the square. In SST, since there is a relation \(\sum _{i=1}^{n}\left(y_{i} -\bar{y}\right)=0\), i.e., \(y_{i} -\bar{y}\left(i=1,2,\cdots ,n\right)\) are not independently varying of each other, its self-out degree is \(n-1\). It can be shown that the SSE has degree of freedom \(n-p-1\) and the SSR has degree of freedom \(p\), and hence the decomposition corresponding to \(SST\) has a decomposition of degrees of freedom as well: \[\label{GrindEQ__21_} n-1=\left(n-p-1\right)+p . \tag{21}\]
3) Significance test of linear regression equation: As in the case of univariate linear regression, the significance of the regression equation can be tested using the \(F\) statistic, or the \(P\) value method can be used as a test. The \(F\) statistic is: \[\label{GrindEQ__22_} F=\frac{MSR}{MSE} =\frac{{SSR\mathord{\left/ {\vphantom {SSR p}} \right. } p} }{{SSE\mathord{\left/ {\vphantom {SSE n-p-1}} \right. } n-p-1} } , \tag{22}\] when \(H_{0}\) is true, \(F\sim F\left(p,n-p-1\right)\), given the level of significance \(\alpha\), check the \(F\) distribution table to get the critical value \(F_{\alpha } \left(p,n-p-1\right)\), calculate the observed value \(F_{0}\) of \(F\), and accept \(H_{0}\) if \(F_{0} \le F_{\alpha } \left(p,n-p-1\right)\), i.e., below the level of significance \(\alpha\), the linear relationship between \(y\) and \(x_{1} ,x_{2} ,\cdots ,x_{{\rm p}}\) is considered insignificant, and when \(F_{0} \ge F_{\alpha } \left(p,n-p-1\right)\), this linear relationship is significant.
Just because a regression equation passes a significance test does not mean that every independent variable \(x_{i} \left(i=1,2,\cdots ,p\right)\) has a significant effect on \(y\). It is possible that one or more of the independent variables do not have a significant effect on \(y\). If an independent variable \(x_{i}\) has no effect on \(y\), then its coefficient \(\beta _{i}\) should be zero in the linear model. Therefore testing whether the effect of \(x_{i}\) is significant is equivalent to testing the hypothesis: \[\label{GrindEQ__23_} H_{0} :\beta _{i} =0,H_{1} :\beta _{i} \ne 0 . \tag{23}\] The assumption of out multiple linear regression can be shown to be \(\hat{\beta }\sim N\left(\beta ,\sigma ^{2} \left(X'X\right)^{-1} \right)\).
If we remember the \(p+1\)st order square matrix \(C=\left(c_{ij} \right)=\left(X'X\right)^{-1}\), then when \(H_{0}\) holds, we have:
\[\label{GrindEQ__24_} \frac{\hat{\beta }_{i} }{\sigma \sqrt{c_{ii} } } \sim N\left(0,1\right) . \tag{24}\] Since \(\frac{SSE}{\sigma ^{2} } \sim \chi ^{2} \left(n-p-1\right)\) and are independent of \(\hat{\beta }_{i}\), by definition of the \(t\)-distribution, there is: \[\label{GrindEQ__25_} t_{i} =\frac{\hat{\beta }_{i} }{\hat{\sigma }\sqrt{c_{ii} } } \sim t\left(n-p-1\right) . \tag{25}\] Here \(\hat{\sigma }=\sqrt{\frac{SSE}{n-p-1} }\), for a given level of significance \(\alpha\), \(H_{0}\) is rejected when \(\left|t_{i} \right|>t_{\alpha /2} \left(n-p-1\right)\), and conversely, \(H_{0}\) is accepted. in the output of the SAS software, the results of the test can be seen directly from the \(p\) values.
For the estimator \(\hat{\beta }_{i}\), it is also interesting to see how close it is to \(\beta _{i}\), which requires determining the confidence interval for \(\beta _{i}\). Since \(\frac{\hat{\beta }_{i} -\beta _{i} }{\hat{\sigma }\sqrt{c_{ii} } } \sim t\left(n-p-1\right)\), and hence \(p\left\{\frac{\left|\hat{\beta }_{i} -\beta _{i} \right|}{\hat{\sigma }\sqrt{c_{ii} } } <t_{\alpha /2} \left(n-p-1\right)\right\}=1-\alpha\), there is a confidence interval for determining the confidence level of \(\beta _{i}\) for \(1-\alpha\): \[\label{GrindEQ__26_} \left(\hat{\beta }_{i} -t_{o/2} \hat{\sigma }\sqrt{c_{ii} } ,\hat{\beta }_{i} +t_{\alpha /2} \hat{\sigma }\sqrt{c_{ii} } \right) . \tag{26}\]
Drawing upon the symbolic interaction theory, the theory of planned behavior, and the comprehensive insights garnered from group discussions and expert interviews, this study has identified a total of five conditional variables: students’ sport cognition (X1), teachers’ professionalism (X2), the physical education teaching environment (X3), the implementation of the physical education curriculum (X4), and extracurricular physical education activities (X5). Furthermore, the study has specified one outcome variable: college students’ core literacy (Y).
The following hypotheses are proposed in this paper:
H1: Students’ sport cognition in physical education and health courses in colleges and universities has a significant positive effect on college students’ core literacy.
H2: Teachers’ professionalism has a significant positive effect on college students’ core literacy in physical education and health courses in colleges and universities.
H3: Physical education teaching environment has a significant positive effect on college students’ core literacy in physical education and health courses in colleges and universities.
H4: Physical education program implementation in physical education and health courses in colleges and universities has a significant positive effect on college students’ core literacy.
H5: Extracurricular physical activity in physical education and health programs in colleges and universities has a significant positive effect on college students’ core literacy.
After completing the design of the questionnaire based on the research hypotheses, it was distributed alongside the questionnaire designed to measure and evaluate the core literacy of college students in physical education, and subsequently collected.
Correlation analysis is employed to investigate the relationship between quantitative variables, examining both the existence and the degree of closeness of the relationship. Typically, this analysis precedes regression analysis, as the logical sequence dictates that a correlation must exist before a regression relationship can be assumed. Conventionally, a correlation coefficient greater than 0 indicates a positive correlation, whereas a coefficient less than 0 signifies a negative correlation. A coefficient greater than 0.7 is generally considered to indicate a very strong relationship, 0.4 to 0.7 represents a moderate to strong relationship, and 0.2 to 0.4 denotes a weak to moderate relationship. Furthermore, a p-value greater than 0.05 typically indicates that the correlation is not statistically significant, whereas a p-value less than 0.05 signifies that the correlation is statistically significant.
The correlation analysis among the variables of the hypothesized model is shown in Table 6, with CC denoting the correlation coefficient, * denoting p\(\mathrm{<}\)0.05, and ** denoting p\(\mathrm{<}\)0.01. The correlation coefficients between the students’ sports cognition X1, teachers’ professionalism X2, physical education teaching environment X3, physical education curriculum implementation X4, extracurricular physical activities X5, and the college students’ core literacy Y are 0.647, 0.767, 0.739, respectively, 0.818, and 0.762, with p-values of 0.000, which preliminarily indicates that there is a significant positive correlation between the five variables in the physical education and health curriculum of colleges and universities and the core literacy of college students.
| Dimension | X1 | X2 | X3 | X4 | X5 | Y | |
| X1 | CC | 1 | |||||
| P | |||||||
| X2 | CC | 0.668** | 1 | ||||
| P | 0.000 | ||||||
| X3 | CC | 0.561** | 0.647** | 1 | |||
| P | 0.000 | 0.000 | |||||
| X4 | CC | 0.724** | 0.719** | 0.575** | 1 | ||
| P | 0.000 | 0.000 | 0.000 | ||||
| X5 | CC | 0.852** | 0.677** | 0.696** | 0.901** | 1 | |
| P | 0.000 | 0.000 | 0.000 | 0.000 | |||
| Y | CC | 0.647** | 0.767** | 0.739** | 0.818** | 0.762** | 1 |
| P | 0.000 | 0.000 | 0.000 | 0.000 | 0.000 |
Linear regression is a statistical analysis method that employs mathematical regression analysis to quantify the interdependent relationships between two or more variables. The value of R² is universally recognized as a metric ranging from 0 to 1, with higher values indicating better fit of the regression model. Additionally, the Variance Inflation Factor (VIF) value assesses the presence of multicollinearity in the model; ideally, all VIF values should be less than 10, suggesting the absence of multicollinearity and a well-constructed model. The Durbin-Watson (D-W) statistic, when close to 2 (typically within the range of 1.7 to 2.3), signifies the absence of autocorrelation and thus a well-behaved model.
To assess statistical significance, we consider the p-value, which should be compared against a threshold of 0.05. If p \(\mathrm{<}\) 0.05, this indicates the presence of a statistically significant relationship; conversely, if p \(\mathrm{\ge}\) 0.05, there is no significant relationship. Assuming a significant relationship exists, its direction (positive or negative) can be determined by examining the “unstandardized coefficient” or “standardized coefficient.” A positive coefficient implies a positive influence, whereas a negative coefficient denotes a negative influence.
The ANOVA analysis of the model is shown in Table 7. The F-test of the model was found to pass the F-test (F=597.453, p=0.000\(\mathrm{<}\)0.05), i.e., it shows that the model construction is meaningful.
| Sum of squares | Df | Mean square | F | P value | |
| Regression | 322.156 | 4 | 104.541 | 597.453 | 0.000 |
| Residual error | 106.068 | 323 | 0.176 | ||
| Total | 428.224 | 327 |
Students’ sport cognition X1, teachers’ professionalism X2, physical education teaching environment X3, physical education curriculum implementation X4, and extracurricular physical activities X5 were used as independent variables, while college students’ core literacy Y was used as the dependent variable for linear regression analysis.
The results of the linear regression analysis for each variable are shown in Table 8. The model formula is:
College students’ core literacy = 0.174+0.362*Students’ sports cognition + 0.391*Teachers’ professionalism + 0.384*Physical education teaching environment + 0.403*Physical education curriculum implementation + 0.337*Extracurricular physical activity
The R-square value of the model is 0.794, which means that students’ sports cognition X1, teachers’ professionalism X2, physical education teaching environment X3, physical education curriculum implementation X4, and extracurricular sports activities X5 can explain 79.4% of the changes in college students’ core literacy Y. The F-test of the model found that the model passed the F-test (F=597.453, p=0.000\(\mathrm{<}\)0.05), that is, it indicates that at least one of the five independent variables will have an influential relationship on the core literacy of college students. In addition, the test for the multiple covariance of the model found that all the VIF values in the model are less than 5, which means that there is no covariance problem. And the D-W value is around the number 2, thus indicating that there is no autocorrelation in the model, there is no correlation between the sample data, and the model is better. The regression coefficients of each variable are all greater than 0, all of them will have a significant positive influence on the core literacy of college students, and the hypotheses H1\(\mathrm{\sim}\)H5 are all valid, that is, the students’ movement cognition, teachers’ professionalism, physical education teaching environment, physical education curriculum implementation, and extracurricular physical activities in physical education and health courses will affect the cultivation of core literacy of college students.
| Normalization factor | T | P | VIF | R\(^2\) | Adjust R\(^2\) | F | |
| Constant | 0.174 | 1.665 | 0.001** | – | 0.794 | 0.768 |
F(3489)= 597.453,
p=0.000 |
| X1 | 0.362 | 2.262 | 0.000** | 1.835 | |||
| X2 | 0.391 | 4.543 | 0.000** | 2.076 | |||
| X3 | 0.384 | 3.784 | 0.001** | 1.637 | |||
| X4 | 0.403 | 5.751 | 0.000** | 3.048 | |||
| X5 | 0.337 | 2.834 | 0.002** | 2.276 | |||
| Dependent variable: core quality of college students D-W Value:2.158 *p\(\mathrm{<}\)0.05 **p\(\mathrm{<}\)0.01 | |||||||
Based on the preceding analysis, Figure 1 illustrates the path for enhancing college students’ sports core literacy. Furthermore, the integration of college sports and health education into the core literacy cultivation system for college students represents an inevitable trend in the evolution of college sports teaching.
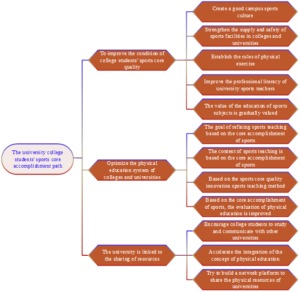
Colleges and universities must attend to the development of campus sports culture, tailored to the inherent needs of students for acquiring sports knowledge. They should engage with and cater to students by offering optional and diversified fine sports courses, and leverage the advantages of sports media to systematically and purposefully foster a vibrant atmosphere of campus sports culture.
The availability of diverse sports facilities is a prerequisite for college physical education teachers to conduct effective sports teaching activities and host sports events. It is imperative to increase the accessibility of sports facilities and venues, enabling college students to fully utilize the range of sports resources available to them and thereby participate in exercise, ultimately leading to a gradual improvement in physical fitness. Additionally, in order to enhance students’ performance in physical education courses, it is necessary to establish scientific and normative rules and regulations for physical exercise. This will foster college students’ awareness of sports, encourage the development of exercise habits, and continuously improve their physical quality.
On the one hand, teachers should develop sports core literacy by establishing correct values. On the other hand, physical education teachers must possess the necessary characteristics. Additionally, college physical education teachers ought to gradually enhance their teaching abilities, research capabilities in physical education, as well as their learning and reflective skills.
At this juncture, it is imperative to gradually elevate the significance of physical education in various colleges and universities. The government and institutions of higher learning must promptly reverse the prevailing notion of school education, recognizing that upholding the concept of students’ health and fitness is a prerequisite for all learning endeavors and aspects of life. Furthermore, they should accord importance to the role of physical education in fostering human development and respond positively to national policies by implementing the relevant guidance documents issued by the State General Administration of Sport pertaining to physical education reform initiatives.
In developing physical education teaching plans, colleges and universities ought to seamlessly integrate the five core qualities of physical education—namely, sports ability, sports health knowledge, sports health behavior, sports morality, and basic first aid skills—into their teaching designs. Furthermore, these qualities should be refined into specific learning objectives tailored to the various stages of physical education instruction.
Physical education teachers in colleges and universities should permeate the teaching content of each class with the core qualities of sports, with a focus on inspiring college students to recognize the value of sports. Additionally, they should optimize the content of physical education courses to ensure its alignment with the comprehensive and coordinated development of college students’ core sporting qualities.
In actual physical education (PE) instruction, PE educators ought to scientifically innovate and refine their teaching methodologies in response to the identified deficiencies in the core status of university students’ physical fitness education. Furthermore, they should leverage specialized teaching contexts to foster deeper engagement and participation among university students in PE learning.
Physical education teachers in colleges and universities ought to evaluate the core sports literacy of their students from a multi-dimensional perspective, ensuring that the evaluation methodology is diversified. This evaluation can be conducted multiple times throughout a semester, adhering to the teaching plan and assessing stage procedures, thereby enabling physical education teachers to promptly identify issues, adapt their teaching methodologies, and ultimately enhance the teaching effectiveness.
In the design of the syllabus, teachers can devise plans and arrangements tailored to the individual differences of students, ensuring that each student achieves a balance in their exercise regimen. This approach enables students to discover the joy in physical activity and facilitates their attainment of a physically fit physique within the classroom setting. During the semester, the evaluation process should encompass key indicators such as students’ exercise proficiency, health behaviors, and sporting character.
Colleges and universities can select students from various faculties and departments to engage in study and exchange programs with prestigious institutions, without disrupting their regular academic pursuits and in accordance with their personal aspirations. This approach fosters their social interaction skills and gradually instills in them accurate values pertaining to physical education. Invite leaders and expert teachers from other colleges and universities to deliver lectures and share their insights on physical education teaching. Based on the school’s unique circumstances, implement systems and methodologies that are conducive to the school’s development, specifically tailored for physical education instruction. Conduct regular, phased evaluations of physical education teaching to identify and address pain points in the teaching process. This approach facilitates the phased, purposeful, and gradual promotion of the comprehensive development of core physical education qualities among college students.
Schools can collaborate with other colleges and universities to procure high-quality teaching resources via online teaching and learning platforms. This integration infuses fresh energy into sports teaching in higher education institutions and, in addition, offers college students a distinct cognitive experience through the digital medium. This is of paramount importance in effectively fostering sports awareness, enhancing the mastery of sports knowledge, and promoting physical activity among students.
Establish dedicated sports funds to optimize school sports infrastructure and ensure its continuous maintenance, broaden the capacity and operational hours of sports stadiums, enhance the utilization of sports facilities, thereby furnishing students with a favorable sports milieu. Simultaneously, we will enrich online teaching resources, establish an interactive online school community, monitor the quality of students’ extracurricular physical activities, actively encourage and facilitate student involvement in physical exercise, harness the influential role of parents, foster a correct guiding ethos, and vigorously promote a lifelong cultivation of sports consciousness through concerted efforts.
In this study, we initially investigated the level of core literacy cultivation in physical education among college students at several institutions in region G through the administration of questionnaires. Subsequently, we conducted a multidimensional deviation ranking analysis. Following this, we selected variables to construct a hypothetical model and employed multiple regression analysis to examine the impact of physical education and health courses on college students’ core literacy. Additionally, we aimed to explore viable pathways for enhancing college students’ core literacy in physical education.
The overall core literacy of college students in physical education is at a medium level. Specifically, the highest proportions of students were classified as having “moderate” levels in athletic ability (38.84%), physical health behavior (41.90%), basic physical education first aid skills (38.23%), and physical health knowledge (36.09%). Notably, the highest proportion of students in the “middle and lower” category was observed in sports morality, with 33.03% of students falling into this range.
The coefficients for students’ sports cognition, teachers’ professionalism, the physical education teaching environment, physical education curriculum implementation, and extracurricular sports activities in college physical education and health courses were all found to be greater than 0, with p-values less than 0.05, indicating a statistically significant positive impact on the core literacy of college students. Notably, among these factors, the degree of influence of physical education curriculum implementation was the most pronounced, exhibiting a regression coefficient of 0.403.
Colleges and universities must continually enhance the provision of resources necessary for fostering the core sports literacy among students. They should optimize their sports teaching systems, with the core sports literacy serving as the cornerstone, and facilitate resource sharing among institutions through collaborative linkages. Additionally, it is imperative to integrate and embed sports teaching concepts throughout the curriculum to effectively elevate the core sports literacy of university students.
Given the scarcity of research on core literacy, there is a notable lack of research literature in this field, and the analysis of other variables that may affect the study outcomes remains uncomprehensive and unnuanced. Moreover, the study’s sample, limited to a few universities, fails to represent the broader university population. To address these limitations, future research should endeavor to broaden its scope, taking into account individual backgrounds, interests, and prior physical experiences, thereby enhancing the potential impact and generalizability of the findings.


