s China’s science and technology, as well as its social economy, continue to thrive, there has been a marked surge in the demand for high-quality talents. Consequently, higher education institutions, being pivotal in nurturing such talents, must embrace the vital responsibility of cultivating individuals who can contribute to national and societal development [1-3]. To this end, within the context of dance course instruction, higher education institutions ought to focus their efforts on fostering students’ artistic qualities through effective cultivation activities. This includes nurturing their artistic sentiment, alleviating academic pressures, piquing their interest in dance courses, and ultimately facilitating their transformation into the high-quality talents that are imperative for the advancement of the country and society.
Dance teaching holds a pivotal role in enhancing the artistic literacy of students enrolled in colleges and universities, with their personality traits and artistic proficiencies manifesting in their aesthetic sensibilities [4-6]. A proficient grasp of dance skills and knowledge is crucial in elevating students’ dance proficiency and artistic literacy. Furthermore, dance course offerings in academic institutions serve to enrich the extracurricular and campus life of students, alleviating academic pressures and fostering a state of physical and mental well-being. This, in turn, encourages active participation in teaching activities and fosters an appreciation for the distinctive charm of dance performances [7-9]. Additionally, the scientific development of dance curricula ensures that students complete their dance training under the expert guidance of teachers, thereby fostering comprehension of art through exposure to diverse dance works. This approach enhances students’ aesthetic capabilities and further refines their artistic literacy [10-12].Moreover, dance teaching activities serve as a pivotal vehicle for fostering students’ artistic literacy. Nevertheless, regarding the current state of affairs, Chinese colleges and universities have yet to fully invest in dance course instruction, remaining in a phase of exploration and lacking a comprehensive teaching system for dance courses. Consequently, it becomes challenging for dance course teaching activities to cater to the learning requirements of contemporary college and university students, resulting in some students being hesitant to engage in dance course studies due to time constraints or inadequate dance proficiency. This reluctance undermines efforts to enhance students’ artistic literacy and the overall teaching quality of dance courses, ultimately having a detrimental effect on students’ artistic aptitude and the standard of dance course instruction [13]. To effectively address these issues, dance educators in higher education institutions must meticulously plan their teaching designs, scientifically nurture students’ artistic literacy, and contribute to the holistic development of students’ comprehensive abilities.
The literature [14] traces the evolution of dance, commencing from its early influences on training and scholarship, through the establishment of university dance programs and research centers. This work endeavors to illustrate the multifaceted nature of careers in dance studies, which have traversed various paths, including teaching, practicing, writing, and collaboration. Literature [15] delves into recent research exploring the integration of technology in dance education, emphasizing not only the integration but also assessing its effectiveness, particularly focusing on the functionality of mobile devices and their pivotal role in facilitating dance teaching and learning.The literature [16] offers a reflective analysis of practice-based inquiry, adopting a choreographic coding lab model that captures the dynamic interplay between technology and interdisciplinary artists from both industrial and academic settings. This work further presents proposals for the development of future studio-based active learning environments.Literature [17] initially outlines the status of print publishing in Augsburg and Martin Engelbrecht’s position within the city before delving into a detailed examination of the images themselves, alongside the constituent elements and their significance: the glass windows and mirrors, bilingual texts (French and German) extolling the virtues of dance, the attire worn by the dance teacher and pupils, and ultimately, the messages conveyed through the dances depicted in the engravings.Lastly, Literature [18] narrates a project undertaken at the Lambert School of Dance, where innovative methodologies are employed in fostering reflection and reflective practice in dance education. This work provides an overview of dance education with a particular emphasis on reflective practice, concluding with a summary of reflections on the intricate relationship between these two concepts.Literature [19] recounts the scrutiny of Matisse’s early dance paintings, emphasizing their historical impact. The author poetically translates various sources into his own distinctive, reductive style, reflecting his profound passion for color, movement, and the vibrant expression found in dance.Literature [20] delves into the advancement of deep learning by elucidating key aspects such as parameter smoothing initialization, the convolutional pooling layer, optimal smoothing filter design, dynamic pruning methods, and the creation of wearable devices. Specifically, the study introduces a device capable of recognizing dance movements, thereby validating the applicability of deep learning-based wearable devices in the teaching of emotional mode dance.Literature [21] clarifies the challenges faced by artificial intelligence in college education, particularly in dance teaching. The author theoretically discusses the application strategy of AI in this domain and demonstrates its promotional role. By evaluating the performance of AI in college dance teaching, this work provides a novel perspective on the integration of cutting-edge technology in university education.Literature [22] builds upon the foundation of virtual technology, leveraging computer hardware and software resources to create an integrated technology that enables the experience of the virtual world. This technology realizes dynamic simulations of the real world, with a focus on analyzing aspects related to the teaching of physical education and dance. It empowers users to interact with the simulated dynamic environment in real-time, responding to gestures, verbal commands, and other forms of input.
In this paper, after completing the mining of dance teaching and college students’ art quality education data in colleges and universities, the mined data are organized and stored in the data warehouse, and combined with on-line analysis and processing to enable analysts to transform the original data from multiple perspectives in a fast, consistent, and exchangable way, which is comprehensible to the users, and to realize the visualization of the education data. On this basis, the mined educational data are processed, and based on the K-means algorithm, a self-organizing mapping network is introduced to accurately cluster students’ dance teaching and artistic quality education data. Then, after exploring the correlation between the two in terms of single-factor correlation analysis and multi-factor typical correlation analysis, the Apriori algorithm is used to mine the association rules of the two, and analyze the interrelationship between dance teaching in colleges and universities and art quality education of college students.
Educational data mining is the process of extracting information and knowledge that people do not know beforehand and is implied but potentially useful from a large amount of incomplete, fuzzy, and noisy random educational data.The goal of data mining is knowledge discovery, which is used for understanding and predicting behaviors and determining relationships. The process of data mining for dance and art quality education is shown in Figure 1, which generally includes three phases: data preparation, data mining, and expression and interpretation of results.
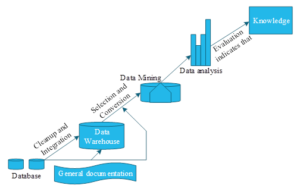
An important process of data mining is the data preparation phase, and the preparation of this phase will directly affect the efficiency, accuracy and mining results. In this data preparation phase can be divided into three steps, which are data integration, data selection and data preprocessing.
Data integration: In this process, data from multiple databases or multiple files are merged and processed, mainly dealing with omissions in the data, resolving semantic ambiguities and cleaning the data and other operations.
Data Selection: In this step, its main purpose is to distinguish the required data set, reduce the scope of the data to be processed, and improve the speed and quality of data mining.
Data Preprocessing: The purpose of data processing is to convert the data into a form suitable for data mining, and the data can be further simplified.
This stage represents the pinnacle of importance in data mining, posing a formidable technical challenge: selecting the most suitable data mining algorithms. In the realm of data classification analysis, algorithms such as Bayesian classification, decision tree-based methods, neural networks, and genetic algorithms are paramount. Similarly, in data clustering analysis, a myriad of algorithms exist, categorized into division-based, hierarchy-based, density-based, and grid-based approaches. Furthermore, association rule analysis encompasses a diverse array of algorithms, including parallel and distributed association rule algorithms, fundamental algorithms for association rules, and multilevel association rule algorithms. Lastly, within statistical prediction methods, the primary algorithms are regression prediction algorithms, alongside the hidden Markov model and other regression-based techniques.
The paramount objective of data mining is to furnish customers with reliable information that aids in decision-making processes. This necessitates not only the meticulous analysis of extracted data to discern the most pertinent information but also the deliberate consideration of the optimal means (encompassing charts and other visualization tools) for presenting these findings. Additionally, a crucial aspect involves implementing a rigorous filtering process to eliminate information that is deemed irrelevant or of no interest to the user. Should the results generated through the data mining process prove insufficient for decision-making purposes, it becomes imperative to revisit the data preparation or mining stages, iterating the process until satisfactory outcomes are achieved.
A data warehouse serves as a cornerstone for service management decision-makers, facilitating scientific decision-making processes. It comprises a collection of data that shares a common theme, is highly integrated, and exhibits relative stability, effectively reflecting the historical development and patterns of change within a particular class of data. This transition from manual manipulation of data related to business operations and market demands to computer-based management leverages database technology to automate the collection, storage, and management of such data, thereby enhancing efficiency and accuracy.
A data warehouse encompasses a comprehensive architecture comprising relational databases, data marts, diverse data sources, dimensions, levels, metrics, units, multidimensional datasets, partitions, and aggregations. Relational databases play a pivotal role in describing their utilization and functionality within the data warehouse framework. Data marts, on the other hand, house specific segments of data warehouse data tailored for particular applications.The term “Data Sources” refers to the assortment of structured data sources that are commonly employed in the construction of data warehouses. Dimensions serve to elucidate the data present within the fact tables of a data warehouse, while levels delineate the hierarchical organization of data, grounded in either dimension table columns or member attributes.Metrics are numerical indicators that end-users primarily concentrate on when navigating through multidimensional datasets. A cell, being the most fundamental unit of a multidimensional dataset, represents the unique logical intersection of members from each dimension associated with that dataset.Multidimensional datasets constitute a multifaceted structure that integrates dimensions and metrics, facilitating the depiction of cell values through the aggregation of metric values. Partitions facilitate the storage and administration of pre-computed aggregates, and in some instances, source data as well. Lastly, aggregations refer to the pre-calculated summaries of data, offering an efficient means of data analysis.
The primary objective of a data warehouse is to establish an analytics-centric, integrated data environment that serves as a cornerstone for enterprise decision-making. Notably, the data warehouse itself neither generates nor consumes data directly; rather, it serves as a conduit for data sourced externally and is accessible to external applications. Data for the warehouse originates from diverse sources and caters to a range of data applications. This data flows sequentially into the warehouse, with the upper layers facilitating data applications, while the warehouse core functions as an intermediary platform for data management.The implementation of a data warehouse encompasses four distinct functional domains: data acquisition, which involves gathering data from various sources; data organization, ensuring the structured arrangement of data for efficient access and analysis; data application, where the data is utilized to support various business needs; and finally, data presentation, presenting the insights derived from the data in a comprehensible manner.
The amount of data stored in the data warehouse is large, and some useful information can be obtained from the data warehouse. The architecture of data warehouse is shown in Figure 2. Data warehouse generally includes the following contents:
Data collection part: it is collected and processed from the original data and finally it is added to the data warehouse.
Data transfer part: the function of this part is available to transfer some data to other data warehouse or outside.
Intermediate part: it gives the final user how to use the data warehouse.
Data access part: it provides the end users of the organization with access and data analysis tools of the data warehouse.
Design section: it is used to design the data warehouse database.
Catalog section: This section is for information managers and end users to store some information related to the data.
Data section: In this section, it mainly realizes the function of instructing users how to operate the database.
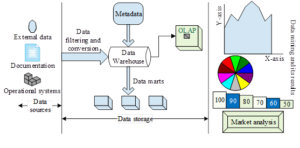
Online Analytical Processing (OLAP) is a data processing technology designed to empower analysts and managers with the capability to swiftly, consistently, and interchangeably transform raw data from diverse angles, ensuring that the transformed data is comprehensible to users. This technology facilitates analysts in uncovering the underlying patterns and laws embedded within the data. Encompassing features such as modeling, storage, independence, swiftness, interactivity, and display capabilities, the technical conceptual framework revolves around fundamental concepts including variables, dimensions, dimension levels, and dimension members.
Variables: Variable is the definition of the specific object described, indicating the specific meaning of the data, that is, what the data is.
Dimension: Dimension is a specific perspective when analyzing data, using different vision, will get different results, the same problem can be analyzed from many different dimensions.
Dimension member: Dimension member is a specific value of a dimension, if the dimension has more than one level, the dimension member consists of the values of each level.
Slicing and Chunking: In a multidimensional data structure, slicing is to take out the plane formed by any two dimensions, which is a two-dimensional true subset of the multidimensional data structure, and chunking is to take out the cube formed by three dimensions, which is a three-dimensional subset of the multidimensional data structure.
Rotation and Drilling: In the three-dimensional array, rotation mainly refers to the three dimensions to exchange positions with each other, that is, the data cube produces rotation, drilling is to refine or generalize a variable value in a certain dimension.
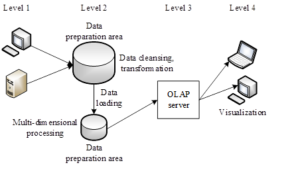
OLAP structure: OLAP is based on the data analysis and processing system between the user and the data warehouse, the server structure of OLAP is shown in Figure 3. Multidimensional analysis and processing of data from the data warehouse, usually use a three-tier client-server structure, in which the structure of the data warehouse, the server and the client to make a strict distinction between the system’s processing is mainly carried out on the server.
Let \(I=\left\{i_{1} ,i_{2} ,\ldots ,i_{m} \right\}\) be a set of terms and \(D\) be a set of transactions, where each transaction \(T\) is a set of terms, \(T\subseteq I\). Let \(X\) be a set of terms, \(X\subseteq I\), and transaction \(T\) contains \(X\) if and only if \(X\subseteq T\). An association rule is an implication of the form \(X=>Y\), where \(X\subseteq I,Y\subseteq I\), and \(X\cap Y=\phi\). The degree of interest of an association rule can be measured in terms of support and confidence.
Support: If the percentage of transactions in \(D\) that contain \(X\cup Y\) is \(s\%\), then we say that association rule \(X=>Y\) has support \(s\%\) in transaction set \(D\), denoted by \(support(X=>Y)\): \[\label{GrindEQ__1_} \text{support}(X=>Y)=\frac{|\{ t|t{\rm }}{{\rm o}}. \tag{1}\]
Confidence: We say that association rule \(X=>Y\) has confidence \(c\%\), denoted by \(confidence(X=>Y)\), in transaction set \(D\) if the percentage of the number of transactions in \(D\) that contain both \(X\) and \(Y\) to the number of transactions that contain \(X\) is \(c\%\): \[\label{GrindEQ__2_} \text{confidence}(X\Rightarrow Y)=\frac{|\{ t|t{\rm }}{{\rm o}}. \tag{2}\] Or: \[\label{GrindEQ__3_} \text{confidence}(X\Rightarrow Y)=\frac{\text{support}(X\Rightarrow Y)}{\text{support}(X)} *100\% =c\%. \tag{3}\]
Strong association rules: association rules that satisfy both the minimum support threshold and the minimum confidence threshold are called strong association rules.
Mining of association rules is a two-step process:
Step 1: Find all the frequent itemsets. The number of occurrences of these itemsets is greater than or equal to the predefined minimum support count.
Step 2: Generate strong association rules from the frequent itemsets. These association rules must satisfy the minimum confidence level.
Finding the best of the association rule mining algorithms is Apriori algorithm.
The Apriori algorithm has been leveraged to enhance a crucial property, aiming to improve the hierarchical search capability and, consequently, streamline the processing of frequent itemsets.
The Apriori algorithm mines frequent itemsets, a highly intricate problem. To facilitate clear exposition in this paper, we introduce the notation Lk to signify a frequent itemset, and Lk-1 as a representative example of the generation process of Lk. Elucidating the specific application method necessitates an explanation of how Lk is derived from Lk-1, involving two crucial processing steps: the join operation and the pruning operation.
Joining step: from the above joining step will be Ck, which is a superset of k. However, some of the itemsets are not frequent itemsets, and two itemsets in k-1 can be joined to obtain a candidate set Ck for k. However, all frequent k-itemsets are present in Ck. By scanning the database, the support frequency can be determined and the elements of LK can be fully captured.Two itemsets are set in Lk-1, specifically p and q. The ith item in p is denoted by the notation p.itemi. By the same reasoning, the notation q.itemi denotes the ith item in q. Denote if the first (k-2) terms in p and q are the same, we denote the Lk-1 joining operation as Lk-1Lk-1, i.e., if there is:The condition p.itemk-1 \(\mathrm{<}\) q.itemk-1 ensures that no duplicate itemsets are created. (p.item1=q.item1)\(\mathrm{\wedge}\)… (p.itemk-2=q.itemk-2). \(\mathrm{\wedge}\) (p.itemk-1,\(\mathrm{<}\)q.itemk-1)\(\mathrm{\wedge}\), then the contents of p and q in Lk-1 can be joined together.
An important model of artificial neural networks is self-organizing mapping (SOM). The basic SOM algorithm process is described as follows:
Initialization: randomly initialize the weight vector of the neurons in the output layer \(W\). Let the total number of neurons in the output layer in the network be \(l\), and the dimension of the input space be \(m\), then \(W_{j} =\left[w_{j1} ,w_{j2} ,w_{jm} \right]^{T} ,j=1,2,\cdots ,l\).
Competitive process: randomly select the input pattern vector from the input space, denoted as \(X=\left[x_{1} ,x_{2} ,\cdots ,x_{m} \right]^{T}\), and compute the distance of \(X\) from the weight vectors of all neurons. Using the Euclidean distance as a criterion, the neuron closest to the weight vector is the winning neuron: \[\label{GrindEQ__4_} i(X)=\arg {\mathop{\min }\limits_{j}} \left\| X(t)-W_{j} \right\| ,j=1,2,3,\cdots ,l. \tag{4}\]
Cooperative process to determine the response neighborhood: winning neurons activate their topologically adjacent neurons.
The radius of the neighborhood of the winning neuron monotonically decreases over time, with the aim that the overlap between the perceptual domains of the neuron’s nodes gradually decreases over the course of the training process, eventually becoming zero.
Let \(h_{j,i}\) denote the topological neighborhood centered on the winning neuron \(i\). The neighborhood function usually uses a Gaussian function, i.e: \[\label{GrindEQ__5_} h_{j,i\left(X\right)} (t)-\exp \left(-\frac{d_{j,i}^{2} }{2\sigma ^{2} (t)} \right)t=0,1,2,\cdots , \tag{5}\] where \(d_{j,i}\) denotes the lateral distance between the winning neuron \(i\) and the excitatory neuron \(j\). and: \[\label{GrindEQ__6_} d_{j,i}^{2} =\left\| r_{i} -r_{j} \right\| ^{2} , \tag{6}\] where, \(\sigma (t)\) is the effective width of the neighborhood, which shrinks with time: \[\label{GrindEQ__7_} \sigma (t)=\sigma _{0} \exp \left(-t/\tau _{1} \right){\rm \; \; \; \; }t=0,1,2,\cdots , \tag{7}\] where \(\sigma _{0}\) is the initial value of \(\sigma\) and \(\tau _{1}\) is the time constant.
Adjusting the neighborhood yields two noteworthy effects. Firstly, it mitigates the algorithm’s sensitivity to the initial weight vector, thereby enhancing its robustness. Secondly, it exerts a local smoothing influence on the weight vectors of adjacent neurons, ultimately facilitating the establishment of a global ordering through this localized learning process.
When \(\sigma (t)=0\), the output neurons of SOM become completely competitive with each other, at this time SOM is the same as K-means clustering process.
Adjusting the size of the weight vectors: the weight vectors of the winning neurons and their neighboring nodes in the SOM topological space are adjusted so that they move towards the input pattern.
The weight vector adjustment rule is: \[\label{GrindEQ__8_} W_{j} (t+1)=W_{j} (t)+\eta (t)h_{j,i(x)} (t)\left(X(t)-W_{j} (t)\right) , \tag{8}\] where \(\eta\) is the learning rate parameter, which monotonically decreases with time \(t\) starting from an initial value \(\eta _{0}\). This ensures the convergence of the adaptive adjustment process of the SOM neural network weight vectors, which can be calculated by the following equation: \[\label{GrindEQ__9_} \eta (t)=\eta _{0} \exp \left(-t/\tau _{2} \right){\rm \; \; \; \; }t=0,1,2,\cdots . \tag{9}\]
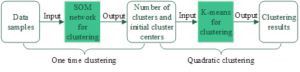
The K-means two-stage clustering algorithm based on self-organizing mapping is shown in Figure 4. Its specific implementation process is divided into two stages as follows:
During the initial stage, the data intended for clustering is fed into the SOM network for training. Initially, SOM is employed to cluster the data samples, deriving the total number of clusters and the centroid of each cluster, serving as the initial clustering centers. Given that precise grouping is not essential in the cooperative learning context, a roughly accurate clustering suffices, allowing for a reduction in the number of SOM training iterations. Consequently, the network does not necessitate full convergence at the end of the training process. Through self-organization, each node of the output layer evolves into a neural cell sensitive to a specific pattern class, leading to the identification of the centroid vectors for each input pattern. These centroids are then utilized as the initial clustering centers for the subsequent stage of the K-means algorithm.
In the second stage, K-means takes the clustering center made by SOM clustering as the initial clustering center, executes the K-means clustering algorithm, further clusters and outputs the final clustering results.
Specific realization steps:
First clustering: initial clustering by the self-organizing mapping clustering SOM, resulting in the number of clusters and the initial clustering center. The role of this step is to use the SOM to preprocess the data of the samples to be clustered, the main method is to use the SOM network to train the input data, and a set of weight vectors are obtained at the end of training. The number of times the network is trained at this stage can be reduced a little bit, as the network is not required to converge completely, while the number of output neurons can be increased appropriately.The SOM algorithm is used to form prototypes with far more than the expected number of clusters.
Step 1: Input the original sample data for weight initialization.
Set \(W\) as the weight vector of randomly initialized output layer neurons, \(m=M\) as the dimension of the input space, assign small random numbers to the weights of the output layer neuron nodes and normalize them, \(l\) as the total number of output layer neurons in the network, \(W_{j} =\left[w_{j1} ,w_{j2} ,w_{jm} \right]^{T} ,j=1,2,\cdots ,l\), and set the initial number of loops \(t=1\). \(r(0)\) as the radius of the specified initial winning domain, \(\alpha (0)\) as the learning efficiency, and \(T_{\max }\) as the maximum number of iterations.
Step 2: Input a pattern vector \(X=\left[x_{1} ,x_{2} ,\cdots ,x_{m} \right]^{T}\) to find the winning node through a competitive process.
a) Calculate the distance between \(X\) and the weight vectors of all neurons, and the neuron closest to the weight vector is the winning neuron. That is, find the weight vector of \(W_{j}\) that has the smallest distance from \(X_{t} (t=1,2,\cdots m)\).
The formula is: \[\label{GrindEQ__10_} i(X)=\arg {\mathop{\min }\limits_{j}} \left\| X(t)-W_{j} \right\| ,j=1,2,3,\cdots ,l , \tag{10}\] where the Euclidean distance of any two \(m\)-dimensional vectors \(A\) and \(B\) is calculated as: \[\label{GrindEQ__11_} \left\| X-W\right\| =\sqrt{\sum _{j=1}^{m}\left(x_{i} -w_{k} \right)^{2} } . \tag{11}\]
b) The node \(g\) with the smallest distance is selected as the winning node and \(N_{g} (t)\) is the winner neighborhood. The weight vector linked to node \(g\) is adjusted so that it is close to \(X_{k}\). The learning equation is: \[\label{GrindEQ__12_} \Delta w_{ij} =\alpha (t)\left|x_{ik} -w_{ij} \right|,w_{ij} =w_{ij} +\Delta w_{ij} , \tag{12}\] here \(i=1,2\cdots l,j=1,2\cdots m\). \(\alpha (t)\) is the learning efficiency parameter for the \(t\)nd time, which monotonically decreases with the number of training sessions (i.e., over time) starting from an initial value of \(\alpha _{0}\): \(\alpha (t)\) is given by: \[\label{GrindEQ__13_} \alpha (t)=\alpha _{0} \exp \left(-t/\tau _{2} \right){\rm \; \; \; \; }t=0,1,2,\cdots . \tag{13}\] \(x_{ki}\) is the input of the \(i\)rd input node of the \(k\)nd sample data, \(w_{ij}\) is the connection weight between the \(i\)th input node and the \(i\)th output node, where \(j\in N_{g} (t)\).
c) Judgment of the network.
Judgment condition 1: Whether the weight values of the neuron nodes have reached the convergence state.
The judgment formula is \(r(t)<\varepsilon\).
Judgment condition 2: the iteration has reached the maximum number of times, i.e. \(t>T_{\max }\).
Network training can be terminated if one of the two conditions is met, otherwise repeat step 2, i.e. \(t=t+1\).
After the network training is terminated, the clustering structure of the sample is completed by the response of the output node.
Step 3 outputs the number of clusters \(C\) and the initial cluster centers \(Z=\left\{Z_{1} ,Z_{2} ,\cdots Z_{c} \right\}\). The prototype of the number of clusters generated in this step, from which specific clusters are also generated in the second clustering.
a) Second clustering K-means clustering: A set of weight vectors obtained from SOM clustering is executed for clustering using K-means algorithm. The number of output clusters \(C\) and the initial clustering centers \(Z=\left\{Z_{1} ,Z_{2} ,\cdots Z_{c} \right\}\), are used as initial parameters for secondary clustering using K-means, and the initial clustering centers need to be further processed to obtain suitable centers before secondary clustering. Firstly, the prototype with much more than expected number of clusters is formed using SOM algorithm i.e. the first layer of data is obtained through SOM which is the output of the first clustering. While performing the second clustering i.e. using K-means clustering, first in the output of the previous layer K centroids are identified and then specific clusters are generated using the clustering method.
There are a large number of interconnected, interdependent, and mutually constraining quantitative relationships between things. This relationship can be divided into two types: one is a functional relationship, and the other is a correlation relationship.
Correlation analysis is to determine the regularity of the correlation between phenomena, and accordingly to predict and control the analytical method, is the study of the degree of closeness between the variables of a commonly used statistical methods. The correlation coefficient, also known as the Pearson’s product-moment correlation coefficient, is an indicator of the degree of closeness of the correlation between two phenomena, and is expressed as \(r\): \[\begin{aligned} \label{GrindEQ__14_} r(x,y) =\frac{COV(x,y)}{\sqrt{D(x)D(y)} } =\frac{\sum _{i=1}^{n}\left(x_{i} -\bar{x}\right) \left(y_{i} -\bar{y}\right)}{\sqrt{\sum _{i=1}^{n}\left(x_{i} -\bar{x}\right)^{2} \sum _{i=1}^{n}\left(y_{i} -\bar{y}\right)^{2} } } , \end{aligned} \tag{14}\] where \(\bar{x}=\frac{1}{n} \sum _{i=1}^{n}x_{i}\), is the mean of the \(x\) variable; \(\bar{y}=\frac{1}{n} \sum _{i=1}^{n}y_{i}\), is the mean of the \(y\) variable, and \(n\) is the sample size.
One-way correlation analysis examines the relationship between a single variable and a set of other variables, with a particular focus on the pairwise relationship between two performance variables in isolation. This analysis, which operates on a one-to-one basis, quantifies the strength of the linear relationship between a specific dance class and professional artistic literacy education. However, it should be noted that this analysis is not intended to provide a generalized picture of such relationships.
Typical correlation analysis, a multivariate statistical technique, is employed to investigate the correlations between two sets of variables, thereby uncovering their inherent relationships. Its primary objective lies in identifying and quantifying the connections between these variable sets. Moreover, it facilitates the transformation of the analysis, shifting the focus from the correlation between individual variables to the correlation between linear combinations of variables from each set.
Assuming that the two variables are \(X_{1} ,X_{2} ,\ldots ,X_{p}\) and \(Y_{1} ,Y_{2} ,\cdots ,Y_{q}\), the linear combinations of the two variables are \(V\) and \(W\), i.e., \(V=a_{1} X_{1} +a_{2} X_{2} +\cdots a_{p} X_{p} ,W=b_{1} Y_{1} +b_{2} Y_{2} +\cdots b_{q} Y_{q}\). Since there can be many linear combinations of a set of variables (the linear combinations are determined by the corresponding coefficients), it is necessary to find meaningful linear combinations. A meaningful linear combination is one that combines a representative number of variables from two sets of variables into a new variable. Typical correlation analysis is to find a linear combination of these two sets of variables and maximize the correlation coefficient between the two sets of variables. The problem, then, is to find the coefficients \(a_{1} ,a_{2} ,\ldots ,a_{p}\) and \(b_{1} ,b_{2} ,\cdots ,b_{q}\) that maximize the correlation between the new combined variables (also known as the typical variables), which is measured by the typical correlation coefficient.
The main problem involved here is the solution of the eigenvalues and eigenvectors of the matrix, and the resulting eigenvalues are directly related to the typical correlation coefficients of \(V\) and \(W\), i.e., the eigenvalues are the typical correlation coefficients of the variables \(V\) and \(W\), and the largest eigenvalues are the first typical correlation coefficients of \(V\) and \(W\), which indicate that \(V\) and \(W\) are most relevant. The next largest eigenvalues are the second typical correlation coefficients for \(V\) and \(W\), indicating that \(V\) and \(W\) are next most relevant. The other eigenvalues have a decreasing correlation with \(V\) and \(W\) in that order. In practice, it is sufficient to select those for which the cumulative total contribution of the eigenvalues accounts for the major part, and preferably the first typical correlation coefficient extracts enough correlation components. Typical correlation analysis makes it easy to capture the essence of the problem by substituting the study of a few typically correlated variables for the study of the original correlation between the two sets of variables.
The steps for solving for typical variables and corresponding typical correlation coefficients for \(X\) and \(Y\) are as follows:
Find \(X\) the matrix of correlation coefficients between the variables \(S_{xx}\), \(Y\) the matrix of correlation coefficients between the variables \(S_{yy}\), \(X\) and \(Y\) the matrix of correlation coefficients between the variables \(S_{xy}\) and \(S_{yx}\), where \(S_{xy}\) is the \(S_{yx}\) transposed matrix, and compute \(D=S_{yy}^{-1} S_{yx} S_{xx}^{-1} S_{xy}\), where \(S_{yy}^{-1}\) is the inverse matrix of \(S_{yy}\) and \(S_{xx}^{-1}\) is the inverse matrix of \(S_{xx}\).
Other formulas used: \[\label{GrindEQ__15_} \begin{cases} r(x, y)=\frac{\sum_{i=1}^{n}\left(x_{i}-\bar{x}\right)\left(y_{i}-\bar{y}\right)}{\sqrt{\sum_{i=1}^{n}\left(x_{i}-\bar{x}\right)^{2} \sum_{i=1}^{n}\left(y_{i}-\bar{y}\right)^{2}}}, \\ \bar{x}=\frac{1}{n} \sum_{i=1}^{n} x_{i}, \bar{y}=\frac{1}{n} \sum_{i=1}^{n} y_{i}.\end{cases} \tag{15}\]
Find all non-zero eigenvalues of \(D\). Let all non-zero eigenvalues of \(D\) be in order \(\lambda _{1}^{2} \ge \lambda _{2}^{2} \ge \lambda _{3}^{2} \ge \ldots \lambda _{r}^{2}\).
Find the normalized eigenvector \(Z_{i}\) of the corresponding \(\lambda _{i}^{2} (i=1,2,\ldots r)\) of \(D\).
Find the typical variables and typical correlation coefficients: let \(u_{i} =\lambda _{i}^{-1} S_{xx}^{-1} S_{xy} Z_{i}\), so that the typical variable of \(X,Y\) is \(V_{i} =u_{i} X,W_{i} =Z_{i} Y\), and the corresponding typical correlation coefficients are \(\lambda _{1}^{2} \ge \lambda _{2}^{2} \ge \lambda _{3}^{2} \ge \ldots \lambda _{r}^{2}\), respectively.
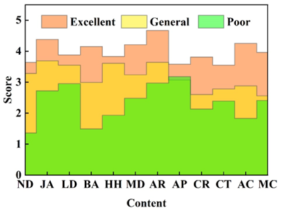
The university of the arts, in which dance teaching included folk dance (ND), jazz dance (JA), Latin dance (LD), ballet (BA) street dance (HH), and modern dance (MD). Art education mainly includes aesthetic concept (AR), artistic perception (AP), creativity (CR), critical thinking (CT), appreciation (AC), and moral character (MC).
In this study, the SOM-based K-means clustering algorithm was applied to the processed data, resulting in the grouping of students into six distinct clusters. Subsequently, these six clusters were visually represented and subjected to thorough analysis. Figure 5 presents the visualization of the clustering outcomes pertaining to student performance, wherein three distinct types of clusters exhibit varied trends in their academic achievements. Specifically:
The first category of students had scores between 3.5 and 4.7 in folk dance, jazz dance, Latin dance, ballet, street dance, modern dance, aesthetic concepts, artistic perception, creativity, critical thinking, appreciation, and ideology and morality, and had excellent performance results in dance teaching and quality education in the arts, with a total of 98 students, or 56.6% of the total. This type of students’ learning ability is stronger, and teachers are more sparing with this type of students.
Most of the courses of the second group of student communities were in the middle, and this group of students had average academic performance. In terms of academic performance, the grades of ethnic dance, jazz dance, Latin dance, ballet, street dance, modern dance, aesthetic concept, artistic perception, creativity, critical thinking, appreciation, and ideology and morality of this part of the student community are in the range of 2.5 to 3.7, with a total of 55 students, accounting for 31.8%.
The third group of students’ community performance is on the lower end of the scale. In terms of academic course performance, this group of students performs poorly in folk dance, jazz dance, Latin dance, ballet, street dance, modern dance, aesthetic concepts, artistic perception, creativity, critical thinking, appreciation, as well as achievement in ideology and morality, with the highest score not exceeding 3.3. There were 20 students in this category, accounting for 11.6% of the total. These students performed poorly and did not study hard enough, and teachers need to focus on such students in the teaching process.
This paper employs Pearson’s coefficient as a statistical metric to quantify the strength of the relationship between dance teaching and art quality education. The significance threshold of p\(\mathrm{<}\)0.05, in conjunction with the absolute value of the correlation coefficient (r), dictates the interpretation of this relationship. Specifically, r\(\mathrm{\ge}\)0.5 signifies a statistically significant and substantial correlation between dance teaching and art quality education. Conversely, 0.3\(\mathrm{\le}\)r\(\mathrm{<}\)0.5, though still statistically significant (p\(\mathrm{<}\)0.05), indicates a weaker connection. Lastly, r\(\mathrm{<}\)0.3 implies a lack of statistical correlation between the two variables. The correlation analysis was conducted using SPSS software, and the outcomes of this analysis are presented in Table 1, which details the simple correlation between dance teaching and art quality education.
From the table, it can be concluded that statistically significant correlation, low correlation and non-correlation between the dance and art quality education content that showed significant correlation. Among them, the dance instruction significantly correlated with aesthetic perception education are jazz dance (0.808), street dance (0.530), whose p-values are less than 0.05. The dance instruction significantly correlated with artistic perception education are folk dance (0.583), Latin dance (0.646), ballet (0.697). The dance teaching contents significantly related to creativity, critical thinking, appreciation and ideology are all Latin dance, and their correlation coefficients are 0.873, 0.551, 0.782 and 0.519 respectively, which indicates that the teaching of Latin dance can significantly enhance the education of college students’ artistic quality. In addition, there is no correlation between Latin dance and ballet and aesthetic concepts, and the r-value is less than 0.3, indicating that Latin dance and ballet, as the most common types of dance, cannot cultivate students’ aesthetic concepts. There is no correlation between ballet and the cultivation of creativity in art quality education (r=0.269, p=0.023\(\mathrm{<}\)0.05), and street dance and the cultivation of appreciation in art quality education (r=0.245,p=0.056\(\mathrm{>}\)0.05), and ballet and street dance can’t cultivate students’ creativity and appreciation.
| ND | JA | LD | BA | HH | MD | ||
| AR | Pearson correlation | 0.436 | 0.808 | 0.254 | 0.214 | 0.530 | 0.347 |
| Significance (double tail) | 0.000 | 0.000 | 0.000 | 0.000 | 0.000 | 0.000 | |
| AP | Pearson correlation | 0.583 | 0.361 | 0.646 | 0.697 | 0.477 | 0.471 |
| Significance (double tail) | 0.000 | 0.000 | 0.000 | 0.001 | 0.000 | 0.000 | |
| CR | Pearson correlation | 0.661 | 0.447 | 0.873 | 0.269 | 0.771 | 0.499 |
| Significance (double tail) | 0.000 | 0.000 | 0.000 | 0.023 | 0.000 | 0.018 | |
| CT | Pearson correlation | 0.662 | 0.541 | 0.551 | 0.403 | 0.877 | 0.317 |
| Significance (double tail) | 0.000 | 0.000 | 0.000 | 0.000 | 0.000 | 0.000 | |
| AC | Pearson correlation | 0.559 | 0.521 | 0.782 | 0.72 | 0.245 | 0.621 |
| Significance (double tail) | 0.000 | 0.000 | 0.000 | 0.000 | 0.056 | 0.000 | |
| MC | Pearson correlation | 0.467 | 0.456 | 0.519 | 0.732 | 0.321 | 0.682 |
| Significance (double tail) | 0.000 | 0.000 | 0.000 | 0.000 | 0.337 | 0.000 |
Using the content of college dance teaching as the X variable (X\({}_{1}\)=ND, X\({}_{2}\)=JA, X\({}_{3}\)=LD, X\({}_{4}\)=BA, X\({}_{5}\)=HH, X\({}_{6}\)=MD), and the content of college students’ artistic quality education as the Y variable (Y\({}_{1}\)=AR, Y\({}_{2}\)=AP, Y\({}_{3}\)=CR, Y\({}_{4}\)=CT, Y\({}_{5}\)=AC, Y\({}_{6}\)=MC), the typical correlation between the two sets of variables of college dance teaching and artistic quality education were Analysis. Table 2 shows the typical correlation analysis of college dance teaching and art quality education. The results show that a total of four pairs of typical correlation variables were obtained, and the test found that the typical correlation coefficients of the first and second pairs of typical correlation variables were statistically significant (P\(\mathrm{<}\)0.001), i.e., the correlation coefficient of the first pair of typical correlation variables was 0.552, with an eigenvalue contribution rate of 65.6%. The correlation coefficient of the second typical correlation variable is 0.313, with an eigenvalue contribution rate of 29.8%, and the cumulative contribution rate of the first two pairs is 95.4%, indicating that the correlation between dance teaching and artistic quality education in colleges and universities is mainly explained by the first pair of typical correlation variables.
| Canonical correlation variables | First pair | Second pair | Third pair | Fourth pair |
| Canonical correlation coefficient | 0.552 | 0.313 | 0.121 | 0.082 |
| Eigenvalue | 0.258 | 0.135 | 0.012 | 0.004 |
| Contribution rate (%) | 0.656 | 0.298 | 0.028 | 0.018 |
| Cumulative contribution | 0.656 | 0.954 | 0.982 | 1.000 |
| F value | 10.225 | 5.883 | 1.442 | |
| Molecular freedom | 18.000 | 10.000 | 5.000 | |
| P value | 0.000 | 0.000 | 0.152 |
On this basis, the typical structure and redundancy were analyzed, and Table 3 shows the typical structure and redundancy analysis of dance teaching and art quality education in colleges and universities. Among them, U\({}_{1}\) is negatively correlated with folk dance, Latin dance, modern dance, artistic perception, creativity, critical thinking, appreciation and ideology and morality, and positively correlated with jazz dance, ballet, modern dance and aesthetic concepts, among which the correlation with college dance teaching is stronger. U\({}_{2}\) is positively correlated with creativity cultivation of artistic quality education, and negatively correlated with all other variables, among which the correlation with jazz dance and street dance is stronger. V\({}_{1}\) is negatively correlated with folk dance, Latin dance, modern dance, artistic perception, creativity, critical thinking, and appreciation, and positively correlated with jazz dance, ballet, modern dance, aesthetic concepts, and ideology and moral character, among which the correlation with Latin dance, artistic perception, and critical thinking is stronger (r\(\mathrm{>}\)0.5). The second typical variable V\({}_{2}\) was positively correlated with creativity and negatively correlated with the rest of the variables, with stronger correlations with aesthetic perception and critical thinking. The results of the typical redundancy analysis showed that U\({}_{1}\) could explain 53.84% of the within-group variation (group of X variables) and 5.38% of the variation in the group of Y variables, and V\({}_{1}\) could explain 24.11% of the within-group variation (group of Y variables) and 12.07% of the variation in the group of X variables, which indicated that the role of the dance teaching in influencing the quality of art education was greater than the role of the quality of art education in influencing the dance teaching.
| U\(_1\) | U\(_2\) | V\(_1\) | V\(_2\) | |
| National dance | -0.712 | -0.338 | -0.339 | -0.113 |
| Jazz | 0.552 | -0.689 | 0.263 | -0.222 |
| Latin dance | -0.983 | -0.147 | -0.467 | -0.048 |
| Ballet | 0.619 | -0.437 | 0.296 | -0.14 |
| Hip-hop | -0.747 | -0.628 | -0.31 | -0.123 |
| Modern dance | 0.813 | -0.444 | 0.287 | -0.11 |
| Aesthetic reading | 0.196 | -0.253 | 0.398 | -0.793 |
| Artistic perception | -0.399 | -0.118 | -0.836 | -0.352 |
| Creativity | -0.076 | 0.094 | -0.164 | 0.29 |
| Critical thinking | -0.258 | -0.192 | -0.539 | -0.583 |
| Appreciation | -0.078 | -0.055 | -0.168 | -0.168 |
| Moral character | -0.005 | -0.047 | 0.119 | -0.087 |
| The X variable group is explained by the U percentage | 53.84 | 12.07 | 24.11 | 5.38 |
| The X variable group is explained by the V percentage | 20.02 | 2.16 | 23.74 | 2.57 |
| The Y variable group is explained by the V percentage | 11.28 | 0.11 | 13.62 | 0.21 |
| The Y variable group is explained by the U percentage | 14.86 | 0.1 | 21.36 | 0.07 |
| Serial number | Rule | Support | Confidence |
| 1 | ND==\(\mathrm{>}\)AR | 0.29 | 0.69 |
| 2 | JA ==\(\mathrm{>}\)CR | 0.28 | 0.68 |
| 3 | LA ==\(\mathrm{>}\)CT | 0.28 | 0.67 |
| 4 | BA ==\(\mathrm{>}\)AP | 0.27 | 0.67 |
| 5 | HH ==\(\mathrm{>}\)CR | 0.25 | 0.67 |
| 6 | MD ==\(\mathrm{>}\)MC | 0.25 | 0.65 |
| 7 | ND ==\(\mathrm{>}\)MC | 0.24 | 0.64 |
| 8 | LD ==\(\mathrm{>}\)AC | 0.24 | 0.63 |
| 9 | MD ==\(\mathrm{>}\)CR | 0.23 | 0.61 |
| 10 | ND, BA ==\(\mathrm{>}\)AR | 0.23 | 0.79 |
| 11 | JA, HH ==\(\mathrm{>}\)CR | 0.21 | 0.81 |
| 12 | LD, BA ==\(\mathrm{>}\)AC | 0.20 | 0.81 |
| 13 | LD, MD ==\(\mathrm{>}\)MC | 0.19 | 0.79 |
| 14 | ND, LD, BA ==\(\mathrm{>}\)AR | 0.19 | 0.78 |
| 15 | ND, LD, BA, MD==\(\mathrm{>}\)MC | 0.18 | 0.78 |
In the analysis of the degree of influence between the courses, the Apriori algorithm in Weka was mainly used to find the direct correlation between dance teaching and artistic quality education. The correlation rule between the two is obtained by exploring the frequency of two or more records occurring at the same time. Just for example, the rule: dance teaching A ==\(\mathrm{>}\) art quality education B. Such a rule can get the extent to which the dance teaching content A will affect the art quality education B. Teachers can then find out the interactions between prior and subsequent teaching according to these rules, and find the prior teaching that may affect the students’ subsequent learning effect, so as to instruct the students in a more targeted way to improve the teaching effect. Table 4 shows the correlation rules between college dance teaching and art quality education.
Considering Rule 1 and Rule 2 as illustrative examples, Rule 1 indicates that within a cohort of 173 students, 72 demonstrated effective learning in folk dance. Notably, among these 72 students, 50 also exhibited excellence in aesthetic concepts within the realm of art quality education. The support of this rule is calculated as sup=50/173=0.29, while the confidence is conf=50/72=0.69. Rule 2, on the other hand, asserts that students proficient in jazz dance have a 68% chance of concurrently excelling in creativity within their artistic quality education. These findings underscore the substantial influence of folk dance and jazz dance learning outcomes on aesthetic concepts and creativity education within art quality education. Consequently, students are advised to build a robust foundation in dance courses to facilitate mastery of subsequent art quality education content. Moreover, teachers ought to closely monitor students’ dance course performance during subsequent art quality education, enabling more targeted dance and art quality education interventions.
Through the analysis of the correlation rule between the degree of mutual influence between college dance teaching and college students’ artistic quality education, we not only get the correlation between the two that has been embodied in the actual teaching, but also get some valuable information that seems to be irrelevant but has some connection, which can not only provide certain teaching guidance to the teachers but also make the students more clear about the weak parts they need to strengthen, so as to improve the teaching effect. The information can not only provide teachers with certain teaching guidance, but also make students more clear about the weak parts they need to strengthen, thus improving teaching effect.
This paper delves into the relationship between college dance teaching and the quality education of college students, employing artificial intelligence in conjunction with data mining techniques to uncover the correlation between these two domains and to subsequently propose an optimization pathway for their coordinated development.
Utilizing the SOM-based K-means clustering algorithm, the selected samples were categorized into three groups: excellent (56.6%), average (31.8%), and poor (11.6%). Teachers are advised to prioritize attention towards the third category, comprising students with subpar performance across all dimensions. The correlation analysis revealed coefficients of 0.552 and 0.313 for the first two pairs of typical correlation variables, respectively, contributing cumulatively to 95.4% of the total correlation. This suggests that the primary explanatory factor for the relationship between dance teaching and art quality education in colleges and universities lies within the first pair of variables, with dance teaching exerting a more significant influence on art quality education than vice versa. Furthermore, 15 correlation rules were derived based on dance teaching and art quality education, with each rule exhibiting a support degree exceeding 0.15 and a confidence degree greater than 0.6. These findings enable the practical application of insights into the correlation between dance teaching and college students’ art quality education within real-world teaching contexts.
The majority of theoretical knowledge acquired by university students serves as a supportive framework for the relatively limited proportion of professional skills classes within the curriculum. To situate dance education, a crucial component of holistic quality education for professional dance students, it is imperative to simultaneously enhance its reach among ordinary students on campus. By leveraging the strengths and capabilities of higher education institutions, dance education can play a pivotal role in its popularization and contribute to the cultivation of versatile, high-quality dance talents who exhibit comprehensive development.


