Electrical automation control technology refers to the comprehensive application of information transmission technology and electrical and electronic technology, combined with computer technology, artificial intelligence to improve the automation of electrical control and intelligent level of emerging technologies [1, 2]. At present, in the process of production and life, the application range of electrical automation control technology is relatively wide [3]. Especially in the power equipment operation process, electrical automation control technology are used to ensure that the power system between the different sites of the power operation and maintenance work smoothly, withing a dedicated network of equipment operation and maintenance scheduling. At the same time, the use of computer networking can automatically update the site of the power equipment information [4, 5]. In the power equipment failure, can automatically complete the fault section isolation processing and conversion mode of operation, at the same time issued fault alarm information [6, 7]. In addition, in the application of electrical automation control technology, according to the pre-set program to complete the power plant operation and management, only need to set up the corresponding operation logic in advance in the computer [8, 9].
In the automatic market, the fault defects of the power equipment are identified according to different detection methods, and the better test effect is achieved. Due to the limitation of the detection space of the electric power equipment detection technology in the present stage, it is difficult to locate the fault in the process of detection, and it has a lot of problems facing the actual production process. At the same time, the defect will affect the performance of the power equipment, and when the processing of the image increases, the time of detection will increase, making it difficult to achieve the expected measurement of the expected measurement [10, 11, 12]. Therefore, using the quality detection of electric power equipment, the application of machine vision technology, and the experiment and analysis of the practical situation are of great significance [13].
The continuous improvement of the level of science and technology to promote the modernization of power equipment and digital development [14]. In the development process of the power industry, the relevant resources for rational allocation, reduce enterprise production costs, can improve the operating efficiency of the power system [15]. In the process of power equipment operation, the full application of electrical automation control technology, can play the advantages of computer technology and integration technology, improve the operational reliability and safety of power equipment [16, 17]. At this stage, China’s electric power electronic equipment is mainly automated control, but the current traditional control methods have been unable to meet the current stage of the control needs [18]. In this process, the control advantages of machine vision have been demonstrated, the relevant personnel should focus on machine vision as the basis for the establishment of new power electronic equipment automation control system, in order to strengthen the practicality of the system at the same time, to demonstrate a higher value of the application of automation control system for power electronic equipment [19, 20]. Lou, P. and others have proposed a machine-visual, non-contact monitoring framework, which researchers use sliding window counters to improve the detection efficiency of the target [21]. Rababaah, A. R. and Rababah, A. M. applied the machine vision to the building style monitoring, and used the deep learning method to challenge the problems faced by traditional monitoring, and achieved good results [22].
The study analyzes the automation control needs and challenges of existing power electronic equipment, and clarifies the application value of machine vision in this field. Subsequently, an intelligent power electronic equipment monitoring system based on PLC and IoT technology is designed and realized. The focus is on the application of machine vision technology in power equipment state identification, including image acquisition, processing and analysis. Through experimental verification, the performance and accuracy of the proposed system are evaluated, and the practical application value of machine vision in improving the automation control efficiency of power electronic equipment is discussed.
Through network technology, each power electronic device is connected into a comprehensive functional protection system, which is composed of multiple devices, and data can be exchanged and shared between the devices. This way can realize the cooperative work between the equipment and improve the overall performance and stability of the equipment. The use of network communication technology to realize the collection, accounting, transmission and feedback of information data is a characteristic of the operation of automation technology. Network communication is the key to automation technology, which can realize remote monitoring and control of equipment. This chapter mainly establishes an intelligent power electronic equipment monitoring system based on PLC technology and Internet of Things (IoT) technology, in order to better realize the automation control of power electronic equipment.
A programmable logic controller (PLC) is an electronic system that operates with digital algorithms and is designed for applications in industrial environments. It adopts programmable memory, which is used to store the instructions for logic operation, sequence control, timing, counting and arithmetic operation, etc., and indirectly controls the actuator to complete the production process by inputting and outputting digital signals or analog signals. PLC is characterized by strong anti-interference ability, modular design, small structure, light weight, and strong scalability, which makes it indispensable to the field of automation. PLC consists of a central processor, memory, and a controller.
PLC consists of a central processor, memory, and input and output interfaces, PLC adopts the scanning mode of operation, repeated execution of the program, that is to say, the PLC to scan the way to execute the program statement one by one, but after the end of the program statement, does not stop. Instead, it starts scanning again from the beginning and repeats until it stops or switches from RUN to STOP.
PLC workflow shown in Figure 1, its mode of operation can be summarized as “sequential scanning, cyclic”, there are running and stopping two states during operation. When the PLC is in the “running” state, the CPU central processor will start scanning from the program memory instruction by instruction to carry out logical operations, if the scanning to interrupt or jump instruction, it will save the scene and enter the interrupt or jump to the car program, otherwise, it will be taken one by one until the last instruction to execute the last instruction jump back to the first instruction to start a new round of scanning operation.
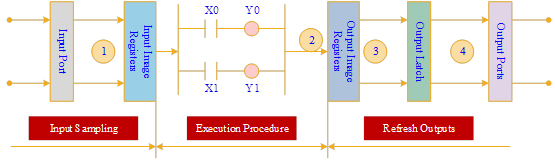
When the program enters the input sampling stage, the PLC first reads the high and low level signals or data on the input port into its internal input image register, and even if the value on the input port is changed during a scan cycle, it will not affect the value stored in the input image register. After completing this phase, the PLC enters the program execution phase, so for the pulse signal input to the PLC to be read by the PLC in real time, the width of the pulse signal must be greater than one PLC scan cycle.
In the program execution phase, the CPU scans the ladder program written by the user sequentially from top to bottom and from left to right. Each line of the ladder statement usually starts from the control line consisting of normally open/closed contacts located on the left, and then sequentially starts the logic operation after fetching the data to the right, and saves the result into the output image register. During the execution phase of the program, the values in the input image registers remain constant, while the resultant values in the output image registers change at any time as a result of program operation. Therefore, the calculation results of the preceding program will affect the output results of the following program, and the running results of the ladder program at the back of the position need to wait for the next cycle of scanning to play a role.
The output refresh stage is the third stage of program operation, in which the CPU refreshes the output port according to the status and information in the output impact register and stops the execution of the other stages to drive the devices directly associated with the output port.
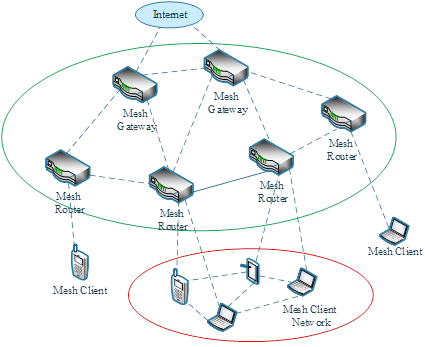
Within the IoT network, all kinds of sensors, controllers, RFID readers, industrial instrumentation and other functional terminals are diverse and widely distributed, and all kinds of transmission networks are highly heterogeneous, with dynamically changing network fingerprints. Therefore, establishing a reliable and stable transmission path within the system is one of the core issues of IoT. In view of the above characteristics of IoT, realizing real-time reliable transmission of dynamic multi-tasking and high traffic data requires the construction of a complex, low-consumption, high-speed, high-reliability, wide-coverage IoT transmission network. In this paper, based on the wireless Mesh network structure, the IoT network transmission structure is constructed to provide a guarantee for realizing the fast and reliable transmission of intelligent power electronic equipment data.
The IOT transmission network structure combined with Mesh network is shown in Figure 2, which has the advantages of high reliability and large network capacity of backbone network and flexible multi-hop and deployment of client-type network at the same time. If divided by levels, the backbone network composed of mesh routers can be regarded as the upper layer network, and the mesh clients constitute the lower layer network of clients through wireless multi-hop. In the hybrid network, the wireless terminals can relay data through the backbone mesh router, and can also establish the transmission path through the wireless multi-hop network between the terminals.
Intelligent power facilities are composed of several parts, one of which is the intelligent power monitoring system, which can effectively reflect the intelligence of power equipment. The system applies modern control technology, visualization technology, modern communication technology and Internet of Things technology, based on different auxiliary facilities intelligent monitoring of power equipment hotspots, power, environment, etc., and can intelligently analyze the data, comprehensive visualization display, intelligent linkage alarm, access to integrated automation system, PMS, ERP control module information. Effectively assist in the informatization, overhaul and operation of power equipment, serving the smart grid large overhaul, large operation, full life cycle management.
Figure 3 shows the basic architecture of intelligent power monitoring system based on IoT technology, which is mainly based on the intelligent power facility architecture to the station control layer, interval layer and process layer of intelligent power facilities into the IoT technology. Different communication strategies are used to send data to realize the intelligent maintenance assistance, power and environment monitoring and other functions of IoT-based power equipment, and to assist in supporting the interaction, automation and informatization of intelligent power facilities.
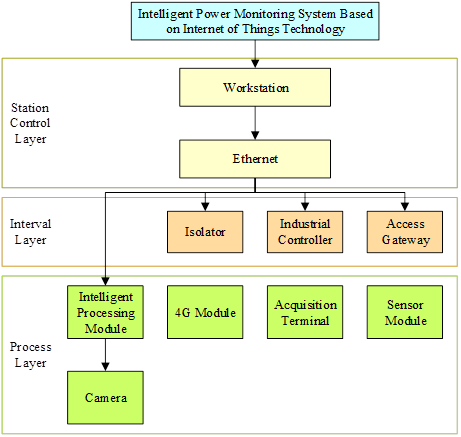
The process layer utilizes different sensors for status information acquisition, while wireless, RS-485 bus and other communication means are used to send data. The interval layer can aggregate monitoring data and send interactive control information in real time by combining PLC technology, and the access strategies of all subsystems are all IEC61850 statutes. The station control layer is responsible for data reception, data research and judgment, linkage alarm and display (visualization). The system platform is also capable of interconnecting data using comprehensive automation systems and single isolation devices.
Power industry as the mainstay of social and economic construction, to promote the high-quality development of the power industry has become a major factor in helping social and economic development. Whether the power system can be safe and stable operation, directly related to the development of the national economy. Various power equipment in the daily operation of the process is extremely easy to be interfered by a variety of factors, once the power equipment failure, it is very easy to affect the overall stability of the power system. The application of machine vision technology can comprehensively utilize image information technology to analyze the relevant data, based on machine vision for power equipment identification, can really establish intelligent, automated monitoring system. This chapter mainly introduces the application of machine vision related technology in the monitoring system of power electronic equipment, to provide a basis for realizing the automatic control of power electronic equipment.
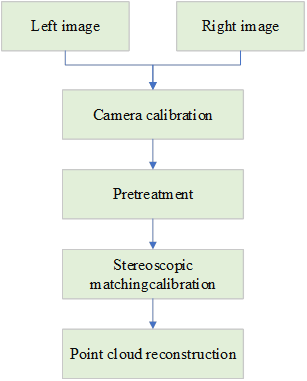
Intelligent power electronic equipment monitoring system can realize the real-time sharing of the data of each electronic equipment in the local area network, relying on the video monitoring screen can realize the online monitoring of power equipment. In the image acquisition process of power electronic equipment, binocular vision sensors work similarly to human eyes, and the image it collects not only contains the color characteristics of the object. It can also be used to extract the three-dimensional information of the target, and the acquisition of three-dimensional information requires the establishment of an accurate mathematical model to describe its imaging principle.
The binocular cameras applied in the monitoring practice of power electronic equipment always fail to achieve the situation of ideal binocular vision model due to the installation and manufacturing process. There are rotations between the two cameras in addition to the necessary translations, so stereo correction of the captured images is needed to satisfy the polyline geometric constraints.
In this paper, stereo correction is performed using the Bouguet algorithm, which requires the input of a rotation matrix and a translation vector between the two cameras, which can be derived from the binocular stereo calibration algorithm. The binocular stereoscopic model structure is shown in Figure 4.
The binocular stereo vision calibration algorithm is used to find the specific values of the rotation matrix \(R\) and translation vector \(T\) between the two cameras. Suppose that there exists a point \(P_{w}\) in the world coordinate system and its corresponding points under the left and right camera coordinate systems are \(P_{l}\), \(P_{r}\). The relationship between these two points is, \[\label{GrindEQ__1_}\tag{1} P_{r} =R\left(P_{l} -T\right).\]
Assuming that the outer references of the two pinhole cameras are \(R_{l}\), \(T_{l}\), \(R_{r}\), \(T_{r}\), the corresponding points in the world \(P_{w}\) in the coordinate system of the left and right cameras are: \[\label{GrindEQ__2_}\tag{2} \left\{\begin{array}{l} {P_{l} =R_{l} (P_{w} -T_{l} )} \\ {P_{r} =R_{r} (P_{w} -T_{r} )} \end{array}\right.\]
The two equations in the coupling 2 are obtained by eliminating \(P_{w}\), \[\label{GrindEQ__3_}\tag{3} P_{r} =R_{r} R_{l}^{T} \left[R_{l} -R_{l} \left(T_{r} -T_{l} \right)\right].\]
Comparison with Eq. 1 gives, \[\label{GrindEQ__4_}\tag{4} \left\{\begin{array}{c} {R=R_{r} R_{l}^{T} } \\ {T=R_{l} \left(T_{r} -T_{l} \right)} \end{array}\right.\]
Since the external parameter matrices of the left and right cameras can be solved by the monocular camera algorithm, the parameters on the right-hand side of the middle sign in Eq. 4 are known and can be used directly to calculate the rotation and translation parameters of the binocular camera.
The Bouguet correction algorithm accomplishes stereoscopic correction by reprojection, which will inevitably result in aberrations. In order to minimize such aberrations, it is first necessary to split \(R\) into a sum over the two cameras into rotation matrices \(r_{l}\) and \(r_{r}\), so that each camera is rotated by half to minimize the aberrations generated by the rotation, and to satisfy the condition that the two imaging planes are coplanar and the optical axes are parallel after the rotation. However, the rotation does not satisfy the polyline geometry, and a matrix \(R_{rect}\) needs to be constructed to transform the poles of the left camera to infinity so that the poles are horizontally aligned, and so that each pixel row of the left and right images are parallel and aligned. To compute this matrix, first define a vector \(e_{1}\) as, \[\label{GrindEQ__5_}\tag{5} e_{1} =\frac{T}{\left\| T\right\| } ;T=\left[\begin{array}{ccc} {T_{x} } & {T_{y} } & {T_{z} } \end{array}\right]^{T}.\]
Define another vector \(e_{2}\), choose the direction in which the result of the cross-multiplication of \(e_{1}\) with the camera’s optical axis direction vector is \(e_{2}\), and normalize it. \(e_{2}\) can be used as another unit vector then \[\label{GrindEQ__6_}\tag{6} e_{2} =\frac{1}{\sqrt{T_{x}^{2} +T_{y}^{2} } } \left[\begin{array}{lll} {-T_{y} } & {T_{x} } & {0} \end{array}\right]^{T}.\]
Finally, define a vector \(e_{3}\) perpendicular to \(e_{1}\) and \(e_{2}\), i.e., \({\rm e}_{3} =e_{1} \times e_{2}\). Using these three vectors it is possible to construct the matrix \(R_{rect}\) that transforms the camera poles to infinity, mathematically described as, \[\label{GrindEQ__7_}\tag{7} \left\{\begin{array}{c} {R_{rect} =\left[\begin{array}{lll} {e_{1}^{T} } & {e_{2}^{T} } & {e^{t} } \end{array}\right]^{T} } \\ {R_{l} =R_{rect} r_{l} } \\ {R_{r} =R_{rect} r_{r} } \end{array}\right.\] where \(R_{l}\), \(R_{r}\) are the rotation matrices of the left and right cameras, and the stereoscopic correction can be accomplished by multiplying the camera coordinate systems of the left and right cameras by the corresponding overall rotation matrices.
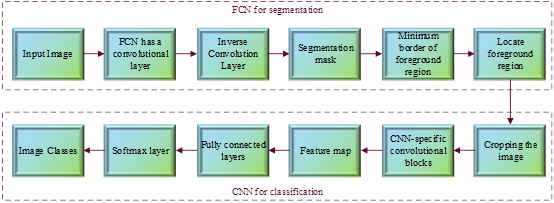
In this paper, a two-stage deep learning approach is used in order to extract and classify the foreground region of power electronic switchgear images so as to realize the preprocessing of foreground target classification in the detection task. The image recognition process based on FCN-CNN is shown in Figure 5. The foreground region in the input image is automatically segmented using FCN, which can be regarded as a binary classification, and the foreground region in the image is detected by obtaining the smallest rectangular box around the segmented region, and the image is cropped. The cropped image is then used to learn a robust CNN for species differentiation to achieve classification and recognition of foreground region images. In this paper, VGG-16 is chosen as the network prototype to construct segmentation FCN as well as classification CNN, and the maximum pooling Dropout strategy is used in the pooling layer to improve the generalization performance.
Scale Invariant Feature Transform (SIFT) algorithm is an algorithm for machine vision to detect and characterize the local features of an image, which finds the extreme point in the spatial scale and is able to find out the position, scale and rotational invariants of that extreme point. Therefore SIFT feature points are invariant quantities for scale transformations and rotational transformations of the image, and at the same time have a better adaptation to light and noise, etc.
Applying the 2D image \(I(x,y)\) to a scale space of different scales yields \(L(x,y,\sigma )\). \(L(x,y,\sigma )\) calculated as, \[\label{GrindEQ__8_}\tag{8} L(x,y,\sigma )=G(x,y,\sigma )*I(x,y),\] where \(G(x,y,\sigma )\) is the two-dimensional Gaussian kernel function, then \[\label{GrindEQ__9_}\tag{9} G(x,y,\sigma )=\frac{1}{2\pi \sigma ^{2} } {\rm e}^{-\left(x^{2} +y^{2} \right)/2\sigma ^{2} },\] where, \(x,y\) are the coordinates of the points and \(\sigma\) is the variance of the Gaussian normal distribution.
The DOG pyramid of the image is constructed and the extreme points are detected in 26 neighborhoods of the DOG scale space. \(D(x,y,\sigma )\) is the difference between 2 neighboring image scales, calculated as: \[\label{GrindEQ__10_}\tag{10} G(x,y,\sigma )=G(x,y,k\sigma )-G(x,y,\sigma ).\]
If a point is the maximum or minimum of 8 points in the neighborhood of its own scale and 18 points in the neighborhood of the upper and lower scales, for a total of 26 neighborhood points, the point is determined to be an extreme point at that scale.
Using the gradient direction distribution characteristics of the pixels in the neighborhood of the feature point, the direction parameter is specified for each feature point, and the calculation formula is, \[\label{GrindEQ__11_}\tag{11} m(x,y)=\sqrt{(L(x+1,y)-L(x-1,y))^{2} +(L(x,y+1)-L(x,y-1))^{2} } ,\] \[\label{GrindEQ__12_}\tag{12} \theta (x,y)=\arctan \{ [L(x,y+1)-L(x,y-1)/L(x+1,y)-L(x-1,y)]\} ,\] where \(m(x,y)\) is the modulus of the gradient at point \((x,y)\), \(\theta (x,y)\) is the direction of the gradient at point \((x,y)\), and \(L\) is the scale at which the keypoint is located. The generated SIFT feature vectors are rotated in the direction of the feature points by rotating the axes to ensure rotational invariance.
For image recognition, feature extraction is required to obtain better descriptive information. For this, scale invariant feature transform algorithm is used to extract features. This algorithm extracts image features based on multi-scale perspective and ensures the stability and uniqueness of the features. The application steps of the scale invariant feature transform algorithm are as follows;
Step 1: Construct the scale space and search for the key points of the image at different locations and scales. Specifically by building a Gaussian pyramid, search for key extreme points in Gaussian difference images.
Step 2: Detect the spatial extremes, find out the sub-pixel accuracy coordinates of the corresponding key points, and filter out the unstable key points, and the final key extreme points obtained are the feature points.
Step 3: Calculate the gradient characteristics of the neighborhood of the feature point, construct the neighborhood gradient histogram, and obtain the optimal direction value, i.e., the main direction of the feature point.
Step 4: Solve the feature vector and calculate the value vector of the histogram of the gradient direction of the pixels near the feature point.
Through the scale-invariant feature transformation algorithm, select a 16*16 region around the feature point, divide it into 4*4 subregions, and perform the gradient histogram statistics respectively to generate the feature vector with the dimension of [4,4,8].
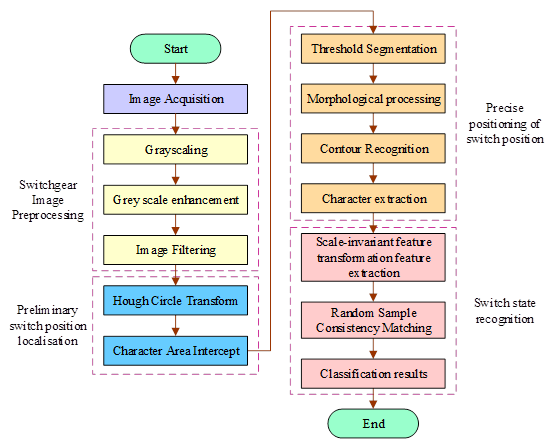
The method flow of machine vision-based switch state recognition for power electronic equipment is shown in Figure 6, which mainly includes the following four steps;
Step 1: Switchgear image preprocessing. The original switchgear image contains more interference information and less effective information. In order to facilitate further extraction of device state indicator features, the original image needs to be preprocessed to minimize the influence of noise information and improve the image signal-to-noise ratio.
Step 2: Preliminary localization of switch position. After the original image is preprocessed, if the global feature extraction is carried out directly, the complexity of the algorithm will be too high, coupled with the features are more scattered, and it is not possible to identify the effective indicator character features. Therefore, it is necessary to carry out preliminary localization of the region where the indicator is located, and then carry out character feature extraction, in order to accurately identify the switch state in real time.
Step 3: Accurate localization of switch position. In the rough region of the indicator obtained in Step2, there is still some interference information, which affects the accuracy of recognition. As a result, when performing character feature extraction, it is necessary to accurately localize to the region that contains only switch characters.
Step 4: Switch state recognition. After obtaining the precise position of the switch, the extracted character features are described and matched with the produced template character image, and then the state of the switch is judged according to the matching results.
Electrical automation control technology refers to the comprehensive application of information transmission technology and electrical and electronic technology, combined with computer technology, artificial intelligence to improve the automation of electrical control and intelligent level of emerging technologies. In the operation of power electronic equipment, the full application of automation control technology can give full play to the advantages of computer technology and integration technology, and improve the operational reliability and safety of power electronic equipment. This chapter mainly focuses on the testing of the relevant technology given in the previous section to verify the effectiveness of the given method to improve the automation control of power electronic equipment.
For the equipment switch feature matching method based on the SIFT algorithm proposed in this paper in the intelligent power electronic equipment monitoring system, this experiment takes into account the real-time and accuracy requirements of visual localization, and selects the number of correctly matched points and the running time as the evaluation criteria of the algorithm performance.
In order to verify the effectiveness of this paper’s method, the SIFT algorithm of this paper is compared with the fast robust feature algorithm (SURF), the rotationally invariant feature algorithm (ORB), the binary scale invariant feature algorithm (BRISK), and the fast retinal feature algorithm (FREAK). For the experimental data, the relevant image set of a substation video surveillance is selected, which consists of 200 sets of data, and in this paper, the surveillance images under different conditions are selected for feature matching. In each matching, the five algorithms are assigned 5, 4, 3, 2, and 1 points in terms of the number of correct matches in descending order, and 0 points if there is no correct match. The resulting scores of the five algorithms in terms of the number of correct matches under different conditions are shown in Table 1. The data in Table 1 shows that:
All five algorithms can obtain a certain number of correct matches under the conditions of light transformation, fuzzy transformation, rotation transformation, scale transformation and viewpoint transformation.
The SIFT algorithm obtains the highest total score for the number of correct matches for power electronic equipment open light recognition, which is 2291, 2.48 times higher than the BRISK algorithm with the lowest number of correct matches. And it also obtained the highest score in each of the five conditional transformations. It shows that, on the whole, the SIFT algorithm has the most ideal matching quality and can adapt well to light transformation, fuzzy transformation, scale transformation and viewpoint transformation, so it can accurately obtain the state of the power electronic equipment switch under different environmental conditions, and provide accurate data support for timely switch control of power equipment.
The SURF algorithm obtains the second highest total score of 1676, which is 26.84% lower than that of the SIFT algorithm, but it has better quality in matching under the conditions of illumination transformation, rotation transformation and scale transformation. It shows that on the whole, the algorithm has better matching quality, and it is more suitable for open light feature extraction of power electronic equipment under illumination transformation, rotation transformation and scale transformation.
The overall score of BRISK algorithm is only 659, which is the lowest score under all five matching conditions. It reflects that from the point of view of the number of correct matches, its feature extraction effect is poor, and it cannot effectively realize the accurate matching of the switching state of power electronic equipment.
| Condition | SIFT | SURF | ORB | BRISK | FREAK |
|---|---|---|---|---|---|
| Light transformation | 421 | 351 | 392 | 115 | 279 |
| Fuzzy mapping | 515 | 237 | 386 | 160 | 253 |
| Rotation transformation | 435 | 418 | 182 | 153 | 348 |
| Scale transformation | 492 | 351 | 378 | 104 | 262 |
| Viewpoint transformation | 428 | 319 | 354 | 127 | 235 |
| Total score | 2291 | 1676 | 1692 | 659 | 1377 |
In order to verify that the method in this paper has both good matching correctness and high matching efficiency, the running time of the algorithms is further verified in this paper by assigning scores from 1 to 5 to each of the five algorithms in terms of matching time from slow to fast. Table 2 shows the matching speed scores obtained by the five algorithms in different matching conditions.
From the data in the table, it can be clearly seen that the matching speed score of SIFT algorithm given in this paper is 2388, which is 195.54%, 33.11%, 88.63% and 90.58% higher than the other four algorithms respectively. This reflects that the method in this paper has obvious advantages in matching speed, and can realize efficient matching of power electronic equipment on the basis of ensuring correct matching, providing help for the automated and efficient control of power electronic equipment.
| Condition | SIFT | SURF | ORB | BRISK | FREAK |
|---|---|---|---|---|---|
| Light transformation | 477 | 183 | 374 | 248 | 306 |
| Fuzzy mapping | 491 | 157 | 358 | 226 | 212 |
| Rotation transformation | 463 | 164 | 349 | 207 | 295 |
| Scale transformation | 482 | 145 | 362 | 293 | 202 |
| Viewpoint transformation | 475 | 159 | 351 | 292 | 238 |
| Total score | 2388 | 808 | 1794 | 1266 | 1253 |
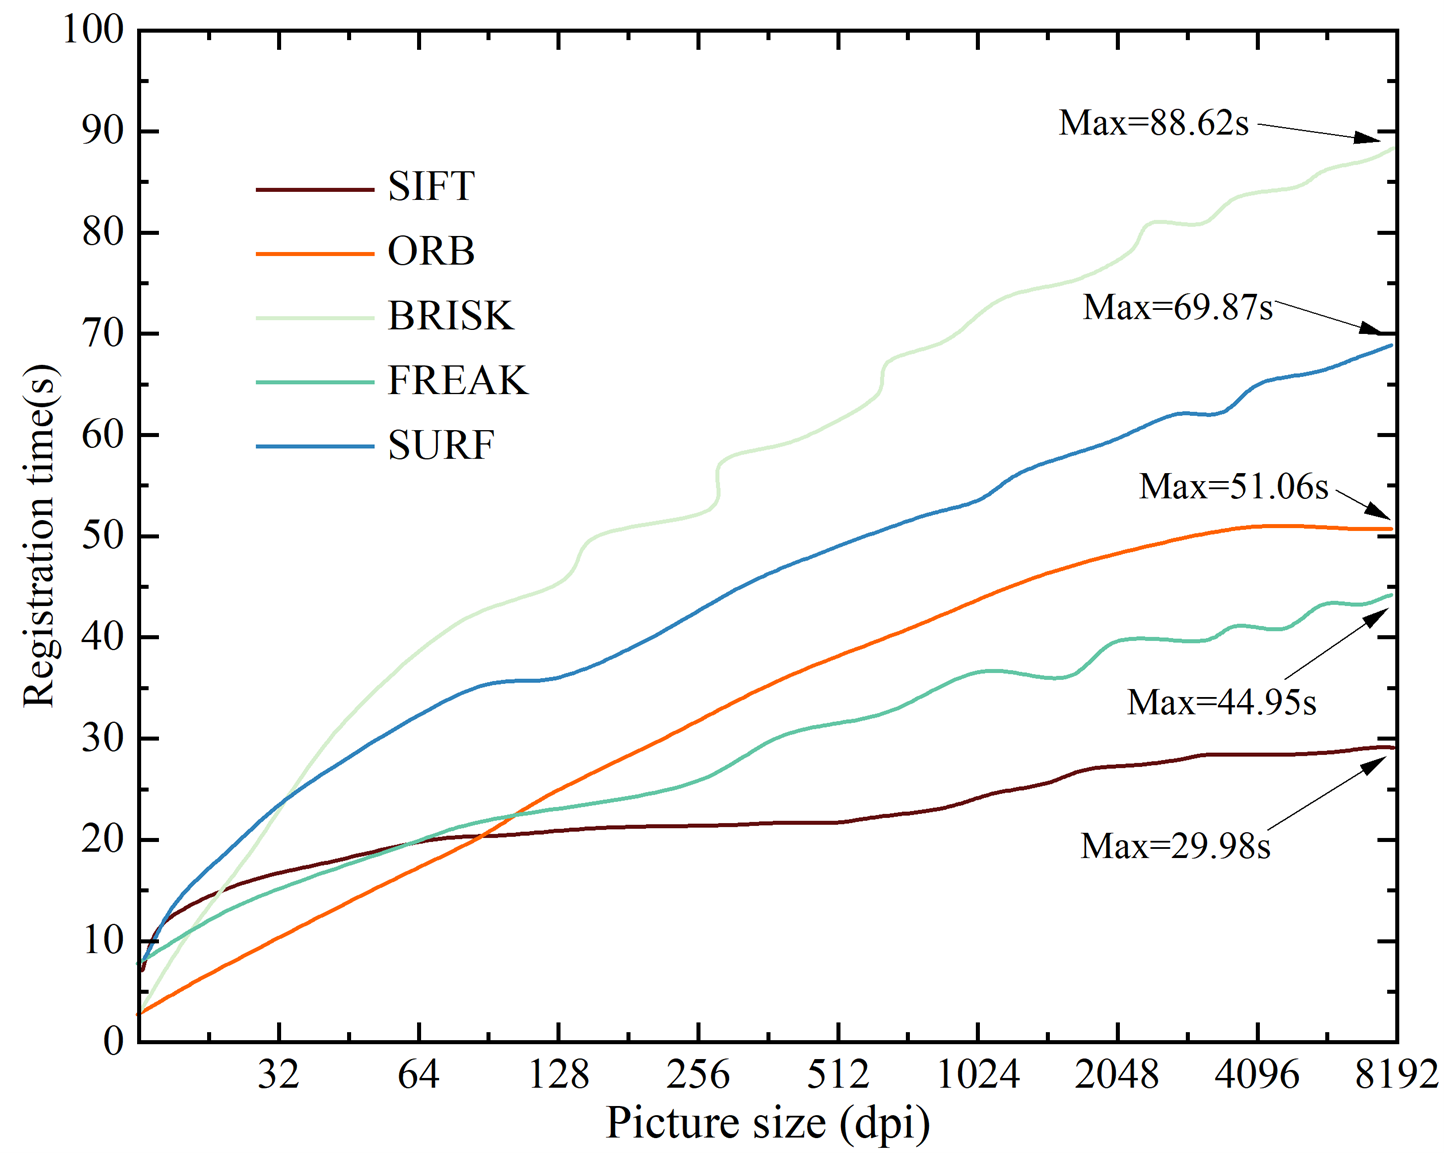
In order to further illustrate the switching image alignment time of the algorithms in this paper for power electronic devices, the switching image alignment time of the five algorithms is tested in this paper for different resolutions. The image alignment times of different algorithms are shown in Figure 7.
From the experimental results, with the gradual increase of the resolution of the switch state monitoring image of power electronic equipment, the image alignment time of this paper’s method grows from 7.17s to 29.98s, and after the image resolution reaches 2048 dpi, its image alignment time remains at about 29.8s and tends to be stable. The image alignment time of the other four algorithms increases with the increase of resolution, and the maximum image alignment time of the method in this paper even reaches 88.62s, which is far more than the high-efficiency image alignment requirements of power electronic equipment. This shows that using the method given in this paper for image target detection can make the detection time shorter, and the image alignment process can maintain a relatively stable state with the change of image size. Under the same resolution, the switching state of the power electronic equipment can be detected quickly, which improves the real-time nature of the detection method, and provides assistance for the timely development of automated real-time control of power electronic equipment.
In order to comprehensively evaluate the recognition effect of power electronic equipment switch images, the effectiveness of the FCN-CNN image recognition classification method established in this paper is examined, and the model is evaluated by five indexes: precision rate, recall rate, F-Measure, PWC and MCC. Where PWC indicates the percentage of the number of misclassified samples to the total number of samples, and MCC indicates the sensitivity when the sample categories are unbalanced.
In this paper, we select the commonly used YOLOv3 target detection model, Cascade CNN model, FgSegNet-M model, FgSegNet-S model, ResNet50, and DenseNet model to compare with this paper’s method, and use the large dataset FBO-Data and the homemade dataset, and set the switch states to 0 and 1, respectively indicating switch disconnection and closure. Tables 3 and 4 show the experimental results of different methods on different datasets, respectively.
Whether it is a large dataset or a homemade dataset, the deep learning binary image recognition classification model obtained by combining FCN and CNN model in this paper outperforms the other six types of models, in which the PWC is only 0.0841, which is 21.25% lower than the best Cascade CNN model among the rest of the six, and the MCC value is 0.9946.The value range of MCC is [-0.1], and the value range is [-2]. Value ranges from [-1,1], and converging to 1 indicates that all pixels of the image are correctly classified. In this paper’s method for power electronic equipment switch recognition, the FCN network is used to automatically segment the foreground convergence of the image so that it can detect power electronic equipment switches by the minimum rectangular box, and then the cropped image is introduced into the robust CNN for species differentiation, which effectively improves the model’s tolerance to the background nuances and the perception of foreign objects with different morphologies, thus improving the overall accuracy.
From the test results of the large dataset to the homemade dataset, the PWC and MCC of this paper’s method are improved, the PWC decreases from 0.0841 to 0.0564, which is a decrease of 32.94%, while the MCC increases from 0.9946 to 0.9993, which is an increase of 4.73%. In homemade dataset in this paper adaptive criteria for power electronic equipment switches to enable full learning on the dataset, while on large datasets because of the increase in image details so the effect produces a certain degree of degradation. Increasing the network size and training time in the FCN-CNN model can effectively reduce the error caused by the increase in image details.
In the course of the study, other relevant factors of the identification effect include the fact that some images require human eyes reading, the experimental measure is not high enough, the image background is too complex. In order to solve these problems, we can consider introducing auxiliary calibration tools such as GPS systems, and use professional digital cameras to enrich the details of high contrast. Thus, the image of higher quality can be obtained in the later treatment, and the effect of the recognition is optimized.
Combining the above results, it can be seen that the FCN-CNN model given in this paper can effectively realize the accurate classification of the switch images of power electronic equipment, thus helping the intelligent power electronic monitoring system to clarify the switch state, providing a reference for realizing the automated control of the switch of the power electronic equipment, and improving the operational efficiency of the power equipment.
| Model | ACC | REC | F-Measure | PWC | MCC |
|---|---|---|---|---|---|
| This article | 0.9867 | 0.9824 | 0.9951 | 0.0841 | 0.9946 |
| YOLOv3 | 0.9196 | 0.9279 | 0.9488 | 0.1915 | 0.9772 |
| Cascade CNN | 0.9112 | 0.9197 | 0.9646 | 0.1068 | 0.9196 |
| FgSegNet-M | 0.9215 | 0.9443 | 0.9187 | 0.2026 | 0.9741 |
| FgSegNet-S | 0.9159 | 0.9528 | 0.9233 | 0.2263 | 0.9268 |
| ResNet50 | 0.9384 | 0.9502 | 0.9395 | 0.2017 | 0.9763 |
| DenseNet | 0.9273 | 0.9315 | 0.9371 | 0.1341 | 0.9684 |
| Model | ACC | REC | F-Measure | PWC | MCC |
|---|---|---|---|---|---|
| This article | 0.9982 | 0.9967 | 0.9974 | 0.0564 | 0.9993 |
| YOLOv3 | 0.9339 | 0.9371 | 0.9571 | 0.1524 | 0.9871 |
| Cascade CNN | 0.9354 | 0.9292 | 0.9692 | 0.1015 | 0.9392 |
| FgSegNet-M | 0.9279 | 0.9543 | 0.9215 | 0.1489 | 0.9815 |
| FgSegNet-S | 0.9237 | 0.9649 | 0.9494 | 0.1506 | 0.9493 |
| ResNet50 | 0.9398 | 0.9655 | 0.9398 | 0.1183 | 0.9796 |
| DenseNet | 0.9386 | 0.9427 | 0.9527 | 0.1147 | 0.9727 |
In order to verify the effectiveness of the SIFT algorithm given in this paper in the power electronic equipment switch opening and closing state recognition, this paper field collected a total of 300 switch images of power electronic equipment in a substation, of which 153 switch images in the disconnected state and 147 switch images in the closed state. The method given in this paper is compared with the linear discrimination method, the laser induction discrimination method, and the adaptive discrimination method for switch state recognition, and the results are shown in Table 5.
From the perspective of the switch state recognition effect of different methods for power electronic equipment, the misidentification/rejection rate of this paper’s method is only 1.36% and 1.96% for power equipment switches in the disconnected and closed states, which is better than the switch state recognition accuracy obtained by the other three methods, which is above 98%. Relying on the FCN-CNN model for power electronic equipment switch image segmentation and classification can effectively obtain the switch state, and through the SIFT algorithm to extract the open light state feature points for matching, and then realize the state recognition of power electronic equipment switch. Using the method given in this paper, the switch state of power equipment can be clarified in the intelligent power electronic equipment monitoring system, which can help optimize the supply of power equipment, prolong the service life of power equipment, and reduce the power maintenance cost of power supply enterprises.
| Open and close state | Method | Actual value | Test value | Miss knowledge / rejection | Precision |
|---|---|---|---|---|---|
| Close | This article | 147 | 145 | 2 | 98.64% |
| Straight line discrimination | 147 | 136 | 11 | 92.52% | |
| Laser induction discrimination | 147 | 138 | 9 | 93.88% | |
| Adaptive discriminant | 147 | 131 | 16 | 89.12% | |
| Break | This article | 153 | 150 | 3 | 98.04% |
| Straight line discrimination | 153 | 143 | 10 | 93.46% | |
| Laser induction discrimination | 153 | 147 | 6 | 96.08% | |
| Adaptive discriminant | 153 | 139 | 14 | 90.85% |
This system combines PLC and IoT technologies to realize the effective monitoring of power electronic equipment. In the experiments, machine vision technology used for equipment state identification shows an accuracy rate of up to 98%, much higher than the accuracy rate of about 80% in traditional monitoring methods, and this significant improvement is attributed to the high-precision image processing capability of machine vision technology.
By comparing the SIFT algorithm with other commonly used algorithms (e.g., SURF, ORB, BRISK), SIFT performs the best in switch status recognition. the SIFT algorithm’s score for the number of correct matches is 2,291, which is much higher than that of the BRISK algorithm (0.659). This data fully demonstrates the stability and efficiency of the SIFT algorithm in processing complex images. The SIFT algorithm also performs well in processing time. In tests at different resolutions, the processing time of the SIFT algorithm ranged from 7.17 to 29.98 seconds, adapting to image resolutions from low to high, while the other algorithms took up to 88.62 seconds at high resolutions. The results show that while maintaining high accuracy, the SIFT algorithm also maintains a fast processing speed, providing a reliable guarantee for real-time monitoring.
In terms of overall system performance, the intelligent monitoring system combined with machine vision not only improves the monitoring accuracy of power electronic equipment, but also enhances the overall performance of the system through data sharing and synergistic effects among devices. The system proves its reliability and effectiveness in practical application through stable operation in different environments. The application of machine vision technology in the field of automation and control of power electronic equipment shows significant advantages, improves the accuracy and efficiency of monitoring, and also realizes rapid response through the optimization of algorithms, which is of great significance to the modernization and technological progress of the entire power industry.
The development of machine vision technology is becoming more and more powerful, the fingerprint recognition of mobile phones in life, the facial recognition of the work in the work, the recognition of the camera on the traffic camera, the monitoring of the industrial production, the state monitoring, the fault diagnosis and so on. There are more and more methods of machine vision. In this paper, the recognition method of the power device switch state is just one idea. There are also more possible intelligent methods for the same problem, such as developing rapid in-depth learning in recent years. Combining the depth learning algorithm into the visual robot of the scene can have a good prospect. In future scientific research, the image recognition will be more and more intelligent, and the monitoring of power equipment will be more and more important in the failure of electric power.


