In the context of the development of higher education and the deepening of the reform of the security management system, the laboratory in colleges and universities is becoming more and more prominent, not only to carry out teaching and scientific research experiments, but also for the community to cultivate high-quality and innovative scientific and technological talents, the main base for the development of new technologies and theories, the important birthplace of new theories [1, 2]. colleges and universities in order to meet the needs of the development of the society continues to move towards the transformation of the comprehensive university, the new research specialties and directions at the same time, the number of enrolment and the scope of expansion, so that the laboratory type tends to be more diversified [3, 4]. As a result, the use of laboratory equipment and materials, such as shuttle, new types of diverse, and in order to reduce losses and rational use of resources to increase the shared services of laboratory equipment, personnel mobility is more and more frequent and complex, so as to increase the type and number of sources of risk and the enormity of the safety management work [5, 6]. Due to the inherent properties of pressure vessels, extraction and purification, synthesis, sterilization, heating and drying and other hazardous equipment, as well as the existence of hazardous chemicals themselves flammable, explosive, corrosive, highly toxic and other special properties, the experimental process is often required to meet the higher environmental conditions and protection requirements, especially high temperature, high pressure, vibration, radiation, microbial strains [7, 8]. During the operation of the experiment, hazardous equipment and hazardous chemicals are used together to bring about the danger is not a simple superposition, but will produce a kind of 1 + 1 \(\mathrm{>}\) 2 effect, breeding more complex project content, more unknown risk factors, once the accident, the severity of the consequences of the immeasurable [9, 10]. Digital twin is the use of a virtual copy of the laboratory to simulate and monitor the operation of the laboratory [11]. This technique can help laboratory managers to understand the safety of the laboratory in real time and take measures to deal with the potential security threats in time, and the traditional safety management style is time-sensitive, and if the treatment is less than that, it can cause serious safety accidents, and the use of digital microtechnology can be largely avoided [12, 13].
From 2001 to 2010, due to the lack of attention to laboratory safety management in Chinese colleges and universities and the lack of a perfect management system, the number of laboratory accidents in Chinese colleges and universities has shown a significant overall growth trend, which has had a serious negative impact on society [14]. After 2010, national and local governments have paid more attention to laboratory safety management, on the one hand, they have formulated standards related to laboratory safety management in colleges and universities, on the other hand, they have also enhanced laboratory safety education at the school level [15, 16]. As a result, accidents in laboratories in colleges and universities have been reduced [17]. Therefore, it is especially important to study the law of laboratory accidents in colleges and universities, and to deeply investigate the root causes leading to laboratory accidents, which is particularly important for the intelligent control model of laboratory safety risks in colleges and universities [18, 19].
Literature [20] based on digital Li Sheng technology, through artificial intelligence decision and intelligent Li Sheng realization to simulate different scenarios and create situations, intelligent university management, encourage students to learn and promote learning. Literature [21] explores the school-enterprise collaborative research and development strategy by combining the digital Li Sheng technology and differential game method, and with the help of Berman’s continuous dynamic planning theory, the school-enterprise collaborative research and development can achieve dynamic balance and get the optimal benefits. Literature [22] virtual modeling, process monitoring, diagnosis and optimization control are integrated, and then the adaptive function is used to identify unknown model parameters, and a robust monitoring and diagnosis system based on digital twin technology is designed. Finally, it is applied to find that this method can ensure the stable and safe control performance during equipment failure.
In this study, the virtual simulation environment of university laboratories based on digital twin technology is constructed to realize the digital mapping of laboratory equipments, operation processes and environments, the DEMATEL-ISM method is used to identify and analyze the safety risk factors in the laboratories, and the FTA method is combined to construct the fault tree of the laboratory safety accidents in order to comprehensively assess the safety risks of the laboratories. In addition, several university laboratories are selected as research objects to assess the practical application effect of the intelligent control model of laboratory safety risk. Based on the research results, corresponding safety management and improvement suggestions are proposed to achieve the goal of improving the efficiency and accuracy of safety management in college laboratories.
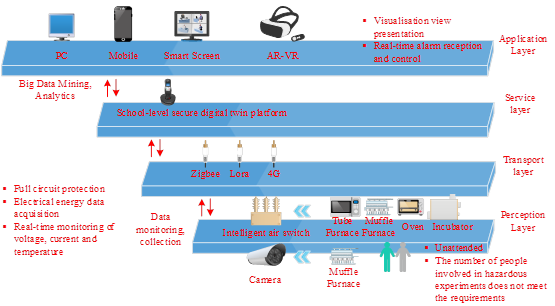
The digital space requirements of university laboratories based on digital twins include equipment management, operation and maintenance management, energy management, personnel management, and integration of laboratory resources. Figure 1 shows the architecture of the intelligent supervision system of university laboratories based on digital twins, which consists of a perception layer, a transmission layer, a service layer, and an application layer architecture to realize the digital twin system’s data acquisition/fusion, transmission, modeling and simulation, and functional interaction processes. Among them, the perception layer is the system’s foundation and data source, and the perception layer hardware structure mainly consists of various sensors, instruments, field control systems, mobile terminals, equipment tags, host computers, and various types of execution units. Among them, the perception layer is the foundation of the system and the source of data, the hardware structure of the perception layer mainly consists of various types of sensors, instruments, field control systems, mobile terminals, equipment labels, host computer and various types of execution units. the transmission layer uploads data such as the status of multi-brand, multi-interface and multi-protocol equipment to the server through a variety of communication protocols. the service layer is responsible for the virtual mapping of data in the perception layer. The application layer is now transparent operation, fault problem reproduction and simulation, to meet the laboratory manager of high temperature equipment traceability analysis, real-time monitoring and fault diagnosis and other needs.
Colleges and universities need to set up a professional laboratory risk assessment organization, the members of the assessment organization need to be professionally trained, with the identification of sources of danger, risk assessment and occupational health assessment capabilities. members of the assessment organization according to the functions and characteristics of their respective laboratories to develop a scientific laboratory risk assessment program, combined with the characteristics of the function of the laboratory of the college and university and the dangers of the university laboratory will be divided into the unsafe state of the object, the unsafe behavior of the person, the safety management of three aspects of identification. On the basis of scientific assessment, the laboratory risk level from high to low in turn divided into major risk, greater risk, general risk, low risk, and through the red, orange, yellow, blue 4 color identification, drawing the university laboratory risk space distribution map, so as to develop the corresponding laboratory grading control measures. university laboratory safety technology management system framework is shown in Figure 2.
The first line of defense is mainly from the source of systematic identification of risks, risk management and control, to control all kinds of risks in the affordable range, to eliminate or reduce the probability of accidents; the second line of defense is mainly to check the risk management process of the lack of control, loopholes, hidden dangers will be eliminated in the accident before the occurrence of the second line of defense in the basic risk investigation based on the main types of safety accidents in laboratories in recent years, and the main type of professional safety management system, which is based on the internal safety management system in universities and colleges. The second line of defense of the basic hidden danger inspection is divided according to the main types of laboratory safety accidents in recent years, while the professional hidden danger inspection is mainly divided according to the characteristics of each professional laboratory within the university, to realize the closed-loop safety management of the university laboratory risk identification, risk assessment, risk grading and control, hidden danger inspection, rectification and review.

Through the FTA method to analyze the accident system to establish the fault tree of ecological safety hidden dangers in college laboratories, with the laboratory ecological safety accidents as the top event T of the fault tree, from the ecological subject, ecological object and ecological environment 3 elements and their composition as the first and second level branches of the event T. The conscious behavior, unconscious behavior and habitual behavior, disposable behavior are recombined to become the psychological quality and physiological behavior of two types of personal states. Continuing to push forward the next level to the basic event series X in an all-angle and all-round way, the intermediate events in the reasoning process are numbered as series M. On the basis of relevant experts’ advice and guidance, the ecological factors that are easier to get out of control of the potential safety hazards and have a high degree of impact on the accidents are identified as the main basic events to construct the simplified model of the ecological safety accident tree, in which the basic events represented by the X1\(\mathrm{\sim}\)X44 are shown in Table 1.
| Number | Basic event | Number | Basic event |
|---|---|---|---|
| X1 | Safety education training is not enough | X23 | Special safety cabinet is insufficient |
| X2 | Safety awareness is weak | X24 | Drug storage specification |
| X3 | Fluke mind | X25 | Waste disposal |
| X4 | Impaired concentration | X26 | Tag information is not clear |
| X5 | Habits difference | X27 | Cylinder storage is unreasonable |
| X6 | Violations of operating procedures | X28 | Cylinders or pipe damage |
| X7 | Safety protection is not enough | X29 | Sterilized less than one |
| X8 | Improper use | X30 | Culture is not promoted |
| X9 | Poor condition | X31 | Security culture is less active |
| X10 | Professional knowledge is not strong | X32 | Security management system is not sound |
| X11 | Professional skills are not | X33 | Responsibility division is unclear |
| X12 | Safety inspection is not implemented | X34 | Rules are not perfect |
| X13 | Security management is not | X35 | Emergency plan is out of line |
| X14 | Equipment failure | X36 | Security funds are not invested |
| X15 | Instrument line aging | X37 | Items are cluttered |
| X16 | Quality mismatch | X38 | Removal of the removal |
| X17 | Protection facilities defect | X39 | Water and electrical pipeline layout is unreasonable |
| X18 | Maintenance is not as good as time | X40 | Emergency channel setting is unreasonable |
| X19 | Position is not regulated | X41 | The experimental area was not distinct |
| X20 | Lacks monitoring and warning devices | X42 | The concentration of harmful substances exceeds the standard |
| X21 | Fire facilities are not fully equipped | X43 | Temperature and humidity are not suitable |
| X22 | Not equipped with the ventilation system | X44 | Wire short circuit |
DEMATEL Decision Laboratory Analysis is a system analysis method, using graph theory knowledge and matrix tools, transforming the complex influence relationship between systems into a visual structural model, so as to give a quantitative analysis of the interactions and dependencies between the elements of the complex system, and then clarify the key factors.
In this paper, we adopt DEMATEL method to sort out the risk factors obtained from the questionnaire, complete the directed graph of relevant risk factors, establish the influence matrix, determine the correlation between risk factors through four correlation values, make clear the influence relationship between factors, and find out the main cause and degree of influence transfer.
The specific calculation process is as follows,
Identify the risk factors or indicators affecting the research object, and mark them respectively: C\D\E\F…. and other letters.
To study the influence relationship between the risk factors, analyze the influence relationship between the factors, and construct the direct influence matrix \(X\left\lfloor X_{ij} \right\rfloor _{n\times n}\), which uses the “0/1 scale method” to label the direct influence of each factor, obtaining. \[\label{GrindEQ__1_}\tag{1} X=\left[\begin{array}{cccc} {0} & {x_{12} } & {\ldots } & {x_{1n} } \\ {x_{21} } & {0} & {\ldots } & {x_{2n} } \\ {\vdots } & {\vdots } & {\vdots } & {\vdots } \\ {x_{n1} } & {x_{n2} } & {\ldots } & {0} \end{array}\right].\] In the formula, the influence factor \(X_{ij} (i,j=1,2,\ldots \ldots .n,i\ne j)\) indicates the degree of direct influence of the factor, if there is a direct influence, then \(X_{ij} =1\). If there is no direct influence, when \(i=j\), then \(X_{ij} =0\).
Analyze the indirect influence relationship between the factors, standardize the direct influence matrix, and obtain the standardized influence matrix \(Y\). Standardized method: \(X\) matrix rows of factors and the maximum value of the sum, so that \(Y=X/\max\), that is, \[\label{GrindEQ__2_}\tag{2} Y=\frac{1}{\max _{1<i<n} \sum\limits_{j-1}^{n}X_{ij} }.\]
Establish a comprehensive impact matrix T. Calculate as follows, \[\label{GrindEQ__3_}\tag{3} T=Y^{1} +Y^{2} +Y^{3} +\ldots ..+Y^{n}.\]
We can get the integrated impact matrix T. In the formula matrix T in the element \(t_{ij}\), that is to say, represents the factor i on the factor j of the integrated degree of influence (including direct and indirect impact), or factor i by the factors of the integrated degree of influence.
Analyze and calculate the degree of influence \(a_{i}\), the degree of influence \(b_{i}\), the degree of center \(m_{i}\), the degree of cause \(n_{i}\).
The sum of the factors in each row of the matrix \(T\) is the combined influence of the corresponding element in the row on all other elements, which is called the degree of influence \(a_{i}\).
the sum of the factors in each column of matrix \(T\) is the combined influence value of the corresponding element in the column by all other elements, which is called the degree of influence \(b_{i}\).
the sum of the influence degree and the influence degree of each element is called the center degree \(m_{i}\), which indicates the position of the influence factor in the whole factor system and the size of the role played.
the difference between the influence degree and the influenced degree of each element is called the cause degree \(n_{i}\), which indicates whether the factor has more influence on other factors or is influenced by other factors.
When \(n_{i} >0\), the factor is the cause factor, and when \(n_{i} <0\), the factor is the effect factor.
The centrality indicates the position of the factor among all the factors, the larger the centrality, the more obvious the driving effect of the factor on the other factors, i.e. the factor is in the core position, on the contrary, the smaller the centrality, the weaker the influence of the factor on the other factors, and the relevant calculation rules are as follows, \[\label{GrindEQ__4_}\tag{4} a_{i} =\sum\limits_{j=1}^{n}t_{ij} (i=1,2,\ldots ,n).\] \[\label{GrindEQ__5_}\tag{5} b_{i} =\sum\limits_{i=1}^{n}t_{ij} (i=1,2,\ldots ,n).\] \[\label{GrindEQ__6_}\tag{6} m_{i} =a_{i} +b_{i} (i=1,2,\ldots ,n).\] \[\label{GrindEQ__7_}\tag{7} n_{i} =a_{i} -b_{i} (i=1,2,\ldots ,n).\]
In this thesis study, since the DEMATEL method has been used previously, the reachability matrix can be computed directly during the ISM modeling process.Therefore, the ISM modeling process is simplified to the following steps.
Step 1: Perform the calculation of the reachability matrix \(Q\).
The first step: The integrated impact matrix T can be obtained from the DEMATEL method process, then the overall impact matrix of the risk system is \(P=T+I\), where I is the unit matrix of order \(n\)\((i\times j)\).
Step 2: The values of the elements of the reachability matrix can be determined as follows, \[\label{GrindEQ__8_}\tag{8} q_{ij} =\left\{\begin{array}{ll} {1,} & {p_{ij} >\lambda ;} \\ {0,} & {p_{ij} \le \lambda ;} \end{array}(i=1,\ldots .,n;j=1,\ldots \ldots ,n;)\right.\] where, \(\lambda\) is a given threshold, used to simplify the system, if the value of NNN is small, i.e., the recursive system, usually do not need to simplify the system, can be set to \(\lambda =0\). In this study, according to the calculation of \(\lambda =0\), we can get the reachable matrix Q.
Hierarchical division of the reachability matrix. The first step is to divide the area. Firstly, the elements in the reachable matrix Q are defined as follows,
In order to facilitate the operation, \(S_{1}\), \(S_{2}\), \(S_{2}\)…,\(S_{n}\)are used to denote the experts. SN to represent the main risk factors affecting the safety of university laboratories obtained from the expert questionnaire survey.
The following definition process divides the elements of the reachable matrix Q into; Reachable set \(R\left(S_{i} \right)\), Prior set \(A\left(S_{i} \right)\), and Common set \(Q\left(S_{i} \right)\).
The reachable set \(R\left(S_{i} \right)\) is the set of elements that can be reached by the system element \(S_{i}\) in the reachable matrix or directed graph, \[\label{GrindEQ__9_}\tag{9} R\left(S_{i} \right)=\left\{S_{i} |S_{i} \in S,m_{ij} =1,i=1,2,\ldots ,n\right\}.\]
Prior set \(A\left(S_{i} \right)\): is the set of elements in a reachable matrix or directed graph that can reach the \(S_{i}\), \[\label{GrindEQ__10_}\tag{10} A\left(S_{i} \right)=\left\{S_{j} |S_{j} \in S,m_{ji} =1,j=1,2,\ldots ,n\right\}.\]
Common set \(C\left(S_{i} \right)\): the common part of the reachable set and the prior set of the system element \(S_{i}\), \[\label{GrindEQ__11_}\tag{11} C\left(S_{i} \right)=\left\{S_{j} |S_{j} \in S,m_{ij} =1,m_{ji} =1,i=1,2,\ldots ,n,j=1,2,\ldots ,n\right\}\]
Starting set \(B(S)\) and ending set \(E(S)\): the starting set of a set \(S\) is the set of factors that only affect (reach) other factors in S and are not affected (not reached by other factors) by other factors.The factors in \(B(S)\) are input factors in a directed graph with only arrows going out and no arrows coming in.If the above situation is reversed, then it is the ending set, denoted ES.The defining equations are, respectively, as follows, \[\label{GrindEQ__12_}\tag{12} B(S)\left\{=S_{i} |S_{i} \in S,C\left(S_{i} \right)=A\left(S_{i} \right),i=1,2,\ldots ,n\right\},\] \[\label{GrindEQ__13_}\tag{13} E(S)=\left\{S_{i} |S_{i} \in S,C\left(S_{i} \right)=R\left(S_{i} \right),i=1,2,\ldots ,n\right\}.\]
The result of the regionalization can be denoted as \(\Pi (S)=P_{1} ,P_{2} ,\ldots .P_{k} ,\ldots ,P_{m}\). where \(P_{k}\) is the ensemble of elements of the \(K\)th relatively independent region.
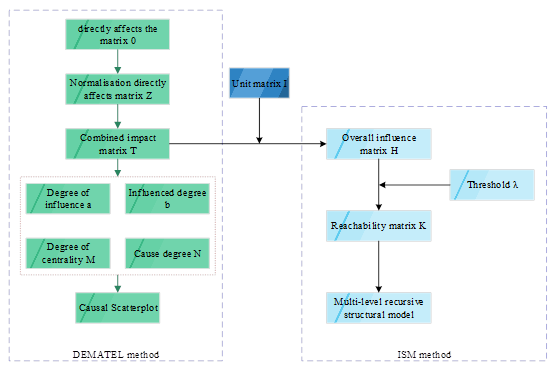
Based on the principles of DEMATEL and ISM, a safety risk identification model for university laboratories was constructed, and the process of DEMATEL-ISM model construction is shown in Figure 3. Firstly, a questionnaire was distributed to experienced practitioners and experts in the construction industry to determine the direct impact matrix, and then the causal scatter diagram and multilevel hierarchical structure model for risk factors were constructed based on the DEMATEL-ISM model construction process. Then, according to the DEMATEL-ISM modeling process, the causal scatter plot and multilevel hierarchical structural model of the risk factors are drawn, and the risk factors are classified into autonomous, dependent, linked and independent factors according to the results of the MICMAC analysis, and finally, the constructed DEMATEL-ISM model is analyzed.
The FTA method is also known as the fault tree analysis, which is an important quantitative analysis method in system safety analysis, which can analyze the reliability, safety and causal logic of the accident system, and can identify and evaluate the risk of the system, and also a relatively common analysis method. The DEMATEL-ISM method can analyze the factors of the safety risk of the university laboratory, which is the result of the failure tree method. In the case of university laboratory accidents, it is divided into mechanical injuries, fire accidents, explosive accidents, toxic accidents and leakage accidents. The t represents the top event, which is not the security event that does not want to happen, so the t here is a safety risk accident for the university lab. Then there is the intermediate event of the FTA which is the case that the system may cause events on the top, usually expressed in m. The m here is mechanical hurtful accident, fire sex, explosive accidents, toxic accidents and leakage accidents. After determining the intermediate event, until the basic accident reason, the basic event, the layer look up, gradually form a fault tree. Finally, the basic event is that the system can cause events in the middle of the event, usually in x. The x here includes violations, mechanical failures, management factors, etc. After building the fault tree, the DEMATEL algorithm was used to find the influence degree, influence degree, center degree and reason of the basic events, and use the ism to divide the basic events into the side order, and determine the factors influencing the factors of the safety accident of the university laboratory.
According to the DEMATEL calculation steps, after the comprehensive influence matrix, the influence degree f, the influenced degree e, the center degree M and the cause degree N of the safety risk factors in college laboratories are calculated. Table 2 shows the causal characteristics of the safety risk factors in college laboratories. The magnitude of the center degree refers to the importance of the influence factors in the supply chain risk of the fresh food e-commerce business, and the larger the center degree refers to the greater the importance of the factor. The safety risk degree of the safety risk in college laboratories ranges from 2.3 to 5.6. The top five safety risk factors in university laboratories are non-standard storage of X24 drugs, lack of monitoring and early warning devices in X20, weak safety awareness of X2, imperfect rules and regulations of X34, and unreasonable layout of X39 water and electricity pipelines. The least important ones were the untimely removal of X38, the lack of concentration of X4, the cluttered placement of X37 items, the improper use of X8, and the poor physical condition of X9.
| Influencing factor | Fi | Ei | Mi | Ni | Center degree ranking | Reason attribute |
|---|---|---|---|---|---|---|
| X1 | 1.67 | 2.15 | 4.47 | -1.08 | 24 | Result factors |
| X2 | 1.54 | 1.78 | 5.52 | -0.23 | 3 | Result factors |
| X3 | 2.19 | 1.63 | 4.98 | 0.12 | 13 | Cause factors |
| X4 | 1.53 | 3.04 | 2.46 | 1.05 | 43 | Cause factors |
| X5 | 3.25 | 2.04 | 5.01 | 0.19 | 12 | Cause factors |
| X6 | 2.62 | 1.67 | 3.67 | 1.09 | 29 | Cause factors |
| X7 | 3.47 | 2.67 | 5.14 | -1.08 | 9 | Result factors |
| X8 | 2.11 | 2.74 | 2.58 | -1.45 | 41 | Result factors |
| X9 | 2.67 | 2.32 | 2.61 | 0.24 | 40 | Cause factors |
| X10 | 2.29 | 3.11 | 4.86 | 0.14 | 15 | Cause factors |
| X11 | 3.55 | 2.09 | 4.79 | 1.61 | 17 | Cause factors |
| X12 | 1.59 | 2.96 | 2.62 | -1.56 | 39 | Result factors |
| X13 | 3.06 | 2.67 | 4.55 | -0.02 | 21 | Result factors |
| X14 | 3.78 | 3.14 | 5.21 | -1.85 | 7 | Result factors |
| X15 | 2.93 | 1.61 | 3.87 | -0.79 | 26 | Result factors |
| X16 | 1.94 | 2.45 | 2.63 | -1.58 | 38 | Result factors |
| X17 | 2.25 | 1.55 | 4.78 | 0.02 | 18 | Cause factors |
| X18 | 3.67 | 2.19 | 3.73 | 2.07 | 28 | Cause factors |
| X19 | 3.49 | 1.77 | 5.09 | -1.89 | 10 | Result factors |
| X20 | 2.42 | 2.16 | 5.53 | 1.47 | 2 | Cause factors |
| X21 | 3.36 | 2.29 | 5.04 | -1.97 | 11 | Result factors |
| X22 | 2.63 | 2.92 | 3.82 | -0.16 | 27 | Result factors |
| X23 | 2.63 | 2.44 | 4.81 | 0.12 | 16 | Cause factors |
| X24 | 2.21 | 1.53 | 5.56 | 1.58 | 1 | Cause factors |
| X25 | 2.94 | 2.79 | 4.54 | -1.44 | 22 | Result factors |
| X26 | 1.46 | 1.73 | 2.67 | -0.59 | 37 | Result factors |
| X27 | 2.51 | 2.08 | 3.06 | -0.77 | 34 | Result factors |
| X28 | 2.65 | 1.87 | 4.49 | -0.54 | 23 | Result factors |
| X29 | 2.04 | 1.85 | 3.04 | -0.01 | 35 | Result factors |
| X30 | 2.89 | 1.94 | 3.48 | 0.97 | 30 | Cause factors |
| X31 | 1.64 | 1.56 | 2.82 | 1.82 | 36 | Cause factors |
| X32 | 3.54 | 1.65 | 4.25 | 0.92 | 25 | Cause factors |
| X33 | 2.31 | 2.71 | 4.62 | 0.05 | 20 | Cause factors |
| X34 | 2.56 | 3.12 | 5.42 | 0.52 | 4 | Cause factors |
| X35 | 1.42 | 3.18 | 4.65 | 0.42 | 19 | Cause factors |
| X36 | 1.85 | 1.8 | 3.15 | 1.84 | 33 | Cause factors |
| X37 | 1.79 | 2.12 | 2.56 | 0.24 | 42 | Cause factors |
| X38 | 2.14 | 2.72 | 2.31 | -0.47 | 44 | Result factors |
| X39 | 3.73 | 2.33 | 5.37 | 1.31 | 5 | Cause factors |
| X40 | 3.13 | 2.91 | 4.97 | 0.45 | 14 | Cause factors |
| X41 | 3.23 | 2.07 | 5.16 | 1.95 | 8 | Cause factors |
| X42 | 2.67 | 2.53 | 3.41 | 1.97 | 31 | Cause factors |
| X43 | 2.91 | 2.79 | 5.25 | 0.56 | 6 | Cause factors |
| X44 | 1.82 | 2.67 | 3.37 | 0.78 | 32 | Cause factors |
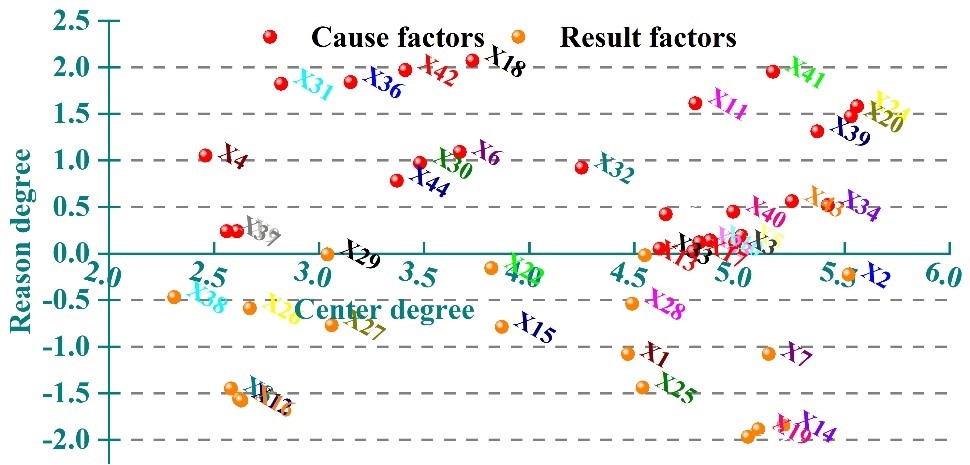
According to the calculation results of Table 2 to get the results of the impact of each indicator, and then the center degree as the horizontal axis, the cause degree as the vertical axis, college laboratory safety risk factors cause and effect as shown in Figure 4.
According to the size of the cause degree of the first five cause factors: X18 maintenance is not timely, X42 concentration of hazardous substances exceeds the standard, X41 experimental area is not clear, X36 insufficient investment in safety funds, X31 safety and cultural activities, the cause degree of 2.07, 1.97, 1.95, 1.84, and 1.82. According to the size of the result degree of the first five results of the factor for sorting: X21 fire prevention, fire prevention, fire prevention, fire prevention, fire prevention and fire prevention. Sorting: X21 fire fighting facilities are not complete, X19 position is not standardized, X14 equipment failure, X16 quality is not qualified, and X12 safety inspection is not implemented, the result degree is 1.97, 1.89, 1.85, 1.58, and 1.56, respectively. can be added by adding the experimental personnel’s safety education and training related to the course activities, combined with the psychological aspects of the education, to improve the cultural quality, safety awareness and operation of the experiment staff. Cultural quality, safety awareness and operation ability, but also need to strengthen the management and inspection of the main body of knowledge and skills training and learning, to reduce the laboratory safety management and inspection in the missed security risks.
Specific training is as follows; (1) In the experiment, not only in the experiment, but in every aspect of daily life, we can strengthen the construction of safety culture, start small, and promote the safety management of university laboratories. (2) increase the training of personnel in the field to strengthen daily management. The safety goals of the scientific research experiment must be organized by various education and training programs to train the staff to teach regularly and regularly by inviting hospitals such as hospitals and other safe management institutions. Through training to enhance the safety awareness of everyone, each person is able to understand the possible safety hazards and prepare for emergency preparedness. (3) for the first part of the laboratory, the laboratory safety training, the training of the laboratory and the individual training, to ensure that they master the laboratory technical specification, the operation discipline, the biological safety protection knowledge and the actual operation skill of the actual operation skill, the final conduct of the written examination of the examination and the qualification of the examination.
Through the comprehensive analysis of the factors mentioned above, the order of influence, the order of being influenced, the order of centrality and the order of cause of each influencing factor were obtained, and the order of key factors is shown in Table 3, in which the most critical factor is X41 The experimental area is not clear (2,8,8), and insecurity is the fundamental element leading to accidents in the management system studied in this paper, and physiological behaviors such as violation of the operating procedures by the experimental staff, improper use, and irregularities in safety protection are the key factors. The second important influence factor is the lack of professional knowledge and skills of safety management personnel and inspectors, and the omission of ecological risk factors in the process of laboratory management and inspection. according to the theory of behavioral psychology, the physiological behavior of the subject is controlled by their own psychological consciousness, and the behavior is the embodiment of self-consciousness, which is manifested with varying degrees of intensity. by strengthening the safety education and training of experimental subjects and the psychological training of experimental subjects, and by strengthening the safety education and training of experimental subjects, and by strengthening the safety education and training of experimental subjects, and by strengthening the safety education and training of experimental subjects. By strengthening the safety education and training and psychological education of experimental subjects to improve the practical ability, psychological precautions and self-protection awareness, and at the same time guiding the subjects to positively intervene to regulate the proportion of safety in the system as a whole and recognize their own importance, it is conducive to the early elimination or control of hazardous and harmful factors, preventing the collapse of the system’s self-regulation and defense capabilities into an accident.
| Influencing factor | Influence sort | Center sort | Reason sort | Key factor | Reason attribute |
|---|---|---|---|---|---|
| X1 | 14 | 24 | 24 | Yes | Result factors |
| X2 | 39 | 3 | 20 | Yes | Result factors |
| X3 | 18 | 13 | 2 | Yes | Cause factors |
| X4 | 11 | 43 | 34 | No | Cause factors |
| X5 | 32 | 12 | 39 | No | Cause factors |
| X6 | 19 | 29 | 43 | No | Cause factors |
| X7 | 7 | 9 | 14 | Yes | Result factors |
| X8 | 21 | 41 | 41 | No | Result factors |
| X9 | 5 | 40 | 7 | No | Cause factors |
| X10 | 41 | 15 | 19 | No | Cause factors |
| X11 | 40 | 17 | 21 | No | Cause factors |
| X12 | 13 | 39 | 5 | No | Result factors |
| X13 | 25 | 21 | 3 | Yes | Result factors |
| X14 | 15 | 7 | 40 | No | Result factors |
| X15 | 43 | 26 | 10 | No | Result factors |
| X16 | 30 | 38 | 23 | No | Result factors |
| X17 | 42 | 18 | 11 | No | Cause factors |
| X18 | 9 | 28 | 17 | Yes | Cause factors |
| X19 | 28 | 10 | 35 | Yes | Result factors |
| X20 | 23 | 2 | 33 | Yes | Cause factors |
| X21 | 22 | 11 | 13 | Yes | Result factors |
| X22 | 6 | 27 | 25 | Yes | Result factors |
| X23 | 34 | 16 | 28 | Yes | Cause factors |
| X24 | 27 | 1 | 1 | Yes | Cause factors |
| X25 | 20 | 22 | 32 | Yes | Result factors |
| X26 | 33 | 37 | 15 | Yes | Result factors |
| X27 | 10 | 34 | 22 | Yes | Result factors |
| X28 | 17 | 23 | 18 | Yes | Result factors |
| X29 | 24 | 35 | 6 | No | Result factors |
| X30 | 3 | 30 | 30 | No | Cause factors |
| X31 | 38 | 36 | 42 | No | Cause factors |
| X32 | 8 | 25 | 44 | No | Cause factors |
| X33 | 29 | 20 | 36 | No | Cause factors |
| X34 | 16 | 4 | 27 | Yes | Cause factors |
| X35 | 36 | 19 | 29 | No | Cause factors |
| X36 | 44 | 33 | 31 | No | Cause factors |
| X37 | 37 | 42 | 26 | No | Cause factors |
| X38 | 1 | 44 | 16 | No | Result factors |
| X39 | 31 | 5 | 12 | Yes | Cause factors |
| X40 | 12 | 14 | 9 | Yes | Cause factors |
| X41 | 2 | 8 | 8 | Yes | Cause factors |
| X42 | 4 | 31 | 37 | No | Cause factors |
| X43 | 26 | 6 | 4 | Yes | Cause factors |
| X44 | 35 | 32 | 38 | No | Cause factors |
Based on the previous factors affecting the safety risk of college laboratories, the safety risk evaluation index system of college laboratories is constructed. Table 4 shows the safety risk evaluation of college laboratories, in which the first-level indexes include 5 indexes and 16 second-level indexes, including the responsibility system and rules and regulations, the management of hazardous and harmful factors, the disposal of hazardous wastes, the construction of safety culture, and the rescue and personal protection in case of emergency.
| Target layer | Primary indicator | Secondary indicator |
|---|---|---|
| Laboratory security risk control level | Liability system and regulations M1 | Responsibility system and personnel structure N1 |
| Check the hidden danger rectification system N2 | ||
| Laboratory operation procedure N3 | ||
| Financial protection and construction maintenance N4 | ||
| Management of hazardous factors M2 | Hazardous chemicals N5 | |
| Special equipment N6 | ||
| Laboratory environment N7 | ||
| Waste disposal M3 | Waste liquor N8 | |
| Exhaust gas N9 | ||
| Solid waste N10 | ||
| Safety and culture construction M4 | Access to education N11 | |
| Security campaign N12 | ||
| Participation training N13 | ||
| Emergency rescue and personal protection M5 | Fire protection facility N14 | |
| Emergency rescue equipment N15 | ||
| Individual prevention and control facilities N16 |
G1 method is a kind of subjective assignment method which is improved on the basis of AHP method, and the amount of calculation is also reduced compared with AHP method, and the operation process is simple, so that the results are more intuitive. The specific steps of G1 method are as follows,
Determine the importance of ranking: Assuming that the set of evaluation indicators for \(\left\{X_{1} ,X_{2} ,\cdots X_{n} \right\}\), experts are asked to rank the importance of the same indicator layer between the different factors, the most important indicators were selected as \(X_{1}^{*}\), and then from the remaining \(n-1\) indicators continue to select the most important indicators as \(X_{2} {}^{*}\), and so on, resulting in the importance of the indicators of the ranking \(X_{1} {}^{*} >X_{2} {}^{*} >\cdots >X_{n} {}^{*}\).
Determine the degree of relative importance: The relative importance values of neighboring indicators \(X^{*} {}_{k-1}\) and \(X_{k} {}^{*}\) are expressed as \(r_{k} (k=2,3,\cdots ,n)\). \[\label{GrindEQ__14_}\tag{14} r_{k} =\frac{w_{k-1} }{w_{k} } ,k=n,n-1,n-2,\cdots ,3,2,\] where, \(w_{k-1}\), \(w_{k}\) denotes the weight value of the \(k-1\)th and \(k\)th indicators, respectively.
Calculate the weight of each indicator: According to the above calculation steps, the weights of the first-level indicators and the second-level indicators are calculated respectively.Assuming that the experts give the assigned value \(r_{n}\), the corresponding weight \(w_{m}\) of the \(m\)th indicator is, \[\label{GrindEQ__15_}\tag{15} w_{m} =\left(1+\sum\limits_{n=2}^{m}\prod _{i=n}^{m}r_{i} \right)^{-1}\]
Determination of other weights Once the individual weights of the indicators have been determined, the weights of other indicators within the same set of indicators are determined according to Eq. 16 , \[\label{GrindEQ__16_}\tag{16} w_{n-1} =r_{n} w_{n} ,n=m,m-1,\cdots ,3,2.\]
Determination of weight indices for expert empowerment: Experts are invited to select the level of knowledge of the project according to the actual situation and assign different values to \(d_{k}\) according to the different levels of knowledge. Then the weight index assigned by the kth expert is, \[\label{GrindEQ__17_}\tag{17} L_{k} =d_{k} /\sum\limits_{e=1}^{t}d_{e},\] where t is the number of experts involved in empowerment.
Determination of the outcome of decision-making by expert group clusters: According to Eqs. 14 , 15 , 16 to calculate the weights of the indicators under the decision-making of a single expert, the weight of the ith indicator under the decision-making of the kth expert is expressed by \(w_{i}^{k}\), and according to the equation 17 to get the weight index \(L_{k}\) of the kth expert in the process of assigning weights then the result of the group decision-making of the ith indicator is, \[\label{GrindEQ__18_}\tag{18} \alpha _{i} =\sum\limits_{k=1}^{t}L_{k} w_{i}^{k}.\]
CRITIC method is a kind of objective weight assignment method, CRITIC method through the amount of information based on the comprehensive evaluation of individual indicators and standard deviation of the conflict, indicating the gap between the programs within the same indicator, as a basis for determining the objective weights. the steps for determining the weights of the CRITIC method are as follows;
If indicator i for object j is a benefit indicator, the standardized treatment is, \[\label{GrindEQ__19_}\tag{19} y_{ij} =\frac{x_{ij} -\min x_{ij} }{\max x_{ij} -\min x_{ij} }.\]
If the ith indicator for the jth object of evaluation is a cost indicator, the standardization is as follows, \[\label{GrindEQ__20_}\tag{20} y_{ij} =\frac{\max x_{ij} -x_{ij} }{\max x_{ij} -\min x_{ij} }.\]
In the formula, \(\min x_{ij}\) is the minimum value of the ith indicator factor in all its evaluation objects \((j=1,2,3,\cdots ,t)\), \(\max x_{ij}\) is the maximum value of the ith indicator factor in all its evaluation objects \((j=1,2,3,\cdots ,t)\), and \(y_{ij}\) is the value after data standardization.
The correlation coefficient is a measure reflecting the degree of correlation between the evaluation indicators, and its calculation formula is as follows. \[\label{GrindEQ__21_}\tag{21} r_{ij} =\frac{\sum\limits_{j=1}^{t}\left(x_{ij} -\overline{x_{ij} }\right) \left(y_{ij} -\overline{y_{ij} }\right)}{\sqrt{\sum\limits_{j=1}^{t}\left(x_{ij} -\overline{x_{ij} }\right)^{2} \sum\limits_{j=1}^{t}\left(y_{ij} -\overline{y_{ij} }\right)^{2} } }.\]
Formula \(\overline{x_{ij} }\) \(\overline{y_{ij} }\) is the average value of \(x_{ij}\) \(y_{ij}\).
Let the value of the amount of information contained in the ith evaluation indicator be \(G_{i}\), which is calculated by the following formula. \[\label{GrindEQ__22_}\tag{22} G_{i} =\sigma _{i} \sum\limits_{j=1}^{t}\left(1-r_{ij} \right),\] where, t is the number of evaluation of the same indicator by t experts, and \(\sigma _{i} =\sqrt{\sum\limits_{j=1}^{t}\left(x_{ij} -\overline{x_{ij} }\right)^{2} }\) is the standard deviation of the ith evaluation indicator.
Set the objective weight of the ith evaluation index factor as \(\beta _{i}\), then the formula for \(\beta\) is, \[\label{GrindEQ__23_}\tag{23} \beta _{i} =\frac{G_{i} }{\sum\limits_{i=1}^{n}G_{i} }.\]
In this study, after reviewing a large number of literatures and according to the actual situation of the safety influencing factors, we choose the multiplication normalization method to assign weights, and multiply the combination of subjective and objective weights.The multiplication normalization method is suitable for the evaluation of a large number of indicators, and the difference in the weights of the indicators is small, and the calculation process of the method is relatively simple, and the method is capable of fully integrating the subjective and objective weights to make up for the deficiencies of a single assignment while retaining the respective advantages, so as to make the results of the weights more accurate and scientific.We will multiply the combination of the subjective weights obtained from the G1 method, \(\alpha _{i}\), and the objective weights obtained from the CRITIC method(\(\beta _{i}\)), and then we will obtain the final weights \(\omega _{i}\), which is given by the formula below, \[\label{GrindEQ__24_}\tag{24} \omega _{i} =\frac{\alpha _{i} \beta _{i} }{\sum\limits_{i=1}^{m}\alpha _{i} \beta _{i} }.\]
Assuming that \(U\) is a quantitative region expressed numerically, that \(U\) is a qualitative concept on \(U\), and that the quantitative value \(x\in U\) is an arbitrary realization of \(U\), the certainty \(\mu (x)\in [0,1]\) of \(x\) with respect to \(U\) is a random number with a stable tendency, i.e. \[\label{GrindEQ__25_}\tag{25} \mu :U\to [0,1].\] \[\label{GrindEQ__26_}\tag{26} \forall x\in U,X\to \mu (x).\]
The distribution of \(x\) on \(U\) is called a cloud, denoted \(C(x)\), and each cloud droplet is a random realization of \(x\).
The generation of cloud droplets is all a random realization of x, not a fixed value, with randomness and uncertainty.
The cloud droplets generated by the cloud model are scattered, the cloud droplets are the display of qualitative concepts, the realization of the cloud droplets is random, and a cloud droplet is not representative, reflecting the characteristics of the qualitative concepts, and the only way to generate thousands of cloud droplets is to simulate them repeatedly through the forward cloud generator to form a cloud graphic reflecting the overall characteristics of the qualitative concepts.
The degree of occurrence of cloud droplets characterizes the degree of people’s knowledge of qualitative concepts, the higher the degree of occurrence of cloud droplets, the higher the probability, indicating greater certainty, indicating that people’s understanding of a certain qualitative concepts is consistent, indicating that people’s knowledge of a certain thing is consistent.
The cloud model needs to be realized by specific algorithms, forward cloud generator and inverse cloud generator are the two major algorithms of the cloud model, the former realizes the quantification of qualitative concepts, and the latter realizes the qualification of quantitative data, and completes the evaluation of the evaluation target by these two algorithms.
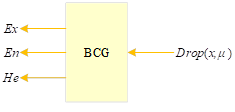
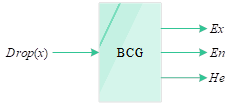
The conversion of qualitative concepts into quantitative values mainly relies on the three numerical features of the cloud model, which are used to generate quantitative values through \(Ex\), \(En\), and \(He\), called the forward cloud generator, denoted by FCG, as shown in Figure 5.
The FCG algorithm can be formulated as follows,
Input: numerical features \(Ex\), \(En\), \(He\) number n of generated cloud droplets .
Output: n cloud droplets \(x_{i}\) and their certainty \(\mu \left(x_{i} \right)(i=1,2,\cdots ,n)\).
Algorithm steps are
Generate a normal random number \(y_{i} =R_{N} (En,He)\) with \(En\) as the expected value and \(He^{2}\) as the variance.
Generate a normal random number \(x_{i} =R_{N} \left(Ex,y_{i} \right)\) with \(Ex\) as the expected value and \(y_{i}^{2}\) as the variance.
Compute \(\mu \left(x_{i} \right)=\exp \left(-\frac{\left(x_{i} -Ex\right)^{2} }{2y_{i}^{2} } \right)\).
\(x_{i}\) with certainty \(\mu \left(x_{i} \right)\) becomes a cloud droplet in the field.
Repeat steps 1 \(\mathrm{\sim}\) 4 until the required number of cloud droplets are produced 3)
In contrast to the forward cloud generator, the inverse cloud generator converts quantitative data into qualitative language expressed by three numerical features \(Ex\), \(En\), \(He\). The inverse cloud generator is shown in Figure 6.
The inverse cloud generator can be expressed as follows.
Input: Sample point \(x_{i} (i=1,2,\cdots ,n)\).
Output: Digital features \(Ex\), \(En\), \(He\) reflecting qualitative concepts.
Algorithm steps are,
Calculate the sample mean \(\bar{X}=\frac{1}{n} \sum\limits_{i=1}^{n}x_{i}\), the first order sample absolute central moment \(\frac{1}{n} \sum\limits_{i=1}^{n}\left|x_{i} -\bar{X}\right|\), and the sample variance \(S^{2} =\frac{1}{n-1} \sum\limits_{i=1}^{n}\left(x_{i} -\bar{X}\right)^{2}\) of this set of data according to \(X_{i}\) .
Calculate the expectation \(Ex=\bar{X}\).
Calculate entropy \(En=\sqrt{\frac{\pi }{2} } \times 1/n\sum\limits_{i=1}^{n}\left|x_{i} -Ex\right|\).
Calculate the hyperentropy \(He=\sqrt{S^{2} -En^{2} }\).
In this paper, the inverse cloud generator is used to transform the sample data into the cloud language, i.e., the three parameters of the cloud model \(Ex\), \(En\), \(He\) to facilitate the subsequent comprehensive evaluation of the cloud model, and the more sample data are given, the smaller the error is.
In this paper, the evaluation language is divided into five levels, and the evaluation value interval is given according to the evaluation language. another manifestation is the randomness of the respondents’ scoring, different investigators have different traveling experiences and give different scores. the fuzzy and randomness are jointly manifested by the fact that the whole data processing process is based on the cloud model, and the entropy and the super-entropy are the specific manifestation of the fuzzy and randomness.
According to the characteristics of security risk in colleges and universities, as well as referring to the classification standards of previous research literature, this paper sets the evaluation standard level into five levels.
The evaluation level is expressed by the three parameters of the cloud model with the following formula, \[\label{GrindEQ__27_}\tag{27} Ex_{i} =\frac{\left(x_{\min ^{i} } +x_{\max ^{i} } \right)}{2}.\] \[\label{GrindEQ__28_}\tag{28} En_{i} =\frac{\left(x_{\max }^{i} -x_{\min }^{i} \right)}{2\sqrt{2\ln 2} }.\] \[\label{GrindEQ__29_}\tag{29} He_{i} =k.\]
Among them, \(x_{\min }^{i}\) and \(x_{\max }^{i}\) are the minimum and maximum values of each evaluation interval, and \(k\) is a constant, which generally takes the value between 0.001 and 0.1. In this paper, according to the fuzzy degree of the rubric itself as well as referring to the previous literature, \(k\) takes the value of 0.1.
According to formulas 27 , 28 , 29 the evaluation interval is converted into the digital characteristics of the cloud model, i.e., the three parameters of the cloud model, \(Ex\), \(En\), \(He\), and then use the forward cloud generator algorithm to generate the evaluation level cloud map.
When seeking the cloud parameters of the target layer, it is necessary to calculate the cloud parameters of the guideline layer indicators first, and the cloud parameters of the guideline layer indicators are calculated on the basis of the cloud parameters of the indicator layer, and when seeking the comprehensive cloud, it is necessary to calculate the cloud parameters of the indicator layer first, and then, according to the calculation formula, seek out the corresponding cloud parameters layer by layer, and the specific calculation formula is as follows, \[\label{GrindEQ__30_}\tag{30} \begin{array}{rcl} {Ex} & {=} & {Ex_{1} \lambda _{1} +Ex_{2} \lambda _{2} +\ldots \ldots +Ex_{n} \lambda _{n} }. {} \end{array}\]
According to the above formula can calculate the evaluation results of the secondary indicators, and then by the evaluation of the secondary indicators of information through the integrated cloud computing, to get the final evaluation results, according to the final evaluation results, the use of forward cloud generator to generate cloud graphics, and the evaluation of the level of the cloud graphics to do the comparison, can be obtained from the position of the graphics in the axis, that is, it can be known that the evaluation of the evaluation program evaluation level.
After the calculation of the five level rubrics, we can find out the level standard cloud rubric model, which is shown in Table 5, and its rubrics are Safety C1, Relative Safety C2, General Safety C3, Relative Hazardous C4, and Hazardous C5, and the corresponding numerical value intervals are 5, 4, 3, 2 and 1.
| Comment level | Score | Standard cloud model |
|---|---|---|
| Safe | 5 | (5.000,0.446,0.044) |
| Relative safety | 4 | (4.000,0.268,0.022) |
| General safety | 3 | (3.000,0.162,0.014) |
| Relative risk | 2 | (2.000,0.268,0.022) |
| Risk | 1 | (1.000,0.446,0.044) |
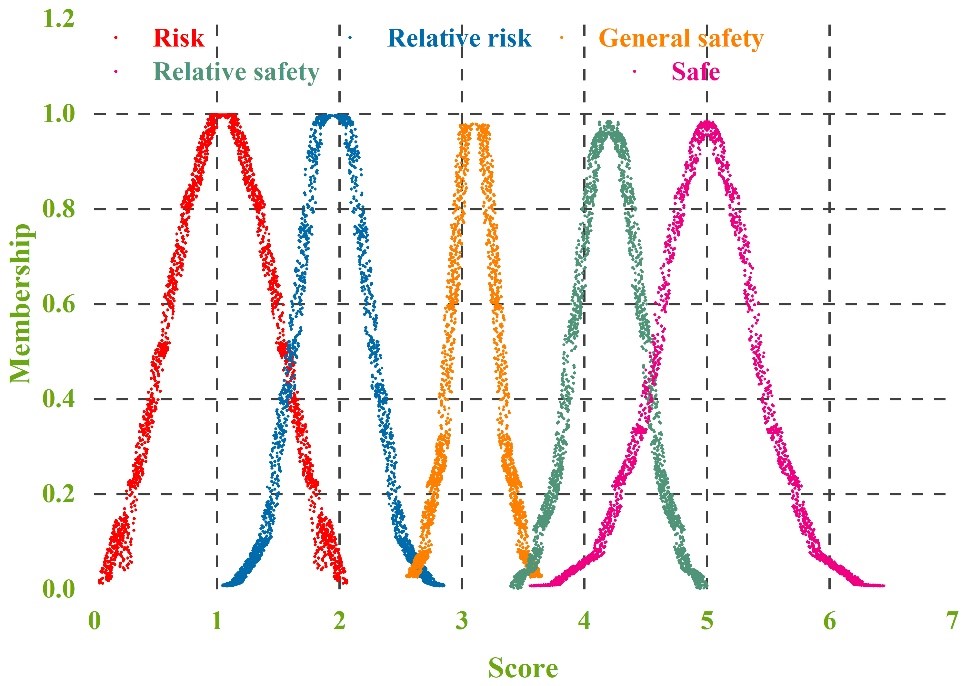
In order to visualize the cloud model, the subsequent use of Matlab software, and combined with the normal cloud generator, you can generate the corresponding comment cloud map, which can be more intuitive to present the five levels of the distribution of comment cloud, the evaluation of the standard comment cloud as shown in Figure 7. Evaluation of the standard comment cloud map can reflect the real college laboratory safety risk control level.
Through the cloud model inverse generator processing, through the formula for each factor scoring expectations Ex, the degree of dispersion En, super entropy value He, and then use the formula 24 can be calculated for each three-level indicators of the weight of the evaluation indicators weight calculation results shown in Table 6. two indicators in the highest weight for hazardous chemicals 0.379, inspection of the system of rectification of hidden dangers 0.153 and special equipment 0.108, the lowest weight for the safety publicity activities, only 0.004. Special equipment 0.108, the weight of the lowest proportion of safety publicity activities, only 0.004. Level 1 indicators, the highest proportion of the management of dangerous and harmful factors 0.502, the lowest proportion of the construction of a safety culture 0.033, so in the university laboratory safety risk control, we need to focus on the actual operation of the laboratory, rather than the theoretical safety prevention and control.
| Primary indicator | Weight | Secondary indicator | Weight | Total weight |
|---|---|---|---|---|
| Liability system and regulations M1 | 0.245 | Responsibility system and personnel structure N1 | 0.075 | 0.018 |
| Check the hidden danger rectification system N2 | 0.625 | 0.153 | ||
| Laboratory operation procedure N3 | 0.208 | 0.051 | ||
| Financial protection and construction maintenance N4 | 0.092 | 0.023 | ||
| Management of hazardous factors M2 | 0.502 | Hazardous chemicals N5 | 0.755 | 0.379 |
| Special equipment N6 | 0.215 | 0.108 | ||
| Laboratory environment N7 | 0.030 | 0.015 | ||
| Waste disposal M3 | 0.112 | Waste liquor N8 | 0.455 | 0.051 |
| Exhaust gas N9 | 0.462 | 0.052 | ||
| Solid waste N10 | 0.083 | 0.009 | ||
| Safety and culture construction M4 | 0.033 | Access to education N11 | 0.523 | 0.017 |
| Security campaign N12 | 0.135 | 0.004 | ||
| Participation training N13 | 0.342 | 0.011 | ||
| Emergency rescue and personal protection M5 | 0.108 | Fire protection facility N14 | 0.618 | 0.067 |
| Emergency rescue equipment N15 | 0.088 | 0.010 | ||
| Individual prevention and control facilities N16 | 0.294 | 0.032 |
The 11 colleges and universities \((A, B, C, D, E, F, G, H, I, J, K)\) selected for the study are representative in terms of school-running characteristics, disciplines and types of laboratories, etc. Specifically, in terms of school-running characteristics, the sample consists of 8 national key colleges and universities of “double first-class”, 3 local key colleges and universities, 4 comprehensive colleges, 4 polytechnic colleges, 3 teacher-training colleges and universities, and 4 universities of chemistry, biology, radiation, mechanical and electrical engineering, and 3 teacher-training colleges. In terms of subject categories, the sample includes 4 comprehensive colleges and universities, 4 polytechnic colleges and universities, 3 teacher training colleges and universities, and in terms of laboratory types, the sample colleges and universities cover a variety of types, such as chemical, biological, radiation, electromechanical, civil engineering and special equipment, etc. In terms of affiliation, the sample includes 5 colleges and universities directly under the Ministry of Education, 3 colleges and universities under the Ministry of Industry and Information Technology, and 3 colleges and universities jointly established by the Ministry of Education and the provincial government.
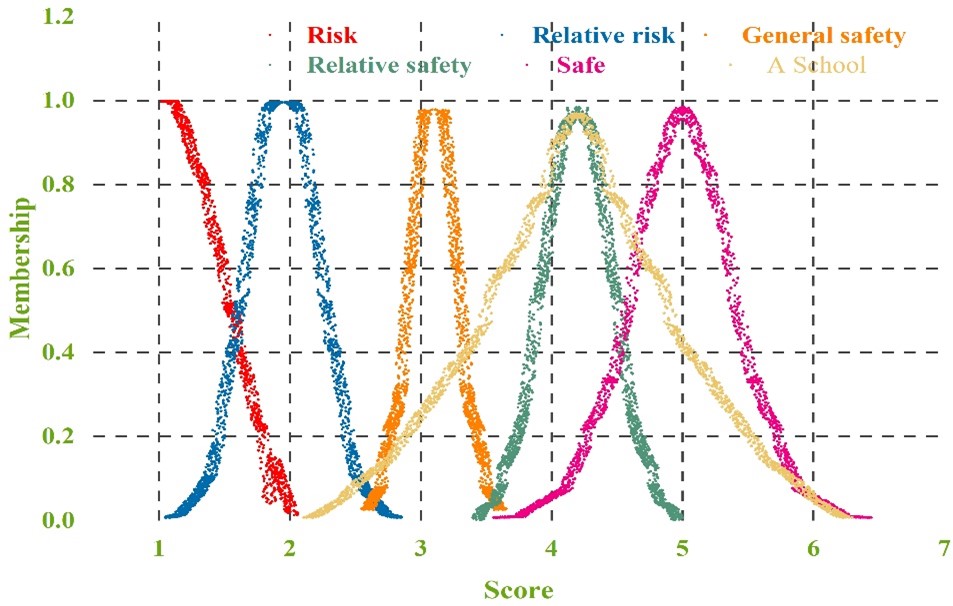
First of all, take school A as an example, calculate the cloud model characteristics of the second level indicators and first level indicators of the university laboratory safety risk intelligent control level index system. Table 7 shows the cloud digital characteristics of the first level indicators of the laboratory safety risk intelligent control level of school A. Calculate the final cloud parameter according to the formula 30 , and get \(C(Ex,En,He)=(4.252,0.725,0.711)\).The comprehensive risk evaluation cloud map is generated by MATLAB software, and Figure 8 shows the comprehensive evaluation cloud map of laboratory safety level of school A. According to the calculation results and the comprehensive risk evaluation cloud map, it can be seen that laboratory safety risk is in a “comprehensive evaluation”, and it can be seen that laboratory safety risk is in a “comprehensive evaluation”. MATLAB software to generate a comprehensive risk assessment cloud diagram, Figure 8 for the school laboratory safety level comprehensive evaluation cloud diagram. according to the results of the calculation and the comprehensive risk assessment cloud diagram can be seen, the school laboratory safety risk is in the “relative safety” and “safe” level between the school laboratory, closer to the “safe” level, and closer to the “safe” level of the school laboratory safety risk. According to the calculation results and comprehensive risk evaluation cloud diagram, it can be seen that the laboratory safety risk of school A is between “relative safety” and “safety” level, which is closer to “relative safety”, and the overall risk of laboratory safety risk is at the level of relative safety, which is within the permissible range, but still can’t be taken seriously. Table 7 shows that responsibility system and rules and regulations, hazardous waste disposal, emergency rescue and personal protection are all at the relative safety level, while safety culture construction is only at the general safety level, which indicates that the safety culture construction in the laboratory of school A needs to be improved. In order to further improve the application effect of digital twin technology, the application effect of high temperature, low temperature, high pressure and low pressure is tested respectively, and the results show that the accuracy of the model is more than 90 percent in any environment, and it is applicable in various environmental conditions.
| Ex | En | He | Sort | |
|---|---|---|---|---|
| Liability system and regulations M1 | 4.422 | 0.626 | 0.515 | 3 |
| Management of hazardous factors M2 | 4.335 | 0.722 | 0.678 | 1 |
| Waste disposal M3 | 4.221 | 0.602 | 0.635 | 4 |
| Safety and culture construction M4 | 3.855 | 0.612 | 0.638 | 5 |
| Emergency rescue and personal protection M5 | 4.402 | 0.718 | 0.698 | 2 |
In order to further improve the application effect of digital twin technology, the application effect of high temperature, low temperature, high pressure and low pressure is tested respectively, and the results show that the accuracy of the model is more than 90 percent in any environment, and it is applicable in various environmental conditions. At the same time, it is found that the model and artificial intelligence technology and the large number of artificial intelligence are combined by the technology, which can predict the incidence of accidents, and more accurately improve the identification of safety risks of university laboratories, and further reduce the occurrence of accidents. In the future, we will further study the application of digital twin technology and artificial intelligence technology or large number of Internet technologies in the safety risk control of university laboratories.
According to the calculation steps, the risk control level of laboratory safety in schools B\(\mathrm{\sim}\)K is obtained respectively. Table 8 shows the similarity of the cloud models of 11 universities. The cloud model of laboratory safety in school A is the most similar to the cloud of “relative safety” level with the maximum similarity of 0.898, and the cloud model of laboratory safety in school A is the second similar to the cloud of “safety” level with the similarity of 0.229 respectively, which further precisely indicates that the overall evaluation result of laboratory safety level in university A is “relative safety”. The second similarity is 0.229, which further indicates that the overall evaluation result of the laboratory safety level of university A is “relatively safe”, and the laboratory safety level of universities B, C, E, F, G, I and K is “relatively safe”, and the laboratory safety level of universities B, C, E, F, G, I and K is “relatively safe”. In addition, the overall evaluation result of laboratory safety level in Colleges B, C, E, F, G, I, and K is “relatively safe”, the overall evaluation result of laboratory safety level in Colleges H and J is “generally safe”, and the overall evaluation result of laboratory safety level in Colleges D is “relatively dangerous”. The overall rating of the laboratory safety level in Colleges D was “Relatively Dangerous”.
| Evaluation grade standard cloud Cj | C1 | C2 | C3 | C4 | C5 |
|---|---|---|---|---|---|
| College A similarity | 0.229 | 0.898 | 0.018 | 0.001 | 0.006 |
| College B similarity | 0.159 | 0.987 | 0.011 | 0.007 | 0.012 |
| College C similarity | 0.285 | 0.762 | 0.005 | 0.008 | 0.004 |
| College D similarity | 0.008 | 0.004 | 0.036 | 0.058 | 0.003 |
| College E similarity | 0.132 | 0.956 | 0.003 | 0.049 | 0.005 |
| College F similarity | 0.092 | 0.976 | 0.034 | 0.004 | 0.001 |
| College G similarity | 0.026 | 0.729 | 0.033 | 0.018 | 0.008 |
| College H similarity | 0.007 | 0.003 | 0.967 | 0.010 | 0.1233 |
| College I similarity | 0.283 | 0.706 | 0.015 | 0.039 | 0.004 |
| College J similarity | 0.016 | 0.009 | 0.545 | 0.021 | 0.017 |
| College K similarity | 0.126 | 0.991 | 0.001 | 0.007 | 0.018 |
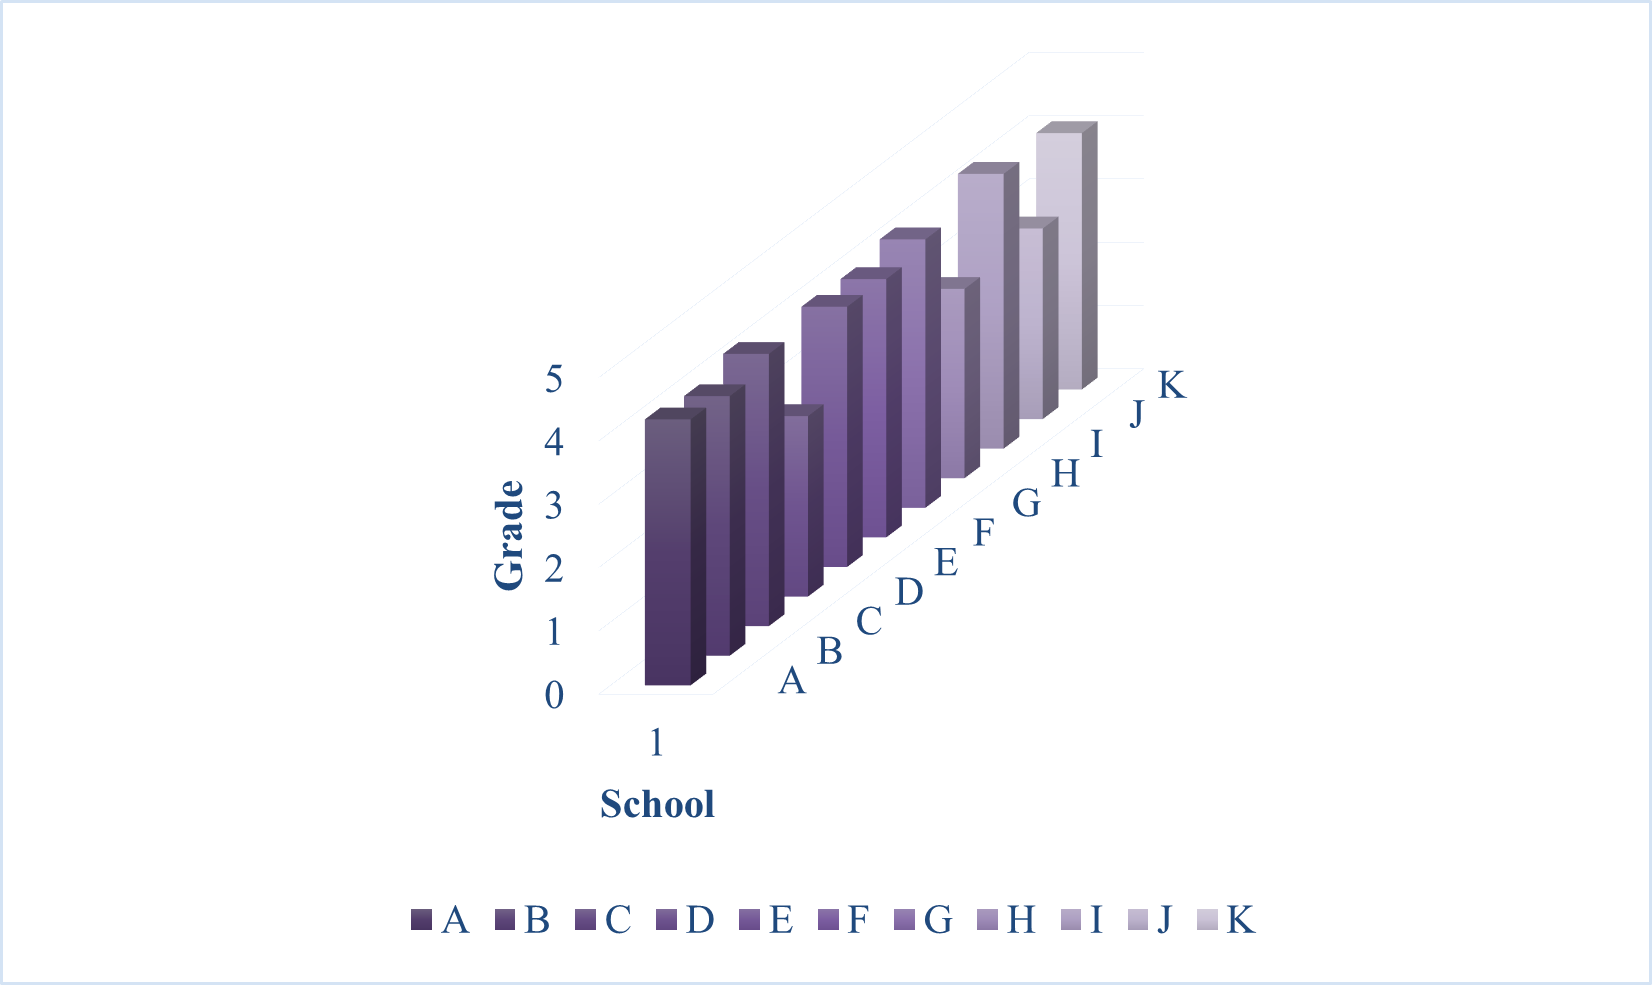
Further 11 colleges and universities laboratory safety risk level and “evaluation level standard cloud” for comparison, 11 colleges and universities laboratory safety level and standard cloud comparison results as shown in Figure 9. through the above cases of college laboratory safety level comprehensive evaluation results, 11 cases of college laboratory safety 8 colleges in The laboratory safety of the 11 case colleges and universities has 8 colleges and universities in the level of “relative safety (C2)”, 2 colleges and universities in the level of “general safety (C3)”, and 1 college and university in the level of “relative danger (C4)”. At the same time, it can be concluded from the analysis of the table and figure that the laboratory safety level of the 11 case colleges and universities is as follows: I college \(\mathrm{>}\) C college \(\mathrm{>}\) A college \(\mathrm{>}\) E college \(\mathrm{>}\) B college \(\mathrm{>}\) K college \(\mathrm{>}\) F college \(\mathrm{>}\) G college \(\mathrm{>}\) H college \(\mathrm{>}\) J college \(\mathrm{>}\) D college.
In order to further explore the rich nature of the analysis, this paper also selects the biological laboratory, the chemistry laboratory and the physics laboratory of a, and explores the effect of the safety risk control model built in this article. Before using the safety risk control model, the risk incidence of biolaboratories, chemical laboratories and physical laboratories at the school was 17.5% and 16.9%respectively, and the incidence of risk accidents was higher, and the accident loss reached 286.52 million yuan. After using the model built in this paper for a period of time, the risk incidence of the three types of laboratory decreased to 9.8%, 8.7% and 9.5%respectively, and the incidence of accidents decreased to below 10%, which shows that the model that USES this article is of general use, which can be applied in various laboratories, and can significantly reduce the risk of accident.
Combined with the previous research, we can carry out risk classification and control, so that we can carry out the subsequent hidden danger investigation work in a targeted manner; then, following the new form and new requirements of education in the era of “intelligent +”, we systematically sort out the experience and problems of laboratory safety management at home and abroad, fully utilize the Internet of Things perception, mobile Internet, artificial intelligence and other advanced information technology to form a universal and unique laboratory intelligent safety management platform, and realize the comprehensive perception, memory feedback and response to the “subject-object-environment” stimulus signals, to achieve the overall perception, memory feedback and response to the “subject-object-environment”. Advanced information technology, the formation of universal and unique laboratory intelligent safety management platform, to achieve the “subject-object-environment” stimulus signals of comprehensive perception, memory feedback and response control of dynamic monitoring and management, and ultimately to achieve “Zero defects, zero accidents, zero casualties” state.
The control of the upper side of the technology: set up the safety alarm system and set up outdoor emergency call facilities. The laboratory builds the exhaust system. In addition, some laboratories should place ventilation cabinets and ventilation fans. The participants should master the causes of the accidents of various kinds of laboratory experiments, strictly observe the operating regulations, and operate carefully and carefully, which can prevent the occurrence of all kinds of accidents and achieve the purpose of safety experiment.
Management risk control measures: through avariety of complementary system, makethe risk control work more comprehensive and detailed, not only can be accurate, efficient and rapid identification of hazards, risk classification, realize effective control, can also can put forward different management suggestions for laboratory management, make the management more scientific and standardized.
In this study, a university laboratory safety risk intelligent control model was successfully developed by applying digital twin technology. Laboratory safety data from 11 different universities were analyzed in depth, revealing several key findings. The application of digital twin technology significantly improves the identification and assessment of laboratory safety risks. By constructing a virtual simulation environment for laboratories, the model is able to effectively simulate laboratory operation status and identify potential risk points in advance.
Empirical analysis shows that the laboratory safety level of 8 out of 11 universities is “relatively safe”, accounting for about 73%; the remaining 3 are “generally safe” and “relatively dangerous”, accounting for about 73% respectively. The remaining three are “generally safe” and “relatively dangerous”, accounting for 18% and 9% respectively. This indicates that most of the universities have achieved a high standard of laboratory safety management, but there are still some that need to be further improved. The study also found that strengthening the safety culture and improving the safety awareness of laboratory personnel are the keys to reducing risks.
The intelligent control model of university laboratory safety risk based on digital twins not only improves the accuracy of risk assessment, but also provides a scientific basis for the development of targeted safety control measures.
At present, there are many problems in the evaluation process of safety risk indicator system in university laboratories, especially in the equipment facilities and hazardous chemical management cycle. However, I still have room for further improvement and in-depth study due to my personal ability, basic condition and research time:
the variety of laboratory types of colleges and universities mainly involves physics, chemistry, biology, machinery and pharmaceutical laboratories, while individual laboratories are not able to represent the risk of the laboratory, although it is not possible to compare the critical quantities of the various types of hazardous chemicals and various properties of the various kinds of properties. Therefore, only for the chemical and its conditions, the properties of the laboratory, the innovation of the theoretical basis, the appropriate method is used to analyze the evaluation, and the simulation experiment of the process neutral qualitative change is carried out, and the parameters of the use and storage critical quantity of different laboratory chemicals are studied. Similarly, instrument equipment can also conduct similar changes in the process mechanism.
In this paper, the application of digital twin technology to the safety management of university laboratories is only in the theory of theory, and the research is not deep enough, which can further explore the two associations, and express the vulnerability, adaptability and mutation of the university laboratory.
The intelligent management platform built in the article can further study the development of the intelligent platform to the ecological safety of university laboratories.
Manage all the risks of the system and achieve true integration.
This research was supported by the Science and Technology Research Program of Chongqing Municipal Education Commission (Grant No. KJZD—K202204302).


