Daylighting implies the controlled use of natural light in buildings to achieve desired visual, thermal and psychological comfort [1, 2, 3]. Many researchers have outlined the purpose of indoor natural daylighting, such as the possibility of improving task performance, social interaction, and energy efficiency, etc. In the 1970s, the global oil crisis prompted researchers to look at different ways to reduce energy demand, as it was estimated that artificial lighting alone accounted for 20% to 40% of the energy consumed in the building industry [4, 5, 6]. As a result, the research community attempted to incorporate the concept of natural daylighting into building practices, and building performance modeling received a lot of attention. With the growing need for a better life, comprehensive and diversified development is increasingly becoming the goal pursued by modern people, and people’s concern and demand for sports are increasing. As an important carrier of sports, how to better serve the residents of the stadium is a topic that has attracted the attention of many scholars [7, 8, 9].
The 2022 Hangzhou Asian Games will bring a new wave of gymnasium construction in the city, and how to build green Asian Games venues has become a new challenge. Among them, college gymnasiums have become an important type of indoor sports venues for the Asian Games in terms of new construction and renovation due to their “high number” and “high utilization rate” [10, 11, 12]. In the past, due to the natural light is unstable, subject to climate, difficult to control and other shortcomings, whether the stadium needs natural lighting is a controversial issue. However, with the improvement of national living standards, people’s demand for indoor environment quality of gymnasiums is getting higher and higher, and the previous “black house” gymnasiums have been unable to meet people’s demand for a healthy sports environment. For the long-term reliance on active energy supply, the lack of natural adjustment of the stadium, very easy to cause the space inside the light environment pollution, poor ventilation, improper insulation and other problems, the quality of its spatial environment is very unfavorable to the health of the sports crowd. Therefore, the quality of the indoor space of the stadium directly affects the health of the users. However, at present, most of the stadiums of universities in Hangzhou rely excessively on artificial systems to regulate the indoor environment and lack the consideration of green building technology at the natural level [13, 14, 15]. For the post-game operation of stadiums, reasonable natural light design can not only make full use of natural light to effectively improve the quality of the light environment in the sports venues, improve the visual comfort of sports personnel, but also reduce the daily lighting energy consumption, It helps to achieve the goal of green and sustainable development. At present, dynamic lighting evaluation has become the mainstream direction of natural lighting evaluation at home and abroad. Compared with static lighting evaluation, dynamic lighting evaluation indexes comprehensively consider diverse sky types, light climate characteristics, building orientation and the application of lighting aids, which provides a research basis for the design of natural lighting based on the light climate characteristics of the region [16, 17, 18].
This study takes the college gymnasium as an object and explores the optimal lighting scheme through dynamic light environment simulation. Firstly, a 3D model of the gymnasium is established using Daysim and Rhino & Grasshopper, and the light conditions under different light environments are simulated. Then, based on the multi-objective optimization method, the effects of different lighting design schemes are evaluated, focusing on the effects of top lighting, side lighting, and synergistic top and side lighting. By analyzing the illuminance model and visual comfort, the optimal lighting scheme is selected. Finally, specific design suggestions and optimization strategies are proposed to provide guidance for the lighting design of college gymnasiums.
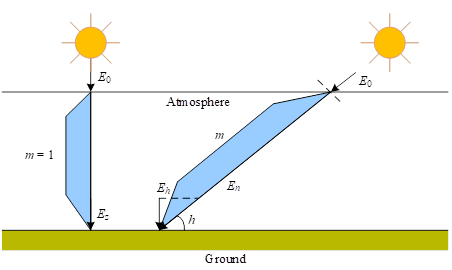
Direct sunlight when passing through the atmosphere, due to be absorbed or reflected, so the intensity of direct sunlight will be weakened, usually called in the atmosphere and the sun’s light perpendicular to the plane of illuminance for the atmosphere normal illuminance, which is with the distance between the sun and the earth and change, so when the season and time to change the atmosphere normal illuminance will also change. astronomy will be the average of the sun to the earth at the perihelion point and aphelion point as the mean distance from the sun to the earth, when the sun to the earth for the average distance, called the atmosphere normal illuminance for the solar illuminance constant, size 1337001x. Astronomy will be the perihelion and aphelion distance from the sun to the earth as the average distance from the sun to the earth, when the sun to the earth for the average distance, said the atmosphere outside the normal illuminance for the solar illuminance constant, the size of 1337001x. Definition of the sun and the earth at a certain time of the distance from the sun to the earth and the average distance from the sun to the earth ratio of r, outside the atmosphere of the normal illuminance for the \(E_{0}\), the solar illuminance constant for the \(E_{e}\), then the relationship between the \(E_{0}\) and the \(E_{e}\) is \[\label{GrindEQ__1_}\tag{1} E_{0} =\frac{E_{e} }{r^{2} }.\]
Definition of the sun in the zenith when the earth’s surface normal illuminance \(E_{z}\) and the outer surface of the atmosphere at this time the ratio of the sun’s direct light normal illuminance \(E_{0}\) for the atmosphere of the transmittance rate P, the calculation of the expression as shown in Eq. 2, it is defined for clear weather, direct sunlight illuminance schematic diagram shown in Figure 1. It is related to the outside world of the weather conditions, when the weather is very sunny, P is generally taken as 0.75 \(\mathrm{\sim}\) 0.85, when the weather is generally clear when taken as 0.65 \(\mathrm{\sim}\) 0.75, when the weather is less cloudy and sunny when taken as 0.55 \(\mathrm{\sim}\) 0.65, when the weather is less cloudy and sunny when taken as 0.55 \(\mathrm{\sim}\) 0.65. When the weather is generally sunny take 0.65 \(\mathrm{\sim}\) 0.75, when the weather is less cloudy and sunny take 0.55 \(\mathrm{\sim}\) 0.65. \[\label{GrindEQ__2_}\tag{2} P=\frac{E_{z} }{E_{0} }.\]
The ratio of the atmospheric mass per unit area in the zenith direction to the atmospheric mass per unit area in the path of the direct sunlight is usually called the atmospheric optical mass m. There are two main methods of calculating the approximate atmospheric optical mass: Neglecting the irregularities of the earth’s surface, it can be approximated by using the cosecant value of the sun’s altitude, csch, and when the sun’s altitude, h, is greater than 10\(\mathrm{{}^\circ}\), the accuracy of the calculations in this way is higher, but when it is less than 10\(\mathrm{{}^\circ}\), the error will be larger, and Kittler has proposed a formula as shown in equation 3. h is less than 10\(\mathrm{{}^\circ}\), the error will be larger, Kittler proposed a calculation formula as shown in equation 3. \[\label{GrindEQ__3_}\tag{3} m=\frac{2\left(\sqrt{\sinh ^{2} +0.0031465} -\sinh \right)}{0.0031465}.\] Then the normal illuminance \(E_{n}\) of direct sunlight reaching the Earth’s surface is calculated as. \[\label{GrindEQ__4_}\tag{4} E_{n} =E_{0} \cdot P^{m}.\]
Because the sky light is the sunlight after many reflections to reach the ground, compared with direct sunlight is softer, at the same time, when the sky is cloudy or cloudy weather, the sun’s direct light almost can not directly reach the ground, and the sky light can reach the ground, so usually the sky light as a stable source of natural lighting.
Sky light as a stable source of natural lighting, it is necessary to understand the brightness of the sky light distribution, the weather conditions will directly affect the distribution of sky light brightness, when the sky is clear and cloudless, the brightness distribution is basically symmetrical along the sun and the zenith line, the line at the sky brightness is the largest, the greater the angle of offset the darker the brightness, the offset angle of 90 degrees, the sky light brightness is the smallest When the weather is cloudy, the sky light distribution is not uniform, from the sky light to the sky, the sky light distribution is not uniform, the sky light distribution is not uniform, the sky light distribution is not uniform, the sky light distribution, the sky light distribution is not uniform, the sky light distribution is not uniform, the sky light distribution, the sky light distribution is not uniform, the sky light distribution is not uniform. When the weather is cloudy, the sky light is unevenly distributed and becomes darker from the zenith to the ground.
In recent years, many scholars on the specific distribution model of the sky luminance have carried out a lot of research, in which the CIE (International Commission on Illumination) gives a total of 15 types of sky luminance distribution, including the CIE standard all-sunny sky and the CIE standard all cloudy sky, and between the two from all-sunny to all cloudy sky, any point in the sky and the position of the sun relationship is shown in Figure 2, if any point of the sky in the P-point of the luminance of the \(L_{\alpha } \left(cd/m^{2} \right)\), the zenith angle of \(Z(rad)\), the sun’s zenith luminance of the \(L_{z} \left(cd/m^{2} \right)\), the zenith angle of the \(Z_{s} (rad)\), the luminance distribution of P-point of the formula is expressed as: \[\label{GrindEQ__5_}\tag{5} L_{\alpha } =\frac{f(\chi )\cdot \varphi (Z)}{f\left(Z_{s} \right)\cdot \varphi (0)} L_{z}.\]
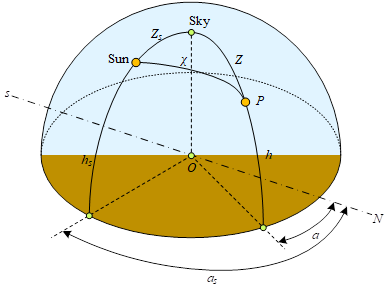
In Eq. 5, \(\chi\) is the angular distance between the sun and point P, and its computational expression is, \[\label{GrindEQ__6_}\tag{6} \chi =\arccos \left[\left(\sinh h_{s} \cdot \sinh \right)+\left(\cosh _{s} \cdot \cosh \cdot \cos \left|a_{s} -a\right|\right)\right],\] where \(h_{s} (rad)\) is the altitude of the sun, \(\alpha _{s} (rad)\) is the azimuth of the sun, \(h(rad)\) is the altitude angle of the sun at point P, and is the azimuth of the point.
\(\varphi (Z)\) is called the brightness asymptotic function, which is expressed by the following formula, \[\label{GrindEQ__7_}\tag{7}. \varphi (Z)=1+\exp \left(\frac{b}{\cos Z} \right).\] \(f(\chi )\) is the relative scattering index, expressed as, \[\label{GrindEQ__8_}\tag{8} f(\chi )=1+c\left[\exp (d\chi )-\exp \left(d\frac{\pi }{2} \right)\right]+e\cdot \cos ^{2} \chi.\]
The coefficients \(a,b,c,d,e\) are taken according to different skies, and are determined with specific reference to the general sky parameters of the CIE standard.
CIE standard full cloudy, full sunny and general sky brightness parameters are expressed by the relative value of zenith brightness, if you want to know its absolute value, you must know its value, there are many ways to calculate the zenith brightness, commonly used is the Nakamura given by the full cloudy, full sunny and the general sky under the zenith brightness of the absolute value of the method of calculation, the expression is; \[ \begin{equation} \label{GrindEQ__9_}\tag{9} L_{zo}=15.0\sin ^{1.68} h_{s} +0.07, \end{equation}\] \[\begin{equation} \label{GrindEQ__10_}\tag{10} L_{zc}=6.4\tan ^{1.18} \left(0.846h_{s} \right)+0.14, \end{equation}\] \[\begin{equation} \label{GrindEQ__11_}\tag{11} L_{zi} =9.9\sin ^{1.68} h_{s} +3.01\tan ^{1.18} \left(0.846h_{s} \right)+0.112. \end{equation}\]
Equations \(L_{zo} \left(kcd/m^{2} \right)\), \(L_{zc} \left(kcd/m^{2} \right)\) and \(L_{zi} \left(kcd/m^{2} \right)\) denote the absolute value of zenith brightness under fully cloudy, fully clear and normal skies respectively, and \(h_{s} (rad)\) is the solar altitude angle.
In China, the evaluation of building daylighting performance is mainly based on the daylighting coefficient specified in the Building Lighting Design Standard (GB50033-2013). Although the optimization objectives of natural daylighting in this study are UDI100-2000 and DA, both of them are calculated on the basis of the same working surface as the daylighting coefficient. The morphology parameters affecting the indoor natural daylighting are summarized through the analysis of the formula for calculating the daylighting coefficient as follows, \[\begin{equation} \label{GrindEQ__12_}\tag{12} C_{av} =A_{c} \tau \theta /A_{z} \left(1-\rho _{j}^{2} \right), \end{equation}\] \[\begin{equation} \label{GrindEQ__13_}\tag{13} \tau =\tau _{o} \cdot \tau _{c} \cdot \tau _{w}, \end{equation}\] \[\begin{equation} \label{GrindEQ__14_}\tag{14} \rho _{j} =\frac{\sum \rho _{j} A_{i} }{\sum A_{i} } =\sum \rho _{j} A_{i} /A_{z}, \end{equation}\] \[\begin{equation} \label{GrindEQ__15_}\tag{15} \theta =\arctan \left(\frac{D_{d} }{H_{d} } \right), \end{equation}\] \[\begin{equation} \label{GrindEQ__16_}\tag{16} A_{c} =C_{av} A_{z} \left(1-\rho _{j}^{2} \right)/\tau \theta, \end{equation}\] where \(A_{c}\) is the area of the window opening \(\left(m^{2} \right)\), \(A_{z}\) is the total indoor surface area \(\left(m^{2} \right)\), \(\theta\) is the angular value of the vertical visible sky calculated at the center point of the window, without outdoor shading \(\theta\) is \(90{}^\circ\), \(A_{i}\) is the area of each surface corresponding to the \(\rho _{{\rm j}}\), \(D_{d}\) is the distance of the shading object opposite to the window from the window \((m)\) and \(H_{d}\) is the average height of the shading object opposite to the window from the center of the window \((m)\).
Among them, the window opening area \(A_{c}\) is determined by the height, width and number of windows, the total indoor surface area \(A_{z}\) depends on the width of the classroom opening and the total depth, the angle \(\theta\) depends on the height of the outdoor shelter building, window height, window width, sill height, but because the height of the outdoor shelter building needs to be analyzed by specific design, and is not suitable to be the research parameter for the universal architectural morphology. Similarly, the distance from the window to the window shading object \(D_{d}\) is affected by the master plan, which is not suitable to be used as the morphology parameter in this study, and the indoor surface area \(A_{i}\) is affected by the building height, openings and depth of the building, for the space with double side lighting, the external window shading and the external corridors also obviously affect the indoor natural lighting environment.
To summarize, the morphological parameters affecting natural lighting in gymnasiums are building orientation, building height, classroom openings, window height, window width, number of windows, sill height, width of window shading, and width of external corridors.
In this paper, we use the method of light flux transfer function matrix to establish the mathematical model of spatial illuminance. for the closed indoor space, assuming that there are \(m\) planes in the space, a single plane is a uniform diffuse reflective surface, in order to facilitate the study of the effect of mutual reflection of each surface in the space, the plane will be divided into a number of surface elements, the point \(i\) and the point \(j\) for the point of the plane \(A_{i}\) and reflective surface \(A_{j}\), the reflectance of \(A_{i}\) and \(A_{j}\) are \(\rho _{i}\) and \(\rho _{j}\), respectively.
The illuminance of the plane \(A_{i}\) where point \(i\) is located is composed of two parts, direct illuminance \(E_{di}\) and reflected illuminance \(E_{ri}\), so the expression for the calculation of \(E_{i}\) is, \[\label{GrindEQ__17_}\tag{17} E=E_{di} +E_{ri}.\]
Since the reflecting surface \(A_{j}\) has uniform diffuse reflection properties, the reflected illuminance \(E_{rij}\) produced by the reflecting surface \(A_{j}\) at point \(i\) on the \(A_{i}\) surface is, \[\label{GrindEQ__18_}\tag{18} E_{rij} =\int _{A_{j} }\frac{E_{j} \cdot \rho _{j} \cdot \cos \theta _{1} \cdot \cos \theta _{2} }{\pi r_{ij}^{2} } dA_{j},\] where \(E_{j}\) is the illuminance of the reflecting surface \(A_{j}\), \(\theta _{1}\) represents the deflection angle of the reflected light, \(\theta _{2}\) represents the angle between the incident light and the normal of the plane \(A_{i}\), and \(r_{ij}\) is the distance between the two surface elements.
Let \(\varepsilon _{j} (i,j)=\cos \theta _{1} \cdot \cos \theta _{2} /\pi r_{ij}^{2}\) be the intrinsic parameter of illuminance, then we have \[\label{GrindEQ__19_}\tag{19} E_{rij} =\int _{A_{j} }E_{j} \cdot \rho _{j} \cdot \varepsilon _{j} (i,j)dA_{j}.\]
Since the reflected illuminance \(E_{ri}\) is the superposition of the illuminances of all reflecting surfaces in space at point i in the plane \(A_{i}\) \[\begin{equation} \label{GrindEQ__20_}\tag{20} E_{i} =E_{di} +\sum _{j=1,j\ne i}^{m}E_{rij} =E_{di} +\sum _{j=1,j\ne i}^{m}\int _{A_{j} }E_{j} \cdot \rho _{j} \cdot \varepsilon _{j} (i,j)dA_{j}. \end{equation}\] Then the total illuminance of the plane \(A_{i}\) is \[\begin{equation} \label{GrindEQ__21_}\tag{21} \int _{A_{i} }E_{i} dA_{i} =\int _{A_{i} }E_{di} dA_{i}\quad +\sum _{j=1,j\ne i}^{m}\int _{A_{i} }\int _{A_{j} }E_{j} \cdot \rho _{j} \cdot \varepsilon _{j} (i,j)dA_{i} dA_{j}. \end{equation}\]
When the area of the plane \(A_{i}\) is very small, then the illuminance on the plane \(A_{i}\) can be approximated as a constant \(E_{i}\) constant, \[\label{GrindEQ__22_}\tag{22} E_{i} \cdot A_{i} =E_{di} \cdot A_{i} +\sum _{j-1,j\ne i}^{m}E_{j} \cdot \rho _{j} \cdot A_{i} \cdot F_{ij},\] where, \(F_{ij}\) is the optical flux transfer coefficient from \(A_{j}\) to \(A_{i}\).
Dividing both sides of Eq. 22 simultaneously by \(A_{i}\) yields, \[\label{GrindEQ__23_}\tag{23} E_{i} =E_{di} +\sum _{j-1,j\ne i}^{m}E_{j} \cdot \rho _{j} \cdot F_{ij}.\]
Since the plane \(A_{j}\) is a uniform diffuse reflecting surface, we have \[\label{GrindEQ__24_}\tag{24} \varphi _{i} =\rho _{i} \cdot E_{i},\] where \(\varphi _{i}\) is the luminous flux of the tiny surface element at point i.
Multiplying both sides of Eq. 24 by \(\rho _{i}\) simultaneously yields, \[\label{GrindEQ__25_}\tag{25} \varphi _{cii} =E_{i} \cdot \rho _{i} -\sum _{j=1,j\ne i}^{m}E_{j} \cdot \rho _{i} \cdot \rho _{j} \cdot F_{ij},\] where \(\varphi _{di}\) is the luminous flux emitted by the tiny surface element at point i of direct illumination.
The matrix decomposition yields, \[\label{GrindEQ__26_}\tag{26} {\scriptscriptstyle\left[\begin{array}{c} {E_{1} } \\ {E_{2} } \\ {\vdots } \\ {E_{m} } \end{array}\right]=\left[\begin{array}{cccc} {\rho _{1} } & {-\rho _{1} \rho _{2} F_{12} } & {\cdots } & {-\rho _{1} \rho _{m} F_{1m} } \\ {-\rho _{2} \rho _{1} F_{21} } & {\rho _{2} } & {\cdots } & {-\rho _{2} \rho _{m} F_{2m} } \\ {\vdots } & {\vdots } & {\rho _{i} } & {\vdots } \\ {-\rho _{m} \rho _{1} F_{m1} } & {-\rho _{m} \rho _{2} F_{m2} } & {\cdots } & {\rho _{m} } \end{array}\right]^{-1} \left[\begin{array}{c} {\varphi _{d1} } \\ {\varphi _{d2} } \\ {\vdots } \\ {\varphi _{dm} } \end{array}\right]}\]
\[\label{GrindEQ__27_}\tag{27} \begin{array}{rcl} {G{}_{F} } & {=} & {\left[\begin{array}{cccc} {\rho _{1} } & {-\rho _{1} \rho _{2} F_{12} } & {\cdots } & {-\rho _{1} \rho _{m} F_{1m} } \\ {-\rho _{2} \rho _{1} F_{21} } & {\rho _{2} } & {\cdots } & {-\rho _{2} \rho _{m} F_{2m} } \\ {\vdots } & {\vdots } & {\rho _{i} } & {\vdots } \\ {-\rho _{m} \rho _{1} F_{m1} } & {-\rho _{m} \rho _{2} F_{m2} } & {\cdots } & {\rho _{m} } \end{array}\right]^{-1} } \\ {} \\ {} & {} & {} \\ {} & {=} & {\left[ \begin{array}{cccc} {g_{11} } & {g_{12} } & {\cdots } & {g_{1m} } \\ {g_{21} } & {g_{22} } & {\cdots } & {g_{2m} } \\ {\vdots } & {\vdots } & {g_{ii} } & {\vdots } \\ {g_{m1} } & {g_{m2} } & {\cdots } & {g_{mm} } \end{array}\right] } \\ {} \end{array}\] i.e., \(E=G_{F} \cdot \Phi\), where \(G_{F}\) is the transfer matrix of the luminous flux of the light source and the illuminance of the plane.
In the light source and illuminance reference point location to determine, the luminous flux transfer matrix \(G_{F}\) is also unchanged, and the light source flux output is not related to the illuminance \(E_{i}\) and luminous flux \(\varphi _{i}\) is linear change. Eq. 27 in the luminous flux transfer matrix parameters are more difficult to calculate, can be measured by the actual reference point illuminance and light source flux values using the least-squares method of fitting the calibration to obtain the \(G_{F}\).
In order to facilitate the understanding and calculation, it is further abbreviated as follows \[\label{GrindEQ__28_}\tag{28} E_{i} =\sum _{j=1,j\ne i}^{m}g_{ij} \cdot \varphi _{aj} =\sum _{j-1,j\ne i}^{m}E_{ij},\] where \(E_{i}\) is the total illuminance value at the ith detection point, and \(E_{ij}\) is the illuminance value of the jth luminaire at the ith detection point.
In the indoor light environment comfort lighting control, uniformity size determines the degree of visual fatigue, but also a not to be ignored judging indicators. from the definition, uniformity refers to the minimum value of the distribution of illuminance on the work surface and the ratio of the average value, in the previous section has been established in the work surface illuminance measurement of mathematical models, so you can select a uniform reference point on the work surface for the uniformity of the calculation of; \[\label{GrindEQ__29_}\tag{29} U_{k} =\frac{E_{\min } }{E_{av} } =\frac{\min \left(E_{k1} ,E_{k2} ,E_{k3} \cdots E_{kn} \right)}{\left(E_{k1} +E_{k2} +E_{k3} \cdots E_{kn} \right)/n},\] where \(U_{k}\) denotes the uniformity of the kth region, \(E_{kn}\) is the illuminance of the \(n\)th reference point in the kth region and \(n\) is the number of illuminance reference points.
This paper selects the gymnasium of Hebei University of Science and Technology, the gymnasium of Hebei Normal University, the gymnasium of Shijiazhuang Railway University, and the basketball, badminton, and volleyball gymnasiums of Hebei Institute of Physical Education in Shijiazhuang area as the research sites, and it mainly focuses on the measurements of spatial dimensions of the gymnasium’s competition halls and the dimensions of the field, the records of the indoor finishing materials (walls, ceilings, floors, etc.), and the records of the actual measurements of the lighting outlets (area, position, and orientation).The basic information of gymnasiums of Shijiazhuang area colleges and universities is shown in Table 1.
| University gymnasium |
Competition hall space parameters
(Length X width X height) |
Lighting form | Types of court sports | Seating arrangement |
| Shijiazhuang Railway Gymnasium | 53m X 42m X 16m | Side window | Basketball | North-south arrangement |
| Hebei University of Science and Technology | 64m X 57m X 14m | Side window | Basketball | East and west layout |
| Hebei Normal University | 55m X 38m X 11m | Side window | Basketball, badminton and table tennis | No |
| Hebei Sports Institute basketball arena | 40m X 20m X 7.5m | Side window | Basketball | No |
| Hebei Institute of Sport badminton hall | 45m X 20m X 10m | Side window | Badminton | No |
| Hebei Institute of Physical Education volleyball hall | 56m X 30m X 15m | Side window | Volleyball | No |
The visual comfort of natural light environment was evaluated in the gymnasium of Hebei Normal University and the volleyball court of Hebei Institute of Physical Education.
The time of the study was chosen from December 2021 to January 2022, and the subjective evaluation of the field personnel was conducted on sunny, cloudy and cloudy days respectively.
From 9:00 to 17:00, with an interval of 1 hour, firstly, in order to ensure that the subjects were not interfered by the light environment of other areas, they were asked to close their eyes for 60s in the area of the first basketball frame, then open their eyes and perform dribbling or shooting movements randomly under the natural light environment of the area to fully feel the light environment of the area, and close their eyes for 60s to feel the light environment of the area under the movement condition after the end of the study. Fill in the subjective evaluation scale after completion of all the tasks.
Illumination measurement method: according to the “lighting measurement method” (GB/T 5699-2017) in the four corners of the cloth point method, select the distance from the ground 0.8m horizontal surface for illumination measurement. each sports evaluation area uniformly arranged horizontal illuminance measurement point, so that the measurement point uniformly cover all the sports venues in the hall, each point measurement three times to take the average value of its illuminance, then according to the number of horizontal illuminance measurement value of each measurement area, calculate the average illumination of the region. The average illuminance value of the area was calculated based on several horizontal illuminance measurements of each measurement area.
With the objective evaluation method of visual comfort evaluation, Weber-Fechler’s law can be used to link the visual comfort evaluation with the horizontal illuminance, and the generalized Weber-Fechler’s law has the following formula, \[\label{GrindEQ__30_}\tag{30} {\rm g}\left(S\right)={\rm a}\times {\rm ln}\left(R\right)+{\rm b},\] where \(R\) is the value of the physical stimulus that produces the sensory quantity.
A mathematical model of visual comfort S and the physical quantity R can be obtained by performing a Taylor series expansion as follows, \[\label{GrindEQ__31_}\tag{31} S={\rm b}_{0} +{\rm b}_{1} {\rm ln}R+{\rm b}_{{\rm 2}} \left({\rm ln}R\right)^{2} +…+{\rm b}_{{\rm n}} \left({\rm ln}R\right)^{{\rm n}},\] where b\({}_{n}\) as a coefficient to be determined by the research and experimental data, the larger the value of n the more accurate the simulation results, generally take the value between 3-5 powers.
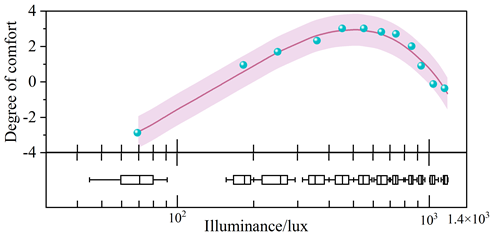
For the relationship between different average illuminance and visual comfort for data fitting, the sensory quantity S on behalf of visual comfort, E on behalf of the average illuminance for the physical stimulus quantity, this paper chooses the 4th power, in MATLLAB to solve, resulting in. \[\begin{equation} \label{GrindEQ__32_}\tag{32} S=-527.4144+390.6024\times (\ln E)-109.1014\times (\ln E)^{2} +13\times \ln E^{3} -0.6434\times \ln E^{4}, \end{equation}\] \[\begin{equation} \label{GrindEQ__33_}\tag{33} R2=0.9274. \end{equation}\]
Visual comfort S with the average illuminance E changes as shown in Figure 3, when the value of horizontal illuminance is lower than 584.40lx, visual comfort score with the decrease of illuminance and decrease, when the value of horizontal illuminance is higher than 584.40lx, visual comfort score with the increase of illuminance and decrease, in order to facilitate the subsequent simulation calculations, take the integer 580lx for the optimal value of illuminance.
When the visual comfort evaluation for more than 1 is for visual comfort, the level of illumination threshold for 280.06lx-889.53lx, combined with the actual study of stadium lighting standard side window illuminance value of 300lx and skylight illuminance value of 150lx. Therefore, the definition of visual comfort illuminance threshold for 300lx-890lx. -890lx.
(1) Simulation software
In this paper, a typical gymnasium space is investigated by simulation experiments using Daysim under the dynamic light environment conditions throughout the year, combined with the natural lighting coefficient, calling Rhino & Grasshopper platform for real-time algorithmic optimization of the parameters, using the plug-ins Ladybug & Honeybee for the setup of the sky model and the architectural materials, and then Radiance and DAYSIM software as the engine for the simulation and optimization of the lighting environment, and the results are visualized in Ladybug & Honeybee. DAYSIM software as the engine to optimize the lighting environment simulation, and the results are visualized in Ladybug & Honeybee.
(2) Evaluation index
Compared with the static lighting evaluation index, the dynamic lighting evaluation index has the advantage of better solving the geographical, orientation and time change of the building as well as the actual sky state, and is more accurate and comprehensive in comprehensively evaluating the performance of various kinds of heat and light of the building throughout the year.DA is defined as the percentage of the time that the minimum illuminance can be achieved by natural lighting alone during the working hours of the year. DA is defined as the percentage of time during a year-round work period that the minimum illumination requirements can be met by natural light alone. uDI is the illumination threshold value where UDI \(\mathrm{<}\) 100lx is considered too dark to work, 100lx \(\mathrm{<}\) UDI \(\mathrm{<}\) 2000lx is considered a range of illumination levels useful to the user, and UDI \(\mathrm{>}\) 2000lx is considered too bright to work. annual DGP value (aDGP), which refers to the amount of glare-free light in each view, is defined as the number of hours in each view where there is no glare. The value of annual DGP (aDGP), refers to the percentage of occupied hours in each view without glare (DGP is lower than the glare threshold), which has a time-dependent nature, in line with the uncertainty of natural light.
In this paper, DA300LX, UDI100-2000LX and aDGP(0.4) are selected as the initial multi-objective optimization evaluation indexes, and combined with the study and calculation of visual comfort illumination in the competition hall space, DA580LX and UDI300-890LX are selected to carry out a secondary evaluation of the optimal solution set of the initial multi-objective optimization, and a suitable typical model of the light opening design is screened out.
Based on the above research and analysis, it is determined that the typical model of Shijiazhuang area university gymnasium is 54m\(\mathrm{\times}\)47m\(\mathrm{\times}\)18m, the sports ground is 44m\(\mathrm{\times}\)36m, the building plane is rectangular, and the roof is horizontal. According to the “building lighting design standard” GB50033-2013, it can be concluded that the daily use time of the gymnasium building is 9:00-17:00.Daysim simulation global settings and other benchmark parameter settings are shown in Table 2.
According to the “Building Lighting Design Standard” GB50033-2013, it can be concluded that 9:00-17:00 is the specified daily use time of the gymnasium building.The global settings of Daysim simulation and other benchmark parameters are set as shown in Table 2. The establishment of the parametric lighting model is conducive to the adjustment of the changing parameters in the later period, which have a significant impact on the lighting effect. If the orientation of lighting is changed, the parameters can be directly adjusted directly to change the typical model.
The environmental parameters include two parameters of window shading and outdoor illuminance, outdoor shading is related to the building site selection, and the general design of the gymnasium for safety evacuation considerations, the perimeter is more open, less shading, and the \(\theta\) value can be defaulted to 90\(\mathrm{{}^\circ}\). The outdoor illuminance Ew is related to the sun’s altitude and azimuth, sky condition, cloudiness, geographic location and other factors, and it can be seen from the measured data that there are obvious differences in the quantity and quality of light in the pavilion in different light climate zones.
| Daysim Global setting | Set other benchmark parameters | ||
| Sky model | Perez Sky model | Depth | 54m |
| Simulated location | Shijiazhuang | Face width | 47m |
| Outdoor obstacle | No | Height between floors | 18m |
| Simulation time | 9:00-17:00 | Roof form | Horizontal parallel type |
| Sunshade system | No | Sunlight transmittance of glass | 0.75 |
| Parameter plane height | 1.5m | Interior material reflection ratio | Ceiling 0.2 |
| Wall facing 0.75 | |||
| Whether anyone is using | Yes | Flooring 0.3 | |
| Plane graph |
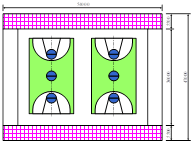
|
Parametric model |
|
The depth and height of the gymnasium will have an important impact on the quality of the natural light environment, this paper through the study of the typical model of Shijiazhuang college gymnasium side window wall ratio, skylight window to floor ratio, lighting direction and glass material four design parameters for single-factor simulation and multi-objective optimization. decision-making variables, the design of thresholds are shown in Table 3, which is a significant change in the impact of the gymnasium thermal lighting environment of the side window wall ratio and skylight window to floor ratio, to more accurately screen the optimal lighting parameters, set 0.05 for the threshold change amount of the side window to wall ratio and skylight window to floor ratio. The significant changes in the daylighting environment of the gymnasium are the side-wall and skylight window-to-wall ratios, and in order to more accurately screen the optimal daylighting parameters, 0.05 is set as the threshold change amount of the side-window window-to-wall ratio and the skylight window-to-ground ratio.
| Decision variable | Threshold value | Threshold change |
|---|---|---|
| Windows and walls are better than | 0-0.6 | 0.05 |
| Window to floor ratio | 0-0.5 | 0.05 |
| Lighting orientation | 0\(\mathrm{{}^\circ}\)-90\(\mathrm{{}^\circ}\) | 10\(\mathrm{{}^\circ}\) |
| Glass material transmittance | 0.75, 0.86, 0.51, 0.62, 0.48 | |
The window-to-wall ratio, window-to-floor ratio, glass material and lighting orientation of a typical model competition hall space are taken as variables for the study. According to the requirements of the relevant specifications, the method of controlling variables is adopted, and a single factor is selected as a variable to keep other design parameters unchanged, and the impacts of the window-to-wall ratio, window-to-floor ratio, glass material, and lighting orientation on the dynamic daylighting indexes DA300LX, UDI100-2000LX, and glare evaluation index aDGP(0.4) are investigated on the parameterized simulation platform. -2000LX and glare evaluation index aDGP(0.4) are investigated on the parameterized simulation platform, and the results are as follows.
The window-to-wall ratio was set between 0 and 0.6, the step length and window-to-ground ratio were set to 0.1, the glass transmittance was set to 0.75, and the orientation of the building was set to 0\(\mathrm{{}^\circ}\). The changes in the window-to-wall ratio of the competition hall space on the changes in the DA300LX, the UDI100-2000LX, and the aDGP(0.4) are shown in Figure 4.
The change of the window-to-wall ratio of the competition hall space has a greater impact on the indoor all-natural daylighting percentage ratio; when the window-to-wall ratio is between 0 and 0.3, the DA300LX value rises significantly, and after the window-to-wall ratio is more than 0.3, the rising trend of the DA300LX value turns to be smooth. The effect of the change of window-wall ratio on the effective indoor lighting UDI100-2000LX in the competition hall space is more significant, the larger the window-wall ratio is, the smaller the UDI100-2000LX is, the worse the indoor lighting environment is. when the window-wall ratio is between 0-0.1, the indoor UDI100-2000LX accounts for more than 50% of the indoor lighting effect is better, but when the window-wall ratio is more than 0.1, the quality of the indoor lighting is poorer. Under the premise of window-to-ground ratio of 0.1, when the window-to-wall ratio becomes 0, i.e., only the skylight lighting state, the indoor glare time accounted for the smallest, but with the increase of the window-to-wall ratio, the smaller the aDGP, the more likely to be problems with the indoor lighting environment. window-to-wall ratio of the indoor lighting changes are more obvious, especially on the UDI100-2000LX the greatest effect.

The window-to-ground ratio is controlled between 0 and 0.5, the step length and window-to-wall ratio are set to 0.1, the glass transmittance is set to 0.75, and the building orientation is set to 0\(\mathrm{{}^\circ}\). The effect of the change of the window-to-ground ratio of the competition hall space on the DA300LX, the UDI100-2000LX, and the aDGP(0.4) is shown in Figure 5. The effect of the change of the window-to-ground ratio on the percentage of all-natural daylight is more obvious only when the ratio is between 0 and 0.1, and the effect of DA300LX value on side windows is more obvious compared with skylights. The effect of DA300LX is more obvious only when the ratio is between 0 and 0.1, and the effect of DA300LX on side windows is more obvious compared to skylights. window-to-ground ratio has a strong effect on UDI100-2000LX, and the larger the window-to-ground ratio is, the smaller the ratio of indoor effective illuminance is, and when the window-to-ground ratio is 0, i.e., it is only for the side lighting, and indoor effective illuminance UDI100-2000LX up to 95.45%, window to ground ratio is greater than 0, indoor effective illuminance accounted for a very small, completely unable to meet the needs of indoor lighting. the reason for this, the larger the skylight light port, the more light indoor, indoor illuminance UDI2000LX ratio is higher, the more unsuitable for the design of the light port. the change of the window to ground ratio of the aDGP(0.4) has a significant impact on the aDGP(0.4), the larger the window to ground ratio, the aDGP is higher than the window to ground ratio, the aDGP is higher than the window to ground ratio, the aDGP is higher than the window to ground ratio, the aDGP is higher than the window to ground ratio. The larger the window-to-ground ratio is, the smaller the proportion of aDGP is. among them, the change is more obvious when the window-to-ground ratio is between 0 and 0.4, and when the window-to-ground ratio is more than 0.4, the change of aDGP is very small. in summary, it can be seen that the change of the window-to-ground ratio on the extent of the influence of the aDGP is not static, and when it exceeds a certain value, its change tends to be flat. the window-to-ground ratio on the indoor lighting changes significantly, especially on the UDI100-2000LX and the UDI100-2000LX, and the UDI100-2000LX and the UDI100-2000LX and the UDI100-2000LX and the UDI100-2000LX. The window-to-ground ratio has a significant effect on indoor lighting, especially on UDI100-2000LX and aDGP.
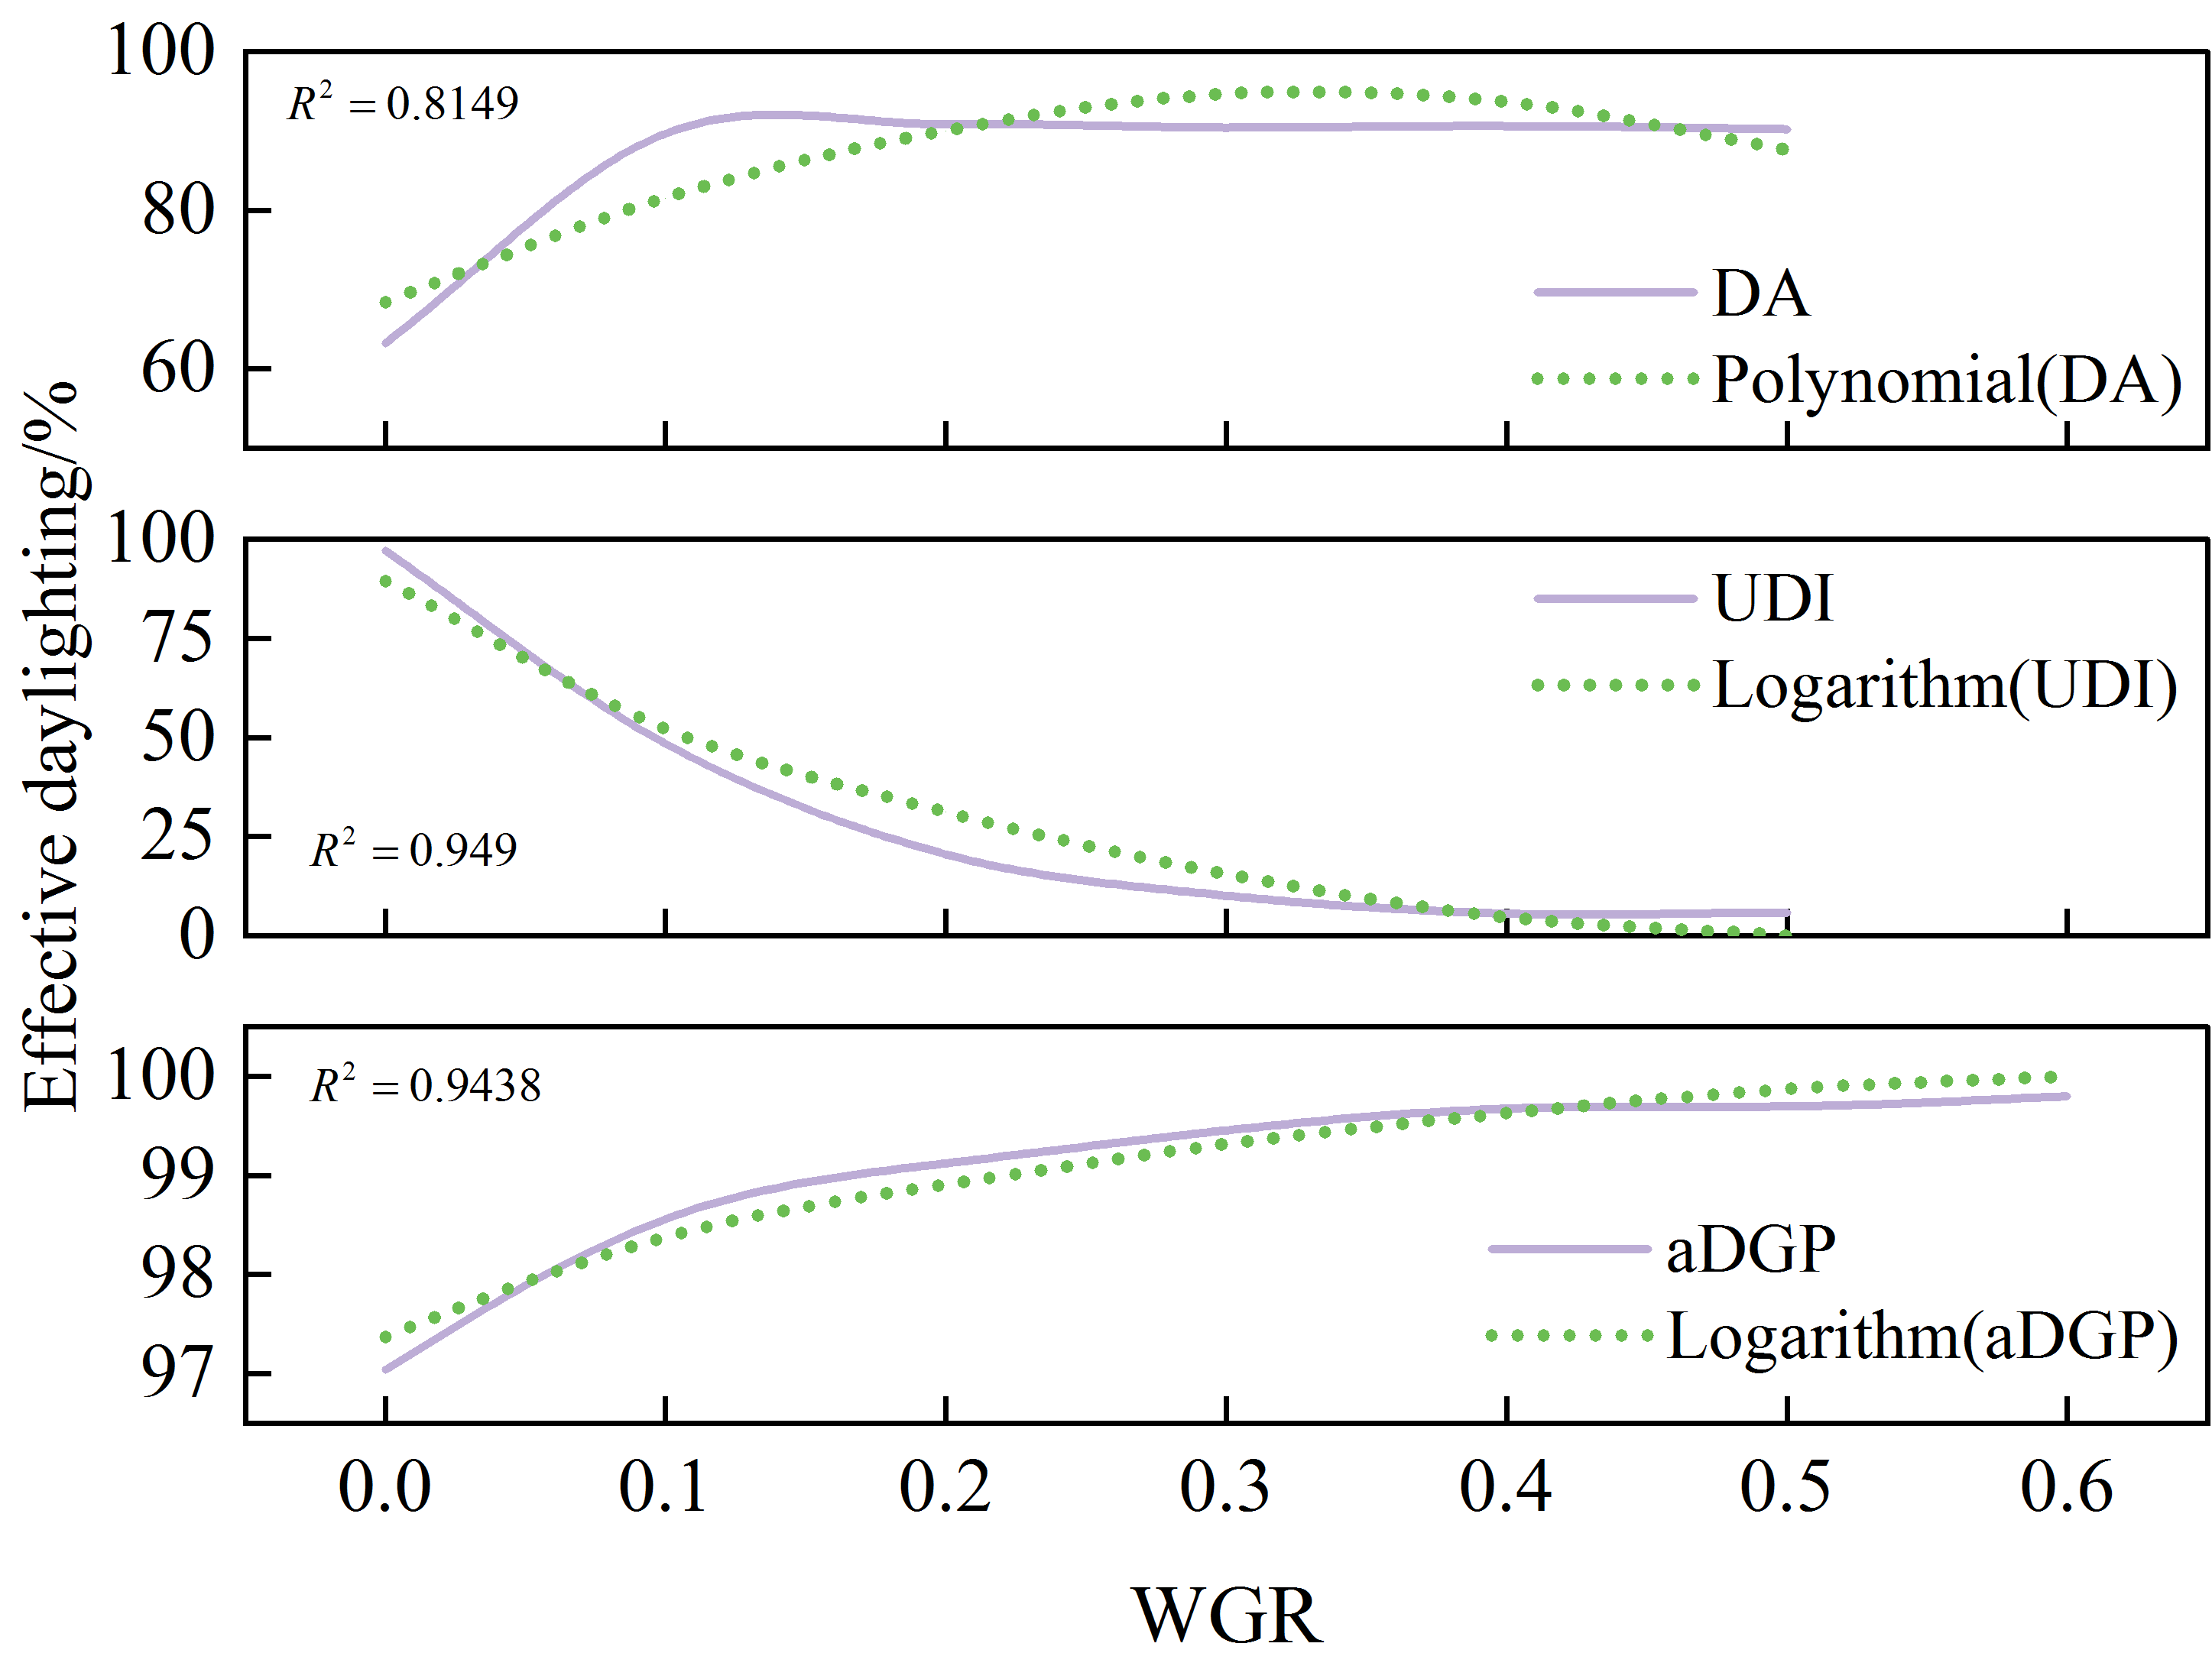
Changing different glass materials, the window-to-wall ratio is set to 0.1, the window-to-ground ratio is set to 0.1, and the orientation of the building is set to 0\(\mathrm{{}^\circ}\). The influence of the change of the glass material of the competition hall on the DA300LX, UDI100-2000LX, and aDGP(0.4) is shown in Figure 6, and the influence of the change of the glass material on the DA300LX is obvious, and the smaller the transmittance of the glass ratio, the smaller the DA300LX is in the room. But the overall analysis shows that no matter how the glass material changes, the indoor DA300LX is above 90%, and the space of the competition hall is sufficiently illuminated. The change of the glass material has a significant effect on the change of UDI100-2000LX, and its value can be changed from 40% to 80%, and the smaller the transmittance ratio of the glass is, the higher is the effective luminance of UDI100-2000Lx. It shows that the change of glass transmittance ratio can effectively change the amount of indoor light intake, so that the room to achieve a good lighting environment. glass transmittance ratio changes between 90% and 97%, can effectively change the proportion of indoor aDGP, when the glass transmittance ratio is smaller, the higher the indoor aDGP, indicating that indoor glare generated by the time of the smaller the proportion of the time of the glass. glass material changes on the change of indoor lighting changes the effect of obvious, of which on the UDI100-2000Lx, the effective light UDI100-2000Lx is higher. The influence of glass material change on the change of indoor lighting is obvious, among which the influence on UDI100-2000LX is the largest, and the influence on aDGP is the second most significant.
Changing the lighting orientation of the competition hall, the window-to-wall ratio is set to 0.1, the window-to-wall ratio is set to 0.1, single glazing is used, and the transmittance ratio is set to 0.75. The influence of the change of the lighting orientation of the competition hall on the change of DA300LX, UDI100-2000LX, and aDGP(0.4) is shown in Figure 7 The south direction is 0\(\mathrm{{}^\circ}\), and the anticlockwise rotation of 10\(\mathrm{{}^\circ}\) east of the south is 10\(\mathrm{{}^\circ}\). The change of the building orientation on the change of DA300LX is complicated and varied, and does not show a single upward or downward trend, and it is extremely irregular. The influence of the change of building orientation on the change of DA300LX is complicated and varied, not showing a single upward or downward trend, and is extremely irregular.The change of lighting orientation from the due south direction to the south-east 10\(\mathrm{{}^\circ}\) reaches a peak, and in the south-east 40\(\mathrm{{}^\circ}\) reaches a second peak.The change of effective lighting and building orientation basically shows an upward spiraling trend, and the linear relationship is obvious, but the change of UDI100-2000LX value is smaller, of which the UDI100-2000LX value shows an upward spiraling trend, and the UDI100-2000LX value shows an upward spiraling trend, and the UDI100-2000LX value shows an upward spiral, with a clear linear relationship. The change of effective daylighting and building orientation basically shows a spiral trend with obvious linear relationship, but the UDI100-2000LX value is small, among which, with the change of building orientation, the UDI100-2000LX undergoes a wave change at 10\(\mathrm{{}^\circ}\) intervals, and there is a substantial increase after 60\(\mathrm{{}^\circ}\) S.E. The change of the orientation of the competition hall space is relatively small, but the trend of the change is obvious and irregular, and three peaks are reached around 10\(\mathrm{{}^\circ}\) S.E., 30\(\mathrm{{}^\circ}\)\(\mathrm{\sim}\)40\(\mathrm{{}^\circ}\) and 70\(\mathrm{{}^\circ}\), among which the change is most obvious at 30\(\mathrm{{}^\circ}\)\(\mathrm{\sim}\)60\(\mathrm{{}^\circ}\) S.E. The change of orientation is most obvious, and the change of orientation is more obvious, and the peak is reached near 70\(\mathrm{{}^\circ}\). The most obvious change, the change of orientation can affect the value range of aDGP, but the influence of the change is small. therefore, combined with the comprehensive analysis of DA300LX and UDI100-2000LX, the change of orientation of the competition hall space on the change of indoor lighting changes is obvious, but the range of change is small.

The optimal solution of multi-objective optimization is shown in Table 4.Comparing the evaluation indexes of optimal solution and typical model, the DA300lx of typical model is the highest, but the other two evaluation indexes are lower, the DA300lx is large because of the large transmittance ratio of the glass, and the indoor intake of light is sufficient.According to the definition of the optimal solution, it shows that the percentage of time that can achieve the minimum requirement of 300lx by relying on the natural light only in the whole year, and there is no limitation on the maximum illumination, so it is not comprehensive to rely only on the single index of DA300lx, and the other two indexes should be considered comprehensively. According to its definition, it shows that in the working time of the whole year, only relying on the natural lighting can reach the minimum 300lx percentage of time, and there is no restriction on the maximum illuminance, so only relying on the single index of DA300lx is not comprehensive, and should be considered comprehensively in the other two indexes. combined with the other number of optimal solutions in addition to the evaluation indexes of DA300lx, the other two in the overall evaluation of the indexes has a significant improvement in the indoor lighting environment has been significantly improved, and the optimization solution is the global optimal.
| Serial number | Window wall ratio | Window ground ratio | Glass transmission ratio | Lighting orientation | DA\(_{300lx}\) | UDI\(_{100-2000lx}\) | aDGP(0.4) |
| 1 | 0 | 0.1 | 0.48 | 50\(\mathrm{{}^\circ}\) | 91.50% | 88.44% | 90.58% |
| 2 | 0.1 | 0 | 0.86 | 50\(\mathrm{{}^\circ}\) | 81.40% | 96.04% | 97.38% |
| 3 | 0.2 | 0 | 0.62 | 20\(\mathrm{{}^\circ}\) | 90.16% | 95.97% | 96.65% |
| 4 | 0.2 | 0 | 0.51 | 30\(\mathrm{{}^\circ}\) | 84.10% | 96.49% | 97.25% |
| 5 | 0.05 | 0.15 | 0.75 | 60\(\mathrm{{}^\circ}\) | 95.65% | 94.66% | 96.04% |
| 6 | 0.3 | 0 | 0.51 | 20\(\mathrm{{}^\circ}\) | 95.34% | 94.24% | 96.06% |
| 7 | 0.05 | 0.1 | 0.48 | 10\(\mathrm{{}^\circ}\) | 94.48% | 95.19% | 96.28% |
| 8 | 0.1 | 0.05 | 0.62 | 0\(\mathrm{{}^\circ}\) | 97.59% | 91.54% | 95.43% |
| 9 | 0.1 | 0.1 | 0.51 | 10\(\mathrm{{}^\circ}\) | 98.00% | 88.79% | 95.10% |
| Typical example | 0.1 | 0.1 | 0.75 | 0\(\mathrm{{}^\circ}\) | 98.62% | 48.23% | 91.14% |
In the multi-objective optimization simulation is completed, often because of other factors such as economic, energy consumption and other aspects of the secondary evaluation screening. the above multi-objective optimization of the light environment indicators are based on the standard specification of the evaluation indicators selected from the previous section of the Shijiazhuang area college gymnasium visual comfort illuminance thresholds, when the 580lx, can achieve the optimal visual comfort illuminance value. when in the 300lx – 890lx, for the acceptable visual comfort illuminance threshold. –Therefore, this paper for the research of visual comfort thresholds for secondary evaluation, in the previous optimal solution of the combination of decision variables, defined DA580lx and UDI300lx-890lx for visual comfort evaluation index, the optimal solution for secondary evaluation and screening. The results are shown in Table 5.
The results are shown in Table 5. Through the secondary optimization of visual comfort illuminance, from the performance of lighting efficiency, it can be seen that the side + roof synergistic lighting \(\mathrm{>}\) side lighting \(\mathrm{>}\) skylight lighting. number 5, 7, 8 and 9 are the side + roof synergistic lighting solutions, when the side + roof synergistic lighting, the indoor visual comfort illuminance time share is more than 50%, and the indoor lighting environment is good. combined with the evaluation indexes of DA580lx and UDI300lx-890lx, the number 8 and 8 are the best solutions. Combined with the evaluation indexes of DA580lx and UDI300lx-890lx, the lighting efficiency is balanced under visual comfort of No.8 and No.9, and the indoor lighting environment of No.5 is slightly lower than that of No.7, and the lighting environment of No.8\(\mathrm{>}\)No.9\(\mathrm{>}\)No.7\(\mathrm{>}\)No.5 in ascending order is the same as that of No.5, which is the synergistic analysis of the integrated side and top lighting.
No. 2, 3, 4, 6 for the side lighting program, when the side lighting, No. 4 DA580lx is lower than No. 2, but UDI300lx-890lx is higher than No. 2, because the DA580lx only provides the minimum value, easy to produce indoor light overload, while UDI300lx-890lx both the maximum and minimum values, can be a better evaluation of the indoor lighting environment. Compared with No. 2 and 4, No. 4 lighting is better than No. 2. Similarly, No. 3 and No. 6 comparison, No. 3 lighting environment is better than No. 6. lighting environment from high to low ranking, No. 4\(\mathrm{>}\)No. 2\(\mathrm{>}\)No. 3\(\mathrm{>}\)No. 6.
No. 1 is the top lighting, indoor visual comfort illumination time ratio DA580lx is 92.56%, UDI300lx-890lx is 52.89%, to meet the indoor visual comfort light environment.
| Serial number | Window wall ratio | Window ground ratio | Glass transmission ratio | Lighting orientation | DA\({}_{580lx}\) | UDI\({}_{300lx-890lx}\) |
|---|---|---|---|---|---|---|
| 1 | 0 | 0.1 | 0.48 | 50\(\mathrm{{}^\circ}\) | 92.56% | 52.89% |
| 2 | 0.1 | 0 | 0.86 | 50\(\mathrm{{}^\circ}\) | 90.93% | 62.59% |
| 3 | 0.2 | 0 | 0.62 | 20\(\mathrm{{}^\circ}\) | 88.26% | 53.44% |
| 4 | 0.2 | 0 | 0.51 | 30\(\mathrm{{}^\circ}\) | 89.98% | 62.63% |
| 5 | 0.05 | 0.15 | 0.75 | 60\(\mathrm{{}^\circ}\) | 95.68% | 51.49% |
| 6 | 0.3 | 0 | 0.51 | 20\(\mathrm{{}^\circ}\) | 95.31% | 50.67% |
| 7 | 0.05 | 0.1 | 0.48 | 10\(\mathrm{{}^\circ}\) | 93.13% | 58.91% |
| 8 | 0.1 | 0.05 | 0.62 | 0\(\mathrm{{}^\circ}\) | 92.26% | 71.12% |
| 9 | 0.1 | 0.1 | 0.51 | 10\(\mathrm{{}^\circ}\) | 94.85% | 69.34% |
In the previous paper, the dynamic simulation on the impact of window-to-wall ratio, window-to-ground ratio, lighting direction and glass material on the evaluation indexes was carried out, in which the results showed that when only the top lighting is available, the indoor can also achieve a good light environment. combined with the multi-objective optimization study, the optimal solution includes the top lighting scheme (No.1), and the typical model of the gymnasium in the design of the light opening should choose Low-E insulating glass (low transmittance), and lighting direction is 50\(\mathrm{{}^\circ}\) to the south-east, window-to-ground ratio is 0.1, and its dynamic lighting results are shown in Table 6. Orientation is thought to be 50\(\mathrm{{}^\circ}\) south-east, the window-to-ground ratio is 0.1, and its dynamic lighting results are shown in Table 6. The effective indoor illuminance of DA300lx, UDI100-2000lx, aDGP(0.4), DA580lx and UDI300-890lx are 91.50%, 88.44%, 90.58%, 92.56% and 52.89%, respectively.
| Serial number | DA\(_300lx\) | UDI\(_100-2000lx\) | aDGP(0.4) | DA\(_580lx\) | UDI\(_300-890lx\) |
| 1 | 91.50% | 88.44% | 90.58% | 92.56% | 52.89% |

|

|
|

|

|
Combined with Table 5 and Table 6 multi-objective optimization results, there are four optimal lighting solutions for side lighting, of which No. 2 and No. 4 visual comfort lighting quality is similar, No. 3 and No. 6 lighting quality is similar, but both can reach 50%. lighting quality from high to low, No. 4\(\mathrm{>}\)No. 2\(\mathrm{>}\)No. 3\(\mathrm{>}\)No. 6. the specific optimization of the design of lighting openings and dynamic lighting simulation is shown in Table 7.
No. 4 window to wall ratio of 0.2, tinted insulating glass, 30 \(\mathrm{{}^\circ}\) S.E. No. 2 window to wall ratio of 0.1, ordinary insulating glass, 50 \(\mathrm{{}^\circ}\) S.E. No. 3 window to wall ratio of 0.2, low-E insulating glass (light transmission), 20\(\mathrm{{}^\circ}\) S.E. No. 6 window to wall ratio of 0.3, tinted insulating glass, 20\(\mathrm{{}^\circ}\) S.E. No. 6 window to wall ratio of 0.3, tinted insulating glass, 20\(\mathrm{{}^\circ}\) S.E. No. 6 window to wall ratio of 0.3, tinted insulating glass, 20\(\mathrm{{}^\circ}\) S.E. No. 6 window to wall ratio of 0.3, tinted insulating glass, 20\(\mathrm{{}^\circ}\) S.E.
| Serial number | DA\({}_{300lx}\) | UDI\({}_{100-2000lx}\) | aDGP(0.4) | DA\({}_{580lx}\) | UDI\({}_{300-890lx}\) |
|---|---|---|---|---|---|
| 4 | 84.10% | 96.49% | 97.25% | 89.98% | 62.63% |
| 2 | 81.40% | 96.04% | 97.38% | 90.93% | 62.59% |
| 3 | 90.16% | 95.97% | 96.65% | 88.26% | 53.44% |
| 6 | 95.34% | 94.24% | 96.06% | 95.31% | 50.67% |
Side + roof synergistic lighting also contains four optimal lighting schemes, on the evaluation index DA300lx, UDI100-2000lx and aDGP analysis, the difference between the indoor lighting environment of each scheme is relatively small, the lighting quality is good, but with the second evaluation of the optimization of the DA580lx and UDI300-890lx simulation, the visual comfort of the lighting environment of the four lighting schemes is more different from the other. The quality of lighting from high to low is No.8\(\mathrm{>}\)No.9\(\mathrm{>}\)No.7\(\mathrm{>}\)No.5, combined with the analysis of the four programs, the side + roof synergistic lighting window-wall ratio and the window-ground ratio are between 0-0.1 its lighting effect is better, combined with the typical model comparative analysis, when the window-wall ratio and the window-ground ratio are in the 0.1, the focus should be on the consideration of the glass transmittance ratio and the lighting direction of the indoor light environment. The specific optimization scheme and dynamic lighting simulation are shown in Table 8.
No. 8 window-wall ratio 0.1, window-ground ratio 0.05, low-E insulating glass (medium transmission), south lighting. no. 9 window-wall ratio 0.1, window-ground ratio 0.1, tinted insulating glass, 10\(\mathrm{{}^\circ}\) south east. no. 7 window-wall ratio 0.05, window-ground ratio 0.1, Low-E insulating glass (low transmission), 10\(\mathrm{{}^\circ}\) south east. no. 5 window-wall ratio 0.05, window-ground ratio 0.15, ordinary glass, 60\(\mathrm{{}^\circ}\) south east. no. 5 window-wall ratio 0.05, window-ground ratio 0.15, ordinary glass, 60\(\mathrm{{}^\circ}\) south east. no. 6 window-wall ratio 0.05, window-ground ratio 0.15, low transmission. no. 6 window-wall ratio 0.05, window-ground ratio 0.15, ordinary glass, 60\(\mathrm{{}^\circ}\) south-east. Glass, 60\(\mathrm{{}^\circ}\)south by east.
| Serial number | DA\({}_{300lx}\) | UDI\({}_{100-2000lx}\) | aDGP (0.4) | DA\({}_{580lx}\) | UDI\({}_{300-890lx}\) |
|---|---|---|---|---|---|
| 8 | 97.59% | 91.54% | 95.43% | 92.26% | 71.12% |
| 9 | 98.00% | 88.79% | 95.10% | 94.85% | 69.34% |
| 7 | 94.48% | 95.19% | 96.28% | 93.13% | 58.91% |
| 5 | 95.65% | 94.66% | 96.04% | 95.68% | 51.49% |
In terms of lighting efficiency, skylight lighting is better than side window lighting, and skylight lighting illumination distribution is more uniform, and the probability of glare is smaller, therefore, in the optimization of the natural light environment design of college gymnasiums, in order to improve the quality of the gymnasium’s lighting, skylights should be used as the main lighting, supplemented by the side window lighting. The existing gymnasium lighting uniformity is not high, to solve this problem and improve the uniformity of indoor lighting, double side lighting should be set up, rather than simply relying on increasing the skylight lighting area. Therefore, the adjustment of college gymnasium lighting design strategy should be considered throughout the year for skylight and side window lighting. In the case of meeting the lighting needs and illumination standards, the overall skylight area should not be too large. Side windows are recommended in the choice of double-sided good side windows at the same time, try to reduce the interval distance between the side windows, the area of lighting is not recommended to be too large. When designing the light environment, it should be adapted to the local conditions, combined with the local light environment conditions, and at the same time, the outdoor shelter factor should be considered. For example, in the case of low side windows, for the back wall, try not to choose the dominant direction of the athletes’ game.
This study conducted an in-depth analysis and optimization of lighting solutions for college gymnasiums through dynamic light environment simulation. The results show that the top lighting scheme can effectively control glare and improve visual comfort while ensuring sufficient indoor illumination. Specifically, the effective indoor illuminance of DA300lx, UDI100-2000lx, aDGP(0.4), DA580lx, and UDI300-890lx of the top lighting scheme perform well. In addition, the side lighting scheme also shows good lighting effect with different window-to-wall ratio, window-to-ground ratio and glass material configurations. Especially in the side + roof synergistic lighting scheme, it not only ensures the uniformity and adequacy of indoor illumination, but also significantly improves the visual comfort.
This scheme has reached an excellent level in several evaluation indexes, showing the great potential of synergistic lighting scheme in practical application. This study provides a scientific theoretical basis and practical design guidance for the lighting design of college gymnasiums, which is of great significance for improving the comfort and energy-saving effect of gymnasiums.
Although this paper puts forward a specific program on the stadium lighting model, but there are still deficiencies and places worthy of improvement, the subsequent improvement and depth can be mainly by the following points:
The typical model of colleges and universities selected in this paper is applicable to the whole country, but the typical model of colleges and universities in different light climate zones may have differences. Therefore, subsequent research can be carried out on the typical regional college gymnasium model to make the conclusions obtained from the simulation have more accurate applicability.
The evaluation criteria of indoor environmental quality in gymnasiums are more, this paper only focuses on the light environment, and does not consider the indoor thermal environment and natural ventilation, etc., which can be synergistically optimized and comprehensively compared in order to make the conclusions more valuable for practical application.
In order to facilitate the comparative study, this paper’s light port and lighting program selection is more traditional and simple, can not be well suited to the aesthetic requirements of the stadium building design, the follow-up can be combined with the aesthetics of the façade of the light port and the form of sunshade for comprehensive consideration. In the optimization of the lighting assistance system, the simulation selected a fixed shading mode, and with the development of new technologies, dynamic shading can better regulate the indoor lighting environment, which is also worth continuing in-depth research in the direction of the future.
Due to time constraints, the conclusions obtained from the simulation in this paper could not be verified in actual projects, and it is hoped that the accuracy of the simulation conclusions can be verified through practical projects in the future.
This research was supported by the 2022-2023 Hebei Provincial Social Science Fund Project: Research on Sustainable Development of Sports Venues in Higher Education Institutions in Hebei Province (HB22TY018).


