As a new form of economic and social development, the core of green economy lies in respecting and protecting the ecological environment, in order to promote the high-quality development of the economy, and to promote the development of China’s intensive economy and sustainable growth of the economy. through the construction of a modern industrial structure with high scientific and technological content, low consumption of resources, high level of innovation, and less environmental pollution, accelerate the promotion of the production mode to the greening of the environment, promote the development of economic greening, significantly reduce the ecological environment and natural resources compensation for economic development, and fundamentally alleviate the contradiction between economic development and resources and environment [1, 2, 3].
Under the impact of unilateralism, environmental crisis and resource conflicts, upgrading of industrial structure is a necessary way for China’s green development, as a key path to coordinate sustainable economic development and ecological environment protection, the structural adjustment of “supply-side” industry is not only conducive to promoting the transformation of the mode of economic development, but also actively promoting the development of “ecological civilization”, which emphasizes the importance of ecological civilization construction. The structural adjustment at the “supply side” industry level is not only conducive to promoting the transformation of economic development mode and actively advancing the “five-in-one” overall layout emphasizing the construction of ecological civilization, but also helps to solve the major structural problems hindering the economic development and promote the effective implementation of the innovation-driven economic development strategy [4, 5, 6].
The report of the 20th CPC National Congress clearly pointed out that while promoting the coordinated development of economy, the greening, low-carbon and sustainable development of economy and society are equally important, and under the requirement of high-quality development of economy, research on how to make the economy of urban agglomerations to maintain coordinated development, promote its green and low-carbon cycle, and realize sustainable development of cities is an important issue for the coordinated development of urban agglomerations economy at present. The development of city clusters requires scientific top-level design and regional planning to lead the agglomeration and allocation of production factor resources through the agglomeration effect, which is a significant feature of the coordinated development of city clusters. on the one hand, the agglomeration effect of the city cluster economy can promote the industrial upgrading and structural optimization, and thus promote the upgrading of the regional industrial structure [7, 8]. On the other hand, when promoting the economic development of urban agglomerations, the agglomeration effect will also lead to the increase of waste water and waste gas emissions, which will bring environmental problems and reduce the efficiency of regional green economy, while at the same time, through the promotion of industrial restructuring and upgrading, and the improvement of energy utilization efficiency of high-energy-consuming and high-polluting industries, the burden on the environment can be effectively reduced to realize the green, low-carbon and recycling development of the urban agglomerations [10, 11]. Through the conclusion of the existing literature, the relationship between the development of green and low carbon circulation economy, economic policy and industrial structure was found. In this paper, the paper combines the regression equation of space, not only the relationship between the three, but also provides a solid data support for the relevant literature.
The improvement of green economy development level is an important measure to optimize the coordinated development of ecological environment and economy, and also an important policy focus point to realize sustainable development. Based on the super-efficiency model (SBM), 30 provinces’ related data and spatial econometric model, literature [12] explored the relationship between the green economy efficiency of the provinces and the coupling degree of green economy efficiency and technological innovation and industrial structure upgrading. The results pointed out that The results show that the coupling degree of technological innovation and industrial upgrading has a positive and significant effect on the green economy development, and there is an obvious spatial spillover effect, which can radiate the green economy development around the region. Based on the extended LMDI model and the spatial decomposition model, literature [13] investigates the main driving factors of the difference between the provincial ECS and the national average ECS, and points out that the drivers of the difference in the ECS of the country and the region are the economic, pollution control effect, unit GDP, and the economic and environmental impacts of the ECS. pollution control effect, industrial pollution control investment per unit of GDP and economic development. Literature [14] used the spatial Durbin model and panel data of Huaihe River economic belt to conduct a study, and found that the environmental regulation shows inverted U on the economic high-quality development of the region, and at the same time, there is a spatial spillover effect of the economic high-quality development. Literature [15] based on the panel data of 12 major cities in Gansu province and the slack Measurement (SBM) on the efficiency of green economic development in Gansu, pointed out that the overall GDE in Gansu presents a situation of high east and low west, and concluded that Gansu needs to improve the use of resources and technological innovation, reduce the pollution emissions and optimize the industrial structure, and promote the sustainable development of the green economy. Previous studies have shown that green, low-carbon and circular economy has a positive and significant impact on the development of industrial structure, accompanied by space spillover effect. literature [16] based on the DID model, the relationship between low carbon pilot policy (LCC) and green total factor productivity is studied and analyzed, and it is believed that the regional governments have to manage the LCC according to the local conditions and strengthen the regulation of the environment, so as to promote the steady growth of GTPF in each region. Literature [17] describes the status quo of green development of the hydrogen economy, and explores the strategies to improve the performance of the catalysts and reduce the deactivation of the hydrogen energy, and Literature [18] combines the DURBIN model (SDM) with the Panel Threshold Model (PTM) to carry out a nonlinear analysis, and then analyze the relationship between the LCC and green TFP in a sustainable way. Literature [19] based on system dynamics, input-output modeling and dynamic multi-objective planning integrated approach to the study of green economy development form, pointed out that there is a negative trend of development, and gave a green economic development form of industrial restructuring and technological updating in the steel manufacturing city. Literature [20] used the panel vector autoregression (PVAR) model to conduct a related study to confirm the impact of green finance and renewable energy technology innovation on China’s industrial structure, and pointed out that under the condition of increasing the level of green finance, there is a nonlinear relationship between RETI and industrial structure. At the same time, the preliminary trial of economic policy has verified the adjustment of its green and low-carbon recycling and industrial structure. In this study, the above content is integrated, and the relationship between the structure of green and low-carbon cycle economy and industrial structure is studied by economic policy, and the advanced nature and feasibility of the study are highlighted.
The relationship model between green low-carbon and recycling economy, economic policy and industrial structure development is constructed, and then the model is verified through the design of empirical research by selecting relevant indexes and variables, including the comprehensive index of industrial structure development, the comprehensive index of green low-carbon and recycling economy, etc. The research methodology includes quantitative analysis, regression analysis, etc., in order to investigate the interactions and influences of the different variables, and the focus of the research is to verify the positive relationship between green low-carbon and recycling economy and industrial structure development, and the moderating effect of economic policy on this relationship. The focus of the study is to verify the positive relationship between green, low-carbon and recycling economy and the development of industrial structure, as well as the moderating effect of economic policies on this relationship. The whole research process emphasizes the collection and processing of data to ensure the reliability and validity of the research results.
Green industry is an important carrier for realizing the development of green, low-carbon and recycling economy, so in the process of growing green industry development, we should focus on examining the problems from the perspective of green economic development, and strengthen independent research and development and technological innovation. Through technological means to change the traditional crude economic growth model, reduce the industrial development process by resource constraints, improve resource utilization efficiency, and shift to the direction of cleaner production. The construction of the green industrial system is to provide assistance from the production link to realize the green low-carbon and recycling development economy, and it is also an important guarantee to support the green economy to be carried out smoothly.
Based on the above analysis, this paper puts forward the research hypothesis H1: green low-carbon recycling economy has a significant role in promoting the development of industrial structure.
The development of industrial structure is subject to both internal conditions and external policies, and there is no simple linear relationship between economic policies and enterprise industrial structure. Economic policy within a certain range will have a promotional effect on the development of industrial structure, and once the critical point is crossed, enterprises will choose a conservative strategy, and then enterprises will not pay attention to the development of industrial structure with “double externality”, and the inhibitory effect is highlighted at this time.
Based on the above analysis, this paper puts forward the hypothesis H2: the impact of economic policy on the development of enterprise industrial structure presents an inverted U-shaped relationship.
Changes in economic policy have an important impact on the development of industrial structure, and may also affect the relationship between green circular low-carbon economy and industrial structure. Based on the green low-carbon and recycling economy, the economic policy realizes the transformation of industrial structure, continuously optimizes and adjusts the internal structure of primary, secondary and tertiary industries, and then promotes the reasonable development of industrial structure.
Figure 1 shows the relationship between green low-carbon recycling economy, economic policy and industrial structure development. Based on the above analysis, this paper puts forward the hypothesis H3: there is a regulating role of economic policy between green low-carbon recycling economy and industrial structure development.

Combined with the research hypotheses in the previous section, the main selected variables as well as indicators constructed in this part of the paper are shown in Table 1. It includes four parts: explained variables, core explanatory variables, moderating variables, and control variables.
| Variable type | Variable code | Variable name |
|---|---|---|
| Explained variable | TP | Industrial structure |
| Interpretation variable | GE | Green low-carbon cycle economy |
| Regulating variable | EP | Economic policy |
| Control variable | Agdp | Economic development level |
| Gov | Government intervention | |
| Edu | Basic education level | |
| Rd | Technological innovation level |
comprehensive index of industrial structure development (TP). Table 2 shows the comprehensive index system of industrial structure development. The comprehensive index of industrial structure development includes the rationalization of industrial structure, the advanced industrial structure and the level of low-carbon and environmental protection of industrial structure.
| Target layer | Primary indicator | Secondary indicator | Index code | Index attribute |
|---|---|---|---|---|
| Industrial structure development composite index | Rationalized the industrial structure | Thiel index | Y1 | Negative |
| Advanced industrial structure | Industrial structure advanced index | Y2 | Forward | |
| Green industrial structure | Energy consumption per unit of gdp | Y3 | Negative |
Composite index of green, low-carbon and recycling economy development (GE). Table 3 shows the measurement of the level of green low-carbon and recycling economic development. The level of green low-carbon and recycling development economic system construction mainly includes four development indicators such as low-carbon economic development, green development, recycling development, economic development, and 17 sub-indicators including carbon productivity.
| Target layer | Primary indicator | Secondary indicator | Index code | Index attribute |
|---|---|---|---|---|
| The horizontal measure of the development of the low carbon cycle economy | Low-carbon development | Carbon productivity | X1 | Forward |
| Energy per capita energy carbon emissions | X2 | Negative | ||
| Per capita carbon discharge | X3 | Negative | ||
| Green development | Energy consumption | X4 | Negative | |
| Ecological environment | X5 | Forward | ||
| Ecological protection | X6 | Forward | ||
| Circular development | Carbon intensity | X7 | Negative | |
| Industrial solid waste utilization | X8 | Forward | ||
| Urban regeneration water rate | X9 | Forward | ||
| Economic development | Per capita disposable income | X10 | Forward |
Economic policy (EP). If city i is a pilot city in year t, EP = 1, otherwise, EP = 0.
In order to more comprehensively analyze the impact effect of green low-carbon and recycling economy on the high-quality development of agricultural economy, this paper also sets the following variables: (1) economic development level (Agdp), measured by the natural logarithm of the city’s per capita GDP. (2) Government intervention (Gov), measured by the share of government fiscal expenditure in GDP. (3) Basic education level (Edu), measured by taking the logarithm of the number of primary and secondary school teachers per 10,000 people in the city. (4) Level of science and technology innovation (Rd), measured by the share of science and technology expenditures in fiscal expenditures.
Let the measurement object be \(S\), if there are \(n\) measurement objects can be expressed as \(S=\left(s_{1} ,s_{2} ,\cdots ,s_{n} \right)\), the selected measurement index is \(X=\left(x_{1} ,x_{2} ,\cdots ,x_{n} \right)\), unit time \(T=\left(t_{1} ,t_{2} ,\cdots ,t_{n} \right)\). \(x_{ij} \left(t_{k} \right)\) represents the observed value of each index \(x_{j} (j=1,2,\cdots ,m)\) in the selected measurement object \(s_{i} (i=1,2,\cdots ,n)\) at time \(t_{k} (k=1,2,\cdots ,T)\), and \(x_{ijj}\) for standardization and dimensionless processing, the result of the processing is \(y_{ijt}\), to ensure that the data can be compared and observable.
In view of the different amount of information covered by each indicator, the entropy value method was first used to correlate the initial data, and the static composite measurement value \(y_{ij} \left(t_{k} \right)\) of each measurement object at different time points \(t_{k}\) could be obtained, so the static measurement matrix of all measurement objects could be known; \[\label{GrindEQ__1_}\tag{1} Y = \left[\begin{array}{cccc} y_{1}(t_1) & y_{2}(t_2) & {\cdots } & y_{T}(t_T) \\ y_{2}(t_1) & y_{2}(t_2)&{\cdots } & y_{2}(t_T) \\ {\vdots }& {\vdots }& {\cdots }& {\vdots }\\ y_{n}(t_1)& y_{n}(t_2) & {\cdots } & y_{n}(t_T) \end{array}\right].\]
In order to further measure the overall measurement results of all indicators during the study period, this paper will obtain their dynamic composite measurements through the following four steps:
(1) Measurement of superiority and inferiority gain level. Setting \(\theta ^{+}\) and \(\theta ^{-}\) as the level of the gain and loss of the measurement object, the calculation formula is as follows: \[\label{GrindEQ__2_}\tag{2} \left\{\begin{array}{l} {\theta ^{+} =\bar{\theta }+\left(\theta ^{\max } -\bar{\theta }\right)k^{+} } \\ {\theta ^{-} =\bar{\theta }+\left(\bar{\theta }-\theta ^{\min } \right)k^{-} } \end{array}\right.\] where \(k^{+}\), \(k^{-} \in (0,1]\) indicates the corresponding coefficient of variation of the indicator, which usually depends on the decision maker’s mental decision on the overall development trend of the measured object. In this paper, we will draw on the floating coefficient, i.e. \(k^{+} =k^{-} =0.5\).
(2) Measurement of superior and inferior incentive values. Set \(y_{i}^{+} \left(t_{k} \right)\), \(y_{i}^{-} \left(t_{k} \right)\) for the measurement of the object of superiority and inferiority incentive value, the formula is: \[\label{GrindEQ__3_}\tag{3} \left\{\begin{array}{l} {y_{i}^{+} \left(t_{k} \right)=\eta ^{+} +y_{i} \left(t_{k-1} \right)} \\ {y_{i}^{-} \left(t_{k} \right)=y_{i} \left(t_{k-1} \right)+\eta ^{-} } \end{array}(k=2,3,\cdots ,T)\right.\]
(3) Establish an incentive control model. Let \(v_{i}^{+} \left(t_{k} \right)\) and \(v_{i}^{-} \left(t_{k} \right)\) be the superior and inferior incentives acquired by the measurement object \(s_{i}\) at time \(t_{k}\), and use the incentive control model to develop incentives for the measurement object gain level: \[\label{GrindEQ__4_}\tag{4} \begin{array}{l} {v_{i}^{+} \left(t_{k} \right)=\left\{\begin{array}{ll} {y_{i}^{+} \left(t_{k} \right)-y_{i} \left(t_{k} \right),} & {y_{i}^{+} \succ y_{i} \left(t_{k} \right)} \\ {0,} & {Other} \end{array}\right. } \\ {v_{i}^{-} \left(t_{k} \right)=\left\{\begin{array}{ll} {y_{i} \left(t_{k} \right)-y_{1}^{-} \left(t_{k} \right),} & {y_{i} \left(t_{k} \right)\succ y_{1}^{-} \left(t_{k} \right)} \\ {0,} & {Other} \end{array}\right. } \end{array}\]
In this article, \(v_{i}^{+} \left(t_{k} \right)\)\(=\)\(y_{i}^{+} \left(t_{k} \right)-y_{i} \left(t_{k} \right)\),\(v_{i}^{-} \left(t_{k} \right)\)\(=\)\(y_{i} \left(t_{k} \right)-y_{1}^{-} \left(t_{k} \right)\).
(4) Calculate the dynamic composite measure value. Based on the above incentive control model, let \(z_{i} \left(t_{k} \right)\) be the dynamic measurement value of the measurement object \(s_{i}\) at time \(t_{k}\). Among them, when calculating the dynamic measurement value, we should fully consider the value of deviation from the superior and stated incentive part and give rewards and penalties: \[\label{GrindEQ__5_}\tag{5} z_{i} \left(t_{k} \right)=h^{+} v_{i}^{+} \left(t_{k} \right)+y_{i} \left(t_{k} \right)-h^{-} v_{i}^{-} \left(t_{k} \right),\] where \(h^{+}\) and \(h^{-}\) denote the superior and inferior incentive factors \(\left(h^{+} ,h^{-} \succ 0\right)\), respectively, and \(h^{+} v_{i}^{+} \left(t_{k} \right)\) and \(h^{-} v_{i}^{-} \left(t_{k} \right)\) refer to the superior and inferior incentive penalty components. If \(v_{i}^{+} \left(t_{k} \right)v_{i}^{-} \left(t_{k} \right)=0\), then \(h^{+} v_{i}^{+} \left(t_{k} \right)\) and \(h^{-} v_{i}^{-} \left(t_{k} \right)\) cannot be taken at the same time. Further the values of \(z_{i} \left(t_{k} \right)\) during the whole examination period are integrated, and finally the dynamic composite measure of the measurement object is obtained \(z_{i}\). The calculation formula is: \[\label{GrindEQ__6_}\tag{6} z_{i} =\sum\limits_{k=1}^{T}\tau _{k} z_{i} \left(t_{k} \right),\] where \(\tau _{k}\) denotes a variable sequence or a constant. The dual incentive model can effectively calculate the information entropy value of each indicator, so as to determine the corresponding weights of each indicator, and understand the influence of each indicator on the construction of green low-carbon and recycling development economic system among regions. However, this method is more subjective and has big defects, so it needs to be optimized and improved by the regional difference analysis method.
In this paper, we will analyze the differences in the construction level of the green low-carbon and recycling development economic system among regions with the help of the Thiel index, Gini coefficient and the \(\sigma\)-convergence model, and divide the provinces into four regions, namely, East, Central, West and Northeast, according to the criteria of the National Bureau of Statistics. The above method is able to judge the dynamic trend of variability among regions to a large extent.
The Gini coefficient applied to the construction level of green, low-carbon and recycling development economic system is calculated by the formula: \[\label{GrindEQ__7_}\tag{7} \begin{array}{l} {G=\frac{1}{2n^{2} Z} \sum\limits_{i=1}^{n}\sum\limits_{j=1}^{n}\left|Z_{i} -Z_{j} \right| } \\ {G_{r} =\frac{1}{2n_{r}^{2} \bar{Z}_{r} } \sum\limits_{i=1}^{n_{r} }\sum\limits _{j=1}^{n_{r} }\left|Z_{ri} -Z_{rj} \right| } \end{array}\] where \(G\) is the Gini coefficient of the inter-provincial green low-carbon and recycling development economic system construction level, \(G_{r}\) is the Gini coefficient among different provinces in region \(r\). \(Z_{i}\) is the level of the \(i\)th province’s green low-carbon and recycling development economic system construction level, and \(\bar{Z}_{r}\) is the average value of the level of each province’s green low-carbon and recycling development economic system construction in region \(r\). Where \(n_{r}\) denotes the number of different provinces in region \(r\) and \(n\) denotes the number of all provinces. This paper selects 31 provinces in China to experiment, so n= 31.
The Thiel index can divide the overall differences into intra-group and inter-group differences, and takes values between 0 and 1. The larger the value taken, the greater the within-group and between-group differences are indicated. The formula is expressed as: \[\label{GrindEQ__8_}\tag{8} \begin{array}{rcl} {T} & {=} & {T_{a} +T_{b} =\sum\limits_{r=1}^{4}\left(\frac{n_{r} }{n} \times \frac{Z_{r} }{Z} \times T_{r} \right) +\sum\limits _{r=1}^{4}\left(\frac{n_{r} }{n} \times \frac{Z_{r} }{Z} \times \ln \frac{Z_{r} }{Z} \right) } \\ {} \end{array}\] where \(T\) represents the Thiel index, \(T_{a}\) and \(T_{b}\) represent intra- and inter-regional differences, respectively, and \(T_{r}\) represents a measure of the level of construction of the green low-carbon and recycling development economic system in different provinces in region \(r\).0\(\mathrm{<}\)T\(\mathrm{<}\)1.
\(\sigma\) The convergence model is a measure of the degree of dispersion of the construction level of the green low-carbon and recycling development economic system in each province within a specific range, defined as: \[\label{GrindEQ__9_}\tag{9} \sigma =\sqrt{\frac{1}{n} \sum\limits_{i=1}^{n}\left(\ln Z_{i} -\frac{1}{n} \sum\limits_{i=1}^{n}\ln Z_{i} \right)^{2} }.\]
If \(\sigma\) becomes smaller over time, it means that the level of construction of green low-carbon and recycling development economic system in each province is gradually converging and the inter-provincial differences are gradually narrowing. the opposite means that the inter-provincial differences are widening.0\(\mathrm{<}\)\(\sigma\)\(\mathrm{<}\)1.
(1) Rationalization of industrial structure
Rationalization of industrial structure is a criterion for judging whether factors such as labor force are reasonably and efficiently allocated among industries, and it is also an important reflection of the degree of industrial coordination. When studying the rationalization of industrial structure, the deviation structure method is usually used for analysis, but this method ignores the structural effect, therefore, the practice of measuring the rationalization of industrial structure with the Tel index is calculated as follows: \[\label{GrindEQ__10_}\tag{10} TL=\sum\limits_{i=1}^{n}\left({Y_{i} \mathord{\left/ {\vphantom {Y_{i} Y}} \right. } Y} \right) \ln \left({\frac{Y_{i} }{Y} \mathord{\left/ {\vphantom {\frac{Y_{i} }{Y} \frac{L_{i} }{L} }} \right. } \frac{L_{i} }{L} } \right).\]
In Eq. 10, \(i\), \(Yi\), \(\frac{Y_{i} }{Y}\) and \(\frac{L_{i} }{L}\) represent the proportion of output value of \(i\) industries, \(i\) industries, the proportion of output value of \(i\) industries in GDP, and the proportion of employment in \(i\) industries in total employment, respectively. The industry is mainly divided into the first production, the second production and the third industry, so i= 3. Among them, when the economy is in equilibrium conditions, \(TL=0\), TL tends to zero value indicates that the industrial structure is more reasonable.
(2) Advanced level of industrial structure
Driven by informationization, the service-oriented economic structure has become an important feature of industrial structure upgrading. In view of this, in order to better portray the degree of industrial structure upgrading, the proportion of output value of the tertiary industry to the output value of the secondary industry is used as an index to measure the advanced industrial structure, and its calculation expression is as follows: \[\label{GrindEQ__11_}\tag{11} TF=\frac{GDP_{3} }{GDP_{2} }.\]
In Eq. 11, \(GDP_{3}\) is the output value of tertiary industry and \(GDP_{2}\) is the output value of secondary industry. The larger the value of \(TF\), the higher the degree of advanced industrial structure is, on the contrary, the lower it is.
(3) The level of carbon and environmental protection of industrial structure
Low-carbon environmental protection is the new era of economic development and the inevitable requirements of ecological civilization construction, industrial structure low-carbon environmental protection is the industrial production of energy consumption towards the direction of carbon emissions is less, therefore, in order to better balance the three industrial structure of low-carbon environmental protection level of development, in the study of China’s industrial transformation of low-carbon environmental protection constructed in the indicators, the specific definitions are as follows: \[\label{GrindEQ__12_}\tag{12} TC=\sum\limits_{i}^{n}\left({E_{i} \mathord{\left/ {\vphantom {E_{i} Y_{i} }} \right. } Y_{i} } \right).\]
In Eq. 12, \(i\), \(Y_{i}\) and \(E_{i}\) represent the carbon emissions of industry \(i\), industry \(i\) and industry \(i\). If the TC value is larger, the lower the level of low-carbon environmentalization of the industry, and vice versa, the higher it is.
(1) Spatial econometric model
In the spatial econometric modeling setup, an ordinary panel model with general meaning is first constructed as shown in Eq. 13: \[\label{GrindEQ__13_}\tag{13} TF_{it} =a_{0} +a_{1} GF_{it} +\beta X_{it} +\varepsilon _{it},\] where \(TF\) represents the industrial structure composite index, which exists as the dependent variable, \(GF\) represents the green low-carbon and recycling economy composite index, which exists as the independent variable, \(i\) represents different provinces, \(X\) represents other control variables, and \(\varepsilon\) represents the random error term.0\(\mathrm{<}\)TF\(\mathrm{<}\)1, 0\(\mathrm{<}\)GF\(\mathrm{<}\)1, i=31, X=4.
The model considers the interaction effect between the error terms and cannot examine the spatial spillover effect between regions. Compared with the above two models, the spatial Durbin (SDM) model controls both endogenous and exogenous interaction effects, which not only effectively solves the problem of important omitted variables, but also solves the problem of possible endogeneity between the error terms and the independent variables.
The specific settings of the three models are shown below;
Spatial Autoregressive Model (SAR): \[\label{GrindEQ__14_}\tag{14} TF_{it} =a_{0} +\beta \sum\limits_{j=1}^{n}w_{ij} TF_{jt} +\gamma \sum\limits_{j=1}^{n}w_{ij} GF_{jt} +\varepsilon _{it}.\]
Spatial error chess type (SEM): \[\label{GrindEQ__15_}\tag{15} \begin{array}{rcl} {TF_{it} } & {=} & {a_{0} +\beta GF_{it} +\gamma X_{it} +\delta _{it} } {} \end{array}.\]
Spatial Durbin Model (SDM): \[\label{GrindEQ__16_}\tag{16} TF_{it} =a_{0} +\beta \sum\limits_{j=l}^{n}w_{ij} TF_{jt} +\gamma \sum\limits_{j=l}^{n}w_{ij} GF_{jt} +\delta \sum\limits_{j=l}^{n}w_{ij} X_{jt} +\varepsilon _{it}.\]
(2) Spatial weights
Constructing spatial weight matrix is a prerequisite for spatial effect test, and this paper constructs spatial weight matrix from two levels of spatial geographic features and socio-economic features. Firstly, taking whether the cities are bordering each other as the benchmark, the spatial proximity matrix \(\left(W_{1} \right)\) is constructed, i.e., 1 is taken when the city \(i\) is adjacent to the city \(j\), and 0 is taken when the opposite is true. Secondly, on the basis of the inverse distance weight matrix \(\left(W_{0} \right)\), the economic elements are further considered, so that the economic geography weight matrix \(\left(W_{2} \right)\) is constructed as shown in the formula 17\(\mathrm{\sim}\)19, where \(y\) is the per capita GNP. That is: \[\label{GrindEQ__17_}\tag{17} \begin{array}{c} {W_{0} =\left\{\begin{array}{cc} {0} & {i=j} \\ {\frac{1}{d_{ij}^{2} } } & {i\ne j} \end{array}\right. } \end{array}.\] \[\label{GrindEQ__18_}\tag{18} w_{2} =w_{0} \times diag\left(\frac{\bar{y}_{1} }{y} ,\frac{\bar{y}_{2} }{y} ,\cdots ,\frac{\bar{y}_{n} }{y} \right).\] \[\label{GrindEQ__19_}\tag{19} \bar{y}=\frac{1}{n\left(t_{1} -t_{0} +1\right)} \sum\limits_{i=1}^{n}\sum\limits_{h_{i} }^{t_{1} }y_{it} ,\bar{y}_{i} =\frac{1}{t_{1} -t_{0} +t} \sum\limits_{h_{i} }^{t_{1} }y_{it}.\]
(3) Spatial autocorrelation test
Moran’s index is a common method used to measure spatial autocorrelation, including global Moran’s index and local Moran’s index, global Moran’s index is a measure of spatial aggregation of the whole series, and local Moran’s index is a measure of spatial aggregation in the vicinity of a certain region. In this paper, we use the global Moran’s index to examine spatial autocorrelation, and the calculation formula is: \[\label{GrindEQ__20_}\tag{20} I=\frac{\sum\limits_{i=1}^{n}\sum\limits_{j=1}^{n}W_{\overline{ij}} \left(X_{i} -\bar{X}\right)\left(X_{j} -\bar{X}\right)}{S^{2} \sum\limits_{i=1}^{n}\sum\limits_{j=1}^{n}W_{\bar{j}} },\] where, \(X_{i}\) and \(X_{j}\) are the sample values of the variables for provinces \(i\) and \(j\), \(X\) is the mean value, and \(W_{ij}\) is the spatial weight matrix.
The values of the three-level indicators used for the evaluation of the economic development of green, low-carbon and recycling development at the provincial level are mainly taken from the websites of authoritative organizations such as the National Bureau of Statistics, the Ministry of Science and Technology, the People’s Bank of China and various authoritative statistical yearbooks. Including national, provincial and municipal statistical yearbooks, environmental situation bulletins and some specialized statistical yearbooks, as well as eps database, wind, industrial structure data from the China Statistical Yearbook. The years selected for taking values are from 2013 to 2022, and 31 provinces are used as an example for measurement.
The processed data are combined with the indicators and models for measuring the level of green low-carbon and recycling economic development to explore the changing trend of the level of green low-carbon and recycling economic development in the country. Table 4 shows the economic development index of green low-carbon and recycling development of each province in China.
Since 2013, the level of national green low-carbon and recycling economy has been steadily improved. the comprehensive index of the level of national green low-carbon and recycling development economic system construction in 2022 has been improved by 178.8% from the level of 2013. The 18th Party Congress has attached great importance to the construction of ecological civilization, and under the guidance of Xi Jinping Thought on Socialism with Chinese Characteristics for a New Era, the whole country has actively integrated the construction of ecological civilization into the construction of economy, politics, society and culture. Obviously, such a national mobilization has provided a strong political impetus for the continuous improvement of the level of construction of China’s green, low-carbon and recycling development economic system. However, it is worth noting that, although the overall level of construction of the nation’s green, low-carbon and recycling development economic system has been improving, the rate of improvement has not been fast enough, and has been significantly lower than the growth rate of the total economy. As a whole, the level of the national green low-carbon and recycling economy in 2013 was only 0.184, and although it has reached 0.605 in 2022, the overall development is still slow, and the development of the green low-carbon and recycling economy has started slowly, and there is a big gap compared with developed countries. In addition, the development speed of the low-carbon and recycling economy in the eastern region is much higher than that in the central and western regions, indicating that there is still much to be strengthened in the development of green finance in the future.
| 2013 | 2014 | 2015 | 2016 | 2017 | 2018 | 2019 | 2020 | 2021 | 2022 | |
|---|---|---|---|---|---|---|---|---|---|---|
| Beijing | 0.558 | 0.611 | 0.645 | 0.692 | 0.702 | 0.777 | 0.792 | 0.821 | 0.823 | 0.855 |
| Tianjin | 0.289 | 0.302 | 0.389 | 0.406 | 0.458 | 0.551 | 0.523 | 0.605 | 0.622 | 0.702 |
| Hebei | 0.242 | 0.299 | 0.339 | 0.383 | 0.447 | 0.498 | 0.496 | 0.584 | 0.645 | 0.752 |
| Liaoning | 0.241 | 0.296 | 0.337 | 0.35 | 0.438 | 0.463 | 0.494 | 0.583 | 0.629 | 0.747 |
| Shanghai | 0.235 | 0.292 | 0.319 | 0.347 | 0.436 | 0.463 | 0.493 | 0.576 | 0.629 | 0.747 |
| Zhejiang | 0.232 | 0.288 | 0.318 | 0.345 | 0.435 | 0.46 | 0.486 | 0.568 | 0.623 | 0.719 |
| Jiangsu | 0.231 | 0.285 | 0.31 | 0.336 | 0.428 | 0.442 | 0.454 | 0.547 | 0.618 | 0.709 |
| Fujian | 0.221 | 0.277 | 0.307 | 0.334 | 0.427 | 0.435 | 0.449 | 0.545 | 0.605 | 0.698 |
| Shandong | 0.217 | 0.277 | 0.306 | 0.313 | 0.415 | 0.434 | 0.44 | 0.542 | 0.594 | 0.677 |
| Guangdong | 0.214 | 0.276 | 0.305 | 0.292 | 0.408 | 0.43 | 0.43 | 0.539 | 0.576 | 0.671 |
| Hainan | 0.212 | 0.275 | 0.303 | 0.289 | 0.393 | 0.406 | 0.419 | 0.521 | 0.566 | 0.666 |
| Shanxi | 0.211 | 0.272 | 0.297 | 0.285 | 0.383 | 0.405 | 0.416 | 0.506 | 0.565 | 0.653 |
| Jilin | 0.211 | 0.269 | 0.297 | 0.281 | 0.382 | 0.396 | 0.416 | 0.502 | 0.552 | 0.636 |
| Heilongjiang | 0.211 | 0.266 | 0.293 | 0.279 | 0.378 | 0.393 | 0.39 | 0.494 | 0.55 | 0.623 |
| Anhui | 0.209 | 0.264 | 0.287 | 0.27 | 0.377 | 0.393 | 0.389 | 0.473 | 0.549 | 0.606 |
| Jiangxi | 0.209 | 0.261 | 0.276 | 0.266 | 0.359 | 0.392 | 0.387 | 0.459 | 0.54 | 0.601 |
| Henan | 0.209 | 0.255 | 0.272 | 0.266 | 0.35 | 0.391 | 0.385 | 0.443 | 0.524 | 0.599 |
| Hupei | 0.205 | 0.253 | 0.251 | 0.265 | 0.345 | 0.384 | 0.379 | 0.437 | 0.518 | 0.597 |
| Hunan | 0.197 | 0.249 | 0.246 | 0.263 | 0.344 | 0.38 | 0.378 | 0.433 | 0.508 | 0.59 |
| Inner Mongolia | 0.195 | 0.246 | 0.24 | 0.258 | 0.34 | 0.356 | 0.375 | 0.425 | 0.489 | 0.571 |
| Guangxi | 0.193 | 0.245 | 0.236 | 0.252 | 0.327 | 0.352 | 0.372 | 0.425 | 0.486 | 0.564 |
| Chongqing | 0.192 | 0.244 | 0.235 | 0.247 | 0.326 | 0.349 | 0.372 | 0.421 | 0.48 | 0.546 |
| Sichuan | 0.19 | 0.243 | 0.227 | 0.247 | 0.322 | 0.326 | 0.36 | 0.407 | 0.476 | 0.534 |
| Guizhou | 0.189 | 0.24 | 0.22 | 0.24 | 0.32 | 0.32 | 0.344 | 0.406 | 0.467 | 0.532 |
| Yunnan | 0.184 | 0.238 | 0.22 | 0.238 | 0.319 | 0.32 | 0.333 | 0.395 | 0.457 | 0.487 |
| Shaanxi | 0.182 | 0.237 | 0.22 | 0.233 | 0.308 | 0.314 | 0.326 | 0.375 | 0.437 | 0.485 |
| Gansu | 0.182 | 0.235 | 0.217 | 0.223 | 0.304 | 0.307 | 0.32 | 0.37 | 0.434 | 0.449 |
| Qinghai | 0.174 | 0.231 | 0.214 | 0.222 | 0.3 | 0.286 | 0.319 | 0.366 | 0.431 | 0.447 |
| Ningxia | 0.172 | 0.23 | 0.211 | 0.213 | 0.284 | 0.272 | 0.317 | 0.357 | 0.416 | 0.436 |
| Xinjiang | 0.163 | 0.221 | 0.211 | 0.209 | 0.271 | 0.265 | 0.315 | 0.355 | 0.403 | 0.434 |
| Tibet | 0.163 | 0.223 | 0.206 | 0.204 | 0.259 | 0.262 | 0.315 | 0.328 | 0.363 | 0.426 |
| Mean | 0.217 | 0.271 | 0.282 | 0.292 | 0.374 | 0.394 | 0.409 | 0.478 | 0.535 | 0.605 |
Calculating the Gini coefficient, Tel index and \(\sigma\) value of regional differences in the level of China’s green low-carbon and recycling development economic system construction, Table 5 shows the evolution results of regional differences in China’s low-carbon and recycling economic level.
On a national scale, the Gini coefficient, Tel index and \(\sigma\) value of green low-carbon and recycling development economy level basically do not exceed 0.2, which means that the level of green low-carbon and recycling development economy in each region is relatively balanced in general. However, the gap between the highest level and the lowest level of green low-carbon recycling development economy is still large.
Meanwhile, the above Gini coefficient, Tel index and \(\sigma\) value have increased throughout the study period, which means that the regional differences in the level of green low-carbon recycling development economy have widened in general, and there is no convergence trend. However, the upper Tel index and \(\sigma\) value remained stable or slightly decreased from 2014 to 2016, indicating that the regional differences in the level of green low-carbon and recycling development economic system construction remained stable or showed a trend of convergence in stages during this period.
Among the four major regions, the Gini coefficient, Terrell index and \(\sigma\) value of the green low-carbon and recycling development economic level in the eastern, central and northeastern regions also increased throughout the study period, indicating that the inter-provincial differences in the level of green low-carbon and recycling development economic system construction among the three major regions have also expanded.
Comparatively speaking, the Gini coefficient, Tel index and \(\sigma\) value of green low-carbon and recycling development economic level in the eastern region are significantly larger than those in the other three regions, which indicates that the inter-provincial differences in the construction level of green low-carbon and recycling development economic system in the eastern region are even greater. Among the four regions, the Gini coefficient, Tel index and \(\sigma\) value of the green low-carbon recycling economic level in the Northeast region are always the smallest, and the special Tel index is no more than 0.01, which shows that the variability of the level of green low-carbon economy within the Northeast region is the smallest.
| Metric | Area | 2014 | 2016 | 2018 | 2020 | 2022 |
|---|---|---|---|---|---|---|
| Gink coefficient | Nationwide | 0.092 | 0.097 | 0.106 | 0.115 | 0.122 |
| East | 0.155 | 0.161 | 0.163 | 0.164 | 0.165 | |
| Middle | 0.048 | 0.054 | 0.056 | 0.065 | 0.067 | |
| West | 0.015 | 0.024 | 0.033 | 0.046 | 0.057 | |
| Northeast | 0.008 | 0.022 | 0.032 | 0.037 | 0.043 | |
| Thiel index | Nationwide | 0.028 | 0.035 | 0.038 | 0.05 | 0.054 |
| East | 0.045 | 0.038 | 0.063 | 0.07 | 0.079 | |
| Middle | 0.003 | 0.009 | 0.015 | 0.02 | 0.028 | |
| West | 0.010 | 0.012 | 0.024 | 0.026 | 0.031 | |
| Northeast | 0.002 | 0.003 | 0.006 | 0.007 | 0.009 | |
| \(\sigma\) value | Nationwide | 0.198 | 0.197 | 0.212 | 0.216 | 0.227 |
| East | 0.278 | 0.288 | 0.295 | 0.302 | 0.311 | |
| Middle | 0.088 | 0.095 | 0.107 | 0.117 | 0.122 | |
| West | 0.135 | 0.148 | 0.153 | 0.161 | 0.162 | |
| Northeast | 0.028 | 0.040 | 0.041 | 0.041 | 0.046 |
The performance of the model is analyzed after measuring the level of green and low carbon circulation. The comparison results show that the accuracy of the green and low carbon circulation economy is 0.982. the error is only 0.018, and the method of measuring it is 0.884, and the measurement error is 0.116. the calculation model of the build is good for the measurement of the level of green and low carbon circulation.
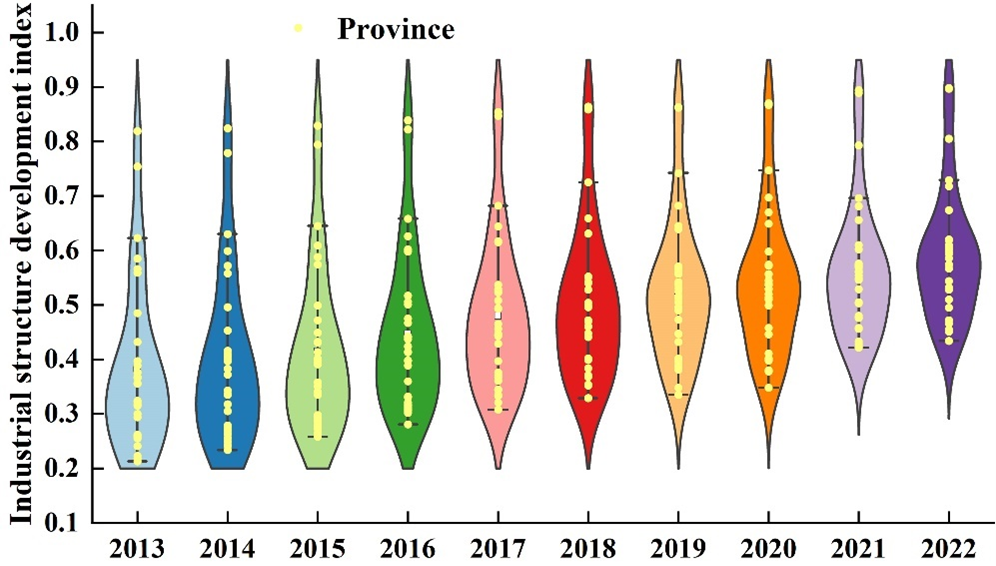
According to the weights of industrial structure indexes measured by the entropy weight method, the proportion of industrial structure rationalization reaches 60.28%, the proportion of industrial structure advancedization, reaches 27.65%, and the proportion of industrial structure greening is relatively low, only 12.07%. The index of China’s industrial structure development from 2013-2022 is further calculated, and Figure 2 shows the measurement of the level of industrial structure development of Chinese provinces.
From the figure, it can be seen that China’s industrial structure development index shows a sharp peak and trailing tail distribution, with most provinces having comparable levels of industrial structure development and individual provinces having better development. According to the violin-in-box line diagram, it can be seen that from 2013 to 2022 China’s industrial structure development index as a whole shows an upward trend at the same time, the growth rate from 2017 onwards also increases year by year, and the number of cities with a higher level of China’s industrial structure development index is gradually increasing, and its average development index is from 0.383 in 2013 to 0.589 in 2022, and Beijing’s industrial structure development index is always greater than 0.800.
The comprehensive evaluation index of industrial structure upgrading of each city shows a continuous increase from 2005 to 2020, indicating that the level of industrial structure transformation and upgrading of each province has been greatly improved in recent years. Some provinces have the situation of decreasing and then increasing, such as some cities in the central and western parts of the country, indicating that the transformation and upgrading of the industrial structure of the province is in a backward stage, and at the same time, it can be seen that the level of upgrading of the industrial structure in the eastern region is higher than that in the central and western regions. Although overall industrial structure transformation and upgrading is in the stage of steady progress and has been carried out steadily and achieved certain results among regions, the degree of industrial structure upgrading varies from region to region, indicating that regional industrial structure upgrading still needs to be paid more attention to.
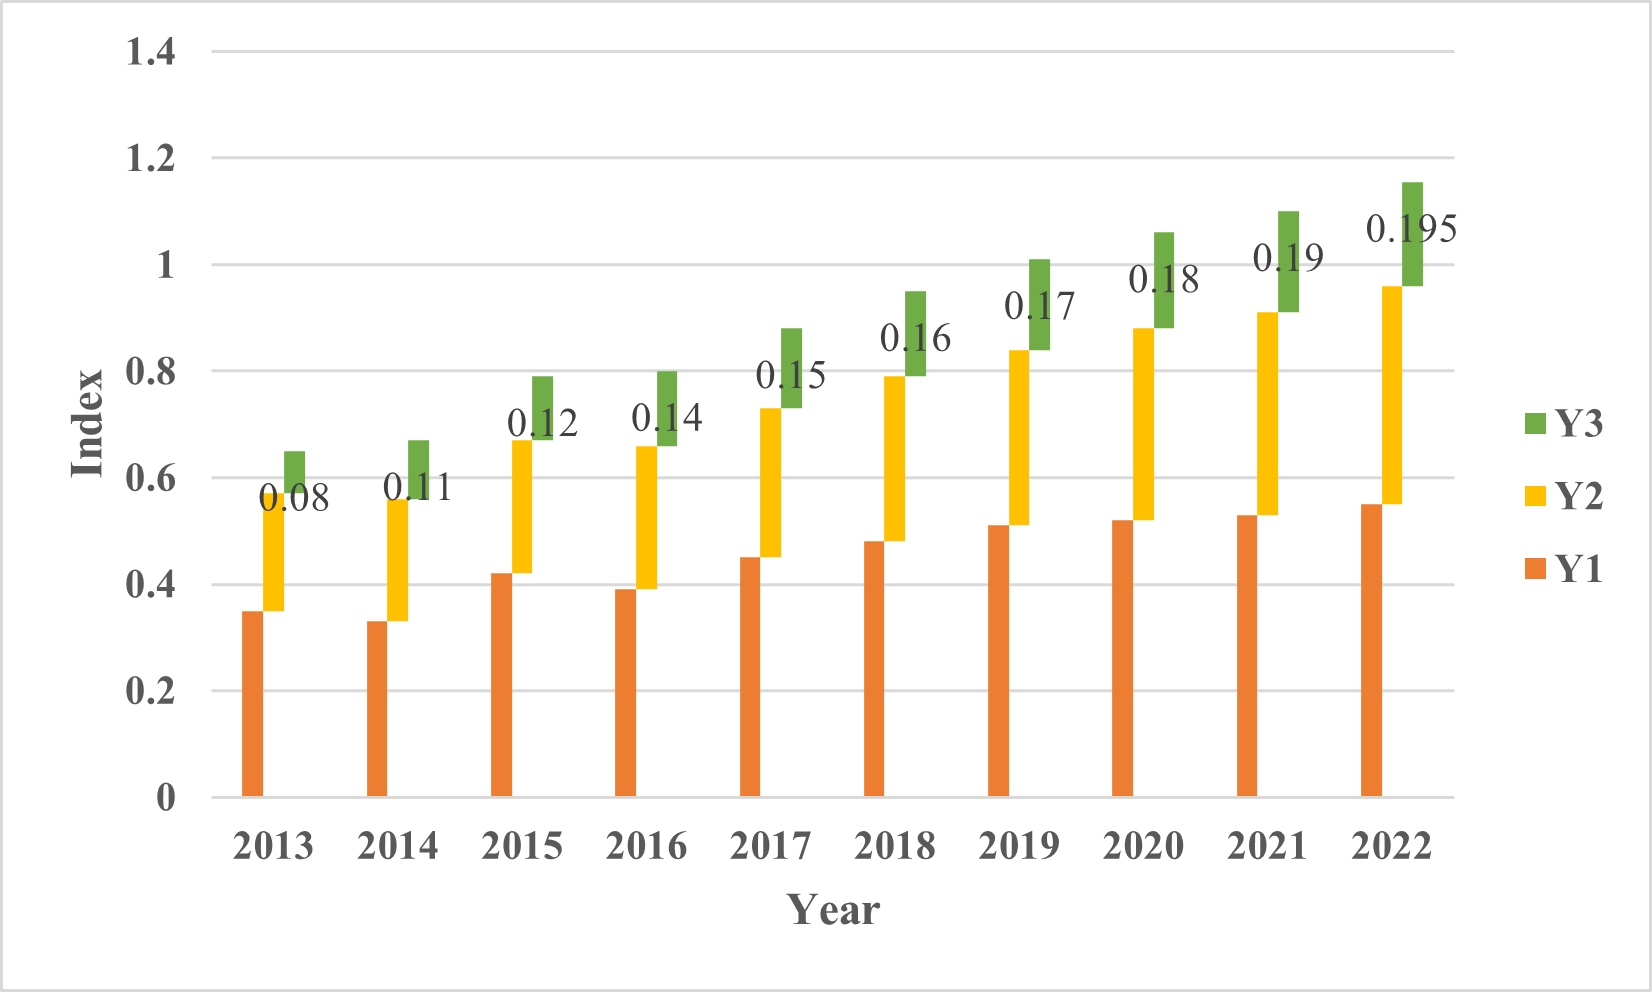
Further, the development level of China’s industrial structure from 2013 to 2020 is explored in terms of the rationalization of industrial structure, the advanced industrial structure, and the level of low-carbon and environmental protection of industrial structure. Figure 3 shows the specific development index of industrial structure of each province in China.
It can be found that the industrial structure also shows an overall growth trend, and with the change of economic development mode, all regions have successively increased the industrial structure upgrading and accelerated the speed of industrial transformation, but because the industrial structure upgrading is a long-term process, the industrial structure upgrading index grows at an overall slower rate and at a lower level. At the same time, the composite indexes of industrial structure rationalization and advancedization in all regions are all greater than 0.2, which are at a high level. As industrial specialization will weaken with the advancement of industrial structure transformation and upgrading, and industrial transformation and upgrading will inevitably develop other industries or introduce new industries, thus, it will, to a certain extent, cause the decline of industrial rationalization. In addition, none of the composite indices of low-carbon environmentalization of industrial structure exceeds 0.195, indicating that the process develops slowly and starts late.
In conclusion, it is believed that the levels of rationalization of industrial structure, advanced industrial structure and low carbon and environmental protection of industrial structure have increased in China in recent years, but the increase in some regions is not large, and there are still certain problems in China’s industrial structure, so it is reasonable to believe that China’s efforts to promote the transformation and upgrading of industrial structure at the regional level need to be further strengthened.
After measuring the development level of industrial structure, the performance of the measurement model is analyzed and compared with the traditional measurement method. The comparison results show that the accuracy of the industrial structure level of 31 province is 0.975per cent, and the error is only 0.025m, and the accuracy of the measurement is 0.856. the measurement error is 0.144. the measuring accuracy is increased by 13.9%, and the calculation model of the construction is very good for the development level of the industrial structure.
Following the spatial measurement steps, this paper tests whether there is a spatial correlation between green low-carbon recycling economy and industrial structure through Moran’ I index, and Table 6 shows the Moran’ I index under the nested matrix of economic geography. From the results of Moran’ I index, the Moran’ I indices of green low-carbon recycling economy and industrial structure from 2011 to 2020 are all positive and all significant (P\(\mathrm{<}\)0.05), indicating that there is a significant positive spatial correlation between green low-carbon recycling economy and industrial structure.
| Year | Green low-carbon cycle economy | Z Value | Industrial structure | Z Value |
|---|---|---|---|---|
| 2013 | 0.156** | 1.642 | 0.473*** | 3.931 |
| 2014 | 0.177** | 1.535 | 0.429*** | 3.892 |
| 2015 | 0.131** | 1.612 | 0.401*** | 4.851 |
| 2016 | 0.188** | 1.845 | 0.406*** | 3.697 |
| 2017 | 0.135** | 2.485 | 0.455*** | 4.566 |
| 2018 | 0.258*** | 1.866 | 0.389*** | 4.219 |
| 2019 | 0.222*** | 2.268 | 0.476*** | 3.663 |
| 2020 | 0.175** | 1.803 | 0.403*** | 4.461 |
| 2021 | 0.162** | 1.731 | 0.381*** | 4.678 |
| 2022 | 0.183** | 2.082 | 0.513*** | 4.381 |
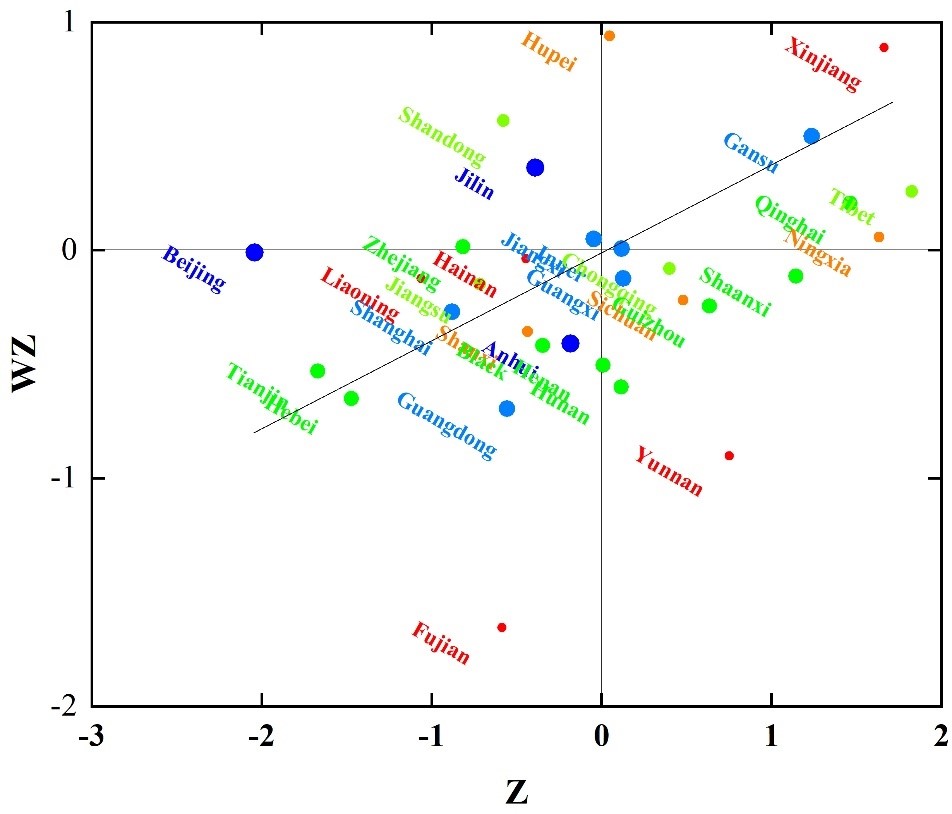
Next, the Moran’ I scatterplot of the green low-carbon recycling economy and industrial structure in 2022 is plotted. Figure 4 shows the Moran’ I scatter distribution in 2022, and (a) and (b) show the Moran’ I scatter distributions of the green low-carbon recycling economy and industrial structure in 2022, respectively. From the Moran’ I scatter plot, most provinces are located in quadrants 1 and 3, reflecting that the green low-carbon recycling economy and industrial structure are spatially characterized by the concentration of high-level regions and the aggregation of low-level regions. The Moran’ I index and its test results and the Moran’ I scatter plot indicate that there is a significant spatial dependence between the green low-carbon recycling economy and the industrial structure, based on which, this paper will continue to empirical research by constructing a spatial econometric model.

In this section, the data collected and the model developed will be used to empirically test the moderating roles of managerial competence and firms’ green innovation, economic policy uncertainty and firms’ green innovation, and economic policy uncertainty, respectively.
Exploring the impact of green economy and economic policies on industrial structure, Table 7 shows the regression results of green low-carbon recycling economy on industrial structure. Table 1 reports the impact of green low-carbon recycling economy on industrial structure. According to the results of Model 1, the estimated coefficient of regression of green low-carbon recycling economy (GE) on industrial structure development (TP) is 0.008, which is significant at 1% level, and the hypothesis H1 is supported by the empirical results of this paper, that is, the green low-carbon recycling economy will promote the development of industrial structure to a certain extent.
Meanwhile, in terms of control variables, the economic development level (Agdp), government intervention (Gov), basic education level (Edu), science and technology innovation level (Rd), the level of industrial structure measured by using the proportion of science and technology expenditures to fiscal expenditures shows a significant negative correlation, which is in line with the findings of previous studies. Tables 7, 2 and 3 report the effects of economic policies on the development of industrial structure. Table 7 (2) based on model 2 regression, the estimated coefficient of the regression of economic policy (EP) on the level of industrial structure development (TP) is found to be 0.007, which is significant at the 10% level, indicating that economic policy contributes to the level of industrial structure development. According to the regression of model 3, the regression estimation coefficient of economic policy (EP) on the development level of industrial structure (TP) is the regression estimation coefficient of 0.052, and the regression estimation coefficient of economic policy squared term (EP2) on the industrial structure (TP) is -0.088, both of which are significant at the level of 1%, and the results show that economic policy and industrial structure present an inverted U-shaped relationship, and the hypothesis H2 is supported by the empirical evidence of this paper supported by the results.
| (1)TP | (2)TP | (3)TP | |
|---|---|---|---|
| GE | 0.008***(-8.88) | ||
| EP | 0.007*(1.88) | 0.052***(4.88) | |
| EP2 | -0.088***(-4.88) | ||
| Agdp | 0.011***(2.98) | 0.008***(2.28) | 0.009***(2.29) |
| Gov | 0.014***(-3.88) | 0.009***(-3.75) | 0.009***(-3.75) |
| Edu | 0.052***(1.92) | 0.046***(1.64) | 0.050***(1.89) |
| Rd | 0.015*(1.85) | 0.015*(1.87) | 0.018**(2.15) |
| Constant | 0.135***(15.05) | 0.082***(10.95) | 0.055***(14.98) |
| R2 | 0.095 | 0.091 | 0.093 |
| N | 20000 | 20000 | 20000 |
On the basis of hypothesis 1 model, economic policy (EP) and its interaction term with green low-carbon and recycling economy (GE-EP) are added sequentially for regression to test whether economic policy uncertainty plays a moderating role in the development of green low-carbon and recycling economy and industrial structure. The moderating role of economic policy is shown in Table 8. Table 8 shows the moderating effect of economic policy in the managerial ability and the development of green low-carbon and recycling economy and industrial structure during the period from 2013 to 2022. From the empirical results, it can be seen that the regression coefficients of green low-carbon and recycling economy (GE) and economic policy (EP) are significantly positive. And the coefficient of the interaction term (GE*EP) is -25.111, which is significantly negative at 1% level, which indicates that economic policy uncertainty negatively moderates the positive correlation between green low-carbon recycling economy and industrial structure development. Research hypothesis 3 is thus verified, and the results of this test are basically consistent with the theory of real options.
| (1) TP | (2) TP | (3) TP | |
|---|---|---|---|
| GE | 8.225*** (0.000) |
3.558*** (0.001) |
18.682*** (0.008) |
| EP | 2.579* (0.075) |
2.888 (0.472) |
|
| GE*EP | -25.111*** (0.002) |
||
| Agdp | 10.225*** (0.000) |
4.825*** (0.000) |
10.456*** (0.000) |
| Gov | 0.572*** (0.000) |
0.525*** (0.002) |
0.588*** (0.001) |
| Edu | 0.524*** (0.229) |
0.518*** (0.208) |
0.535*** (0.242) |
| Rd | 0.568*** (0.018) |
0.516*** (0.015) |
0.588*** (0.022) |
| Constant | 10.132*** (0.256) |
8.68*** (0.211) |
11.225*** (0.262) |
| R2 | 0.285 | 0.289 | 0.291 |
| N | 20000 | 20000 | 20000 |
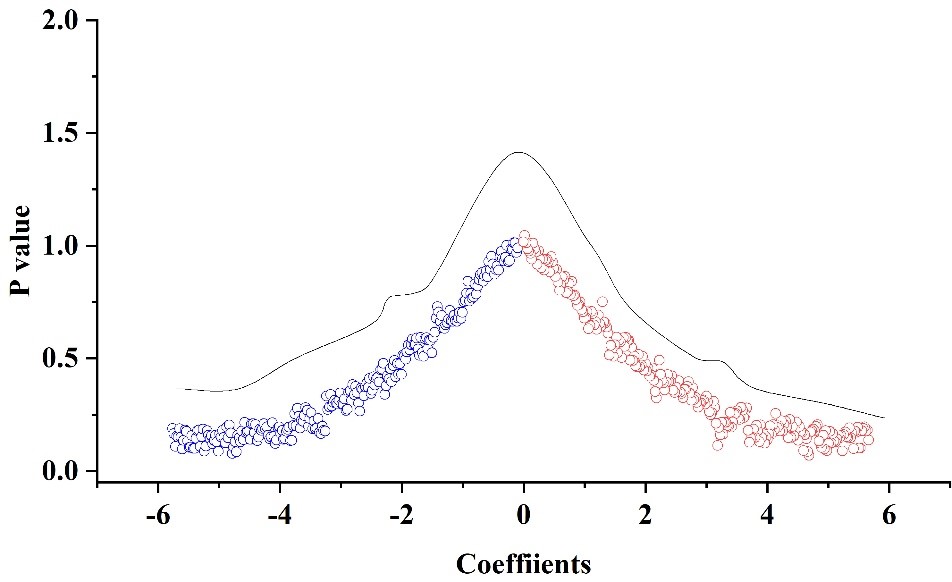
In order to further test that the statistical significance of the explanatory variables is not due to partially random factors, it is clear that the promotion of green low-carbon cycle on industrial structure is indeed a causal effect. In this paper, a placebo test is carried out to construct the treatment group through 500 random samples, and the benchmark regression is carried out separately, so as to obtain the kernel density distribution plots of the estimated coefficients of the 500 core explanatory variables, and the placebo test of the industrial structure is shown in Fig. 5. It is clear from Figure 5 that the estimated coefficient values differ significantly and insignificantly from the actual coefficients in the benchmark regression. As a result, this paper concludes that unobserved individual city characteristics do not affect the accuracy of the estimation results, and that the double-difference estimation of the development effect of the industrial structure of the green, low-carbon and recycling economy policy passes the placebo test.
Through in-depth analysis of the relationship between green, low-carbon and recycling economy, economic policy and industrial structure development, this paper shows that green, low-carbon and recycling economy has a significant positive impact on the development of industrial structure, and the national green, low-carbon and recycling economy composite index in 2022 has increased by 178.8% compared with that of 2013, and this significant increase promotes the rationalization and advanced development of industrial structure.
Economic policies promote the development of industrial structure to a certain extent, but their impacts show an inverted U-shaped relationship, which means that the positive effect of economic policies on the development of industrial structure will change to an inhibitory effect when they reach a certain critical point, and economic policies play a significant role in regulating the development of the green, low-carbon, and recycling economy and the development of industrial structure, in particular, in the context of the uncertainty of the economic policies, their negative regulating effect is important for the adjustment of industrial structure and the promotion of industrial structure. The study also finds that there are significant differences in the level of development of green low-carbon and recycling economy and industrial structure in different regions, and the eastern region is generally ahead of the central and western regions in these two aspects, which indicates that it is necessary to consider the inter-regional differences in promoting the development of green low-carbon economy and the adjustment of industrial structure.
The transformation and upgrading of the industrial structure of each region not only improves the advanced level of industry, but also promotes the development of low carbon and environmental protection to a certain extent, but the speed and degree of transformation of the industrial structure varies from region to region, which requires further optimization and adjustment of the relevant policies. The study reveals the complex relationship between the green low-carbon and recycling economy, economic policies and the development of the industrial structure, and provides policymakers with the following recommendations The study reveals the complex relationship between green low-carbon and recycling economy, economic policies and industrial structure development, and provides important references for policy makers to promote the rational development of industrial structure and ecological civilization.
This study provides valuable insights into the relationship between green and low-carbon economy, economic policy and industrial structure development, but the development level of green low-carbon circular economy and the development of industrial structure are a dynamic process, and the implementation of economic policy is also timely, which may have an effect on the experimental results. Therefore, in the future research, we need to fully consider the dynamic measure of the green and low-carbon circular economy, economic policy and industrial structure, and the experiment is a city that is fully tested by economic policy.


