Cultural industry is an emerging industry, also known as the sunrise industry in the 21st century, the society has a greater demand for cultural industry management talents [1, 2, 3]. Cultural industry management is a specialty with strong application, and the construction of practical teaching system can cultivate more professional talents for the society.The cultural industry is a part of the national strategy, and colleges and universities should cultivate more professional talents for the society through scientific and effective teaching methods [4, 5, 6]. As of 2017, nearly 200 schools in undergraduate colleges have set up the specialty of cultural industry management, and there is a gradual increase in the number of high-quality talents in the cultural industry. As of 2017, nearly 200 schools in undergraduate colleges and universities have set up cultural industry management majors, and the number of high-quality talents in the cultural industry is gradually increasing. cultural industry management undergraduate stage mainly cultivates applied talents, but the development of some colleges and universities’ cultural industry management majors is not very good, and there is no perfect practical teaching system, and there are even fewer excellent composite talents trained. The cultural industry management specialty needs a development outlet, and the construction of practice teaching system is a good choice [7, 8, 9].
As a comprehensive application specialty with the cultivation of cultural literacy, management skills training and the enhancement of cultural innovation ability, it is of practical significance for universities to explore the transformation of applied disciplines, and it is crucial to strengthen the construction of teaching materials for cultural industry management to realize the goal of cultivating talents in applied disciplines, and the construction of teaching materials for cultural industry management is facing both opportunities and challenges under the background of digitization [10, 11, 12].
Based on the digital background, the teaching material construction of cultural industry management should continuously strengthen the positioning of the specialty as an applied discipline, improve the teaching material system with three types of courses: theoretical, theoretical+practical, and applied skills, and lead the three-dimensional and comprehensive construction of the professional teaching material system with the view of “big teaching material” [13, 14, 15]. The construction of teaching materials for cultural industry management should also be combined with digital content to enhance the practicality of teaching materials, digital resources to update the teaching content, digital technology to reform teaching methods, and digital platforms to innovate the practice mode, in order to cultivate talents with comprehensive literacy, professional accumulation and application knowledge [16, 17, 18].
The digital transformation of cultural industry education is to support education in the development of education, school mode, management system and guarantee mechanism, and promote the education process reconstruction, structural reorganization and cultural reconstruction, change the development power structure of education, promote the reform of the education research and practice paradigm of the cultural industry, and realize the comprehensive, free and personalized development of people. Digital tools provide more possibilities for education, allowing teaching to be more personalized, self-directed and interactive, and also allow learning to break through the limits of time and space, more convenient and efficient. At the same time, it also presents new requirements for teachers and students, such as the need to master the skills of using these tools, and to learn the learning and teaching strategies in the digital environment.
This study focuses on the role of digital tools in enhancing the interactivity of teaching and learning in cultural industry management. Firstly, the basic framework of the study is clarified through the analysis of the current situation of cultural industry management profession and the application of digital tools. Then, questionnaire survey and interviews are used to investigate the current situation of the digital teaching ability and its application in frontline teaching. The data of frontline teachers and students of a university in Jiangxi Province are collected and analyzed to explore the actual effect of digital tools in enhancing the interactivity of teaching. Finally, multiple linear regression analysis is used to further verify the specific degree of the impact of digital tools on teaching interactivity, so as to provide an opportunity for the improvement of teaching interactivity. By collecting and analyzing the data of first-line teachers and students in a university in Jiangxi Province, the study explores the actual effect of digital tools in improving teaching interactivity, and finally, multiple linear regression analyses are used to further verify the specific degree of the impact of digital tools on teaching interactivity, with a view to providing theoretical support and practical guidance for the effective integration of digital educational tools and the innovation of the teaching mode.
The specialty of cultural industry management is characterized by the comprehensiveness of multidisciplinary subjects such as culture, art, management and economics, and is highly practical. At the present stage, there are different types of schools offering this major, mainly comprehensive colleges and media art colleges, and the cultural industry management major focuses on different cultivation directions according to the professional strengths and characteristics of each school.
In comprehensive colleges and universities, the major of cultural industry management focuses on the dissemination and management of culture, art and its various disciplines, and the curriculum of its art courses cannot be completely separated from the art system.
In media art colleges and universities, the cultural industry management major focuses more on the art courses offered by the institution as the basis and research object. Therefore, in its disciplinary significance, cultural industry management can be attributed to both management disciplines and art disciplines, which is an important interdisciplinary specialty of management and art disciplines.
In the context of the era of informationization and intelligence, teaching tools and teaching modes will also be upgraded and iterated. The design of cultural products has an extremely close connection with the development and change of society, and students must always stand at the forefront of social development and pay close attention to the latest research results in various disciplines. Basic education should also update the teaching content in a timely manner, while discussing the latest technological achievements with students, it should also impart the ideology of advancing with the times, so that they can constantly update their knowledge in their future studies and work, so that the products they design will progress with the times.
There are three types of digital tools required for teaching and learning, one is digital modeling software, the other is virtual hardware and software, and the third is hardware and software for manufacturing.
(1) Digital modeling software
Digital modeling software part includes all kinds of three-dimensional modeling software, such as rhinoceros, Zbrush and so on. Various types of rendering software such as keyshot, thea and so on. These tools are now widely used in the basic teaching of product design, product design students must master the tools, with the use of other tools can further play its role.
(2) Virtual hardware and software
Virtual hardware and software such as VR headset, real-time rendering engine.
(3) Manufacturing hardware and software
Manufacturing hardware and software such as 3D printers, laser cutting machines and their supporting pre-processing software and control software. In manufacturing hardware, the main application equipment is FDM-type 3D printers, LCD-type 3D printers, and CO2 laser cutting machines.
Digital competence, i.e., adding the ability to use information technology to the original foundation.
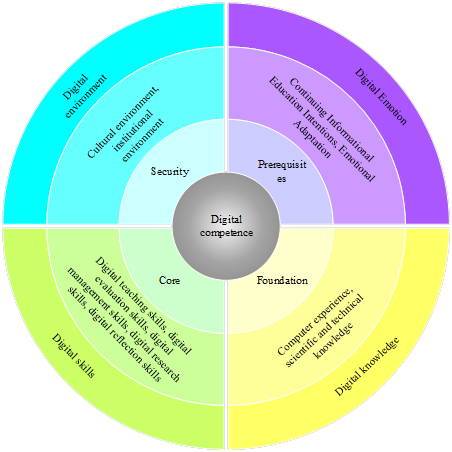
The digital competence of cultural industry management teaching refers to the psychological qualities of digital emotion, digital knowledge, digital skills and digital environment involved in the use of information technology for teaching, teaching and research, and reflection that institutional teaching possesses. At the same time, the digital competence of teaching based on digital emotion, digital knowledge, digital skills and digital environment also involves the observation points of persistent informatization teaching intention and emotional adaptation. The basic structure of teaching digital competence is shown in Figure 1.
Digital emotion refers to the cognition of the emotional aspects of digitalization, which mainly includes teachers’ and students’ emotion of continuous application of informatization teaching and emotional adaptation to education informatization, and is the prerequisite for the enhancement of the digital competence of institutional teaching.
Digital knowledge refers to the background knowledge of teachers and students that enables them to use digitalization for teaching and learning, which is the basis for the development of digital competence in institutions.
Digital skills refer to the specific abilities of teachers and students to use digitalization for teaching and learning practice, including digital teaching ability, management ability, evaluation ability, research ability and reflection ability, and digital skills are the core of the development of institutional digital competence.
Digital environment refers to the standardized and digitalized environment under the mutual influence of teachers and students in the specific environment of the institution, which is the guarantee for the improvement of teachers’ and students’ digital ability.
In order to clarify the current situation of digital competence of front-line teaching and the characteristics of professional competence development at this stage, so as to provide strategic support for digital tools in the interactivity of teaching cultural industry management. This study conducted a survey and interviews in the form of sampling for digital teaching ability and its application.
The focus of the study has two parts: digital teaching competence and scenario-based intelligent technology application, where the digital teaching competence dimension contains the reserve of digital technology, instructional design and implementation, and instructional reflection. The study designed two open-ended interview questions from the dimensions of digital technology application gap and competency needs, “What are the problems of frontline teaching in the process of carrying out digital technology-integrated education and teaching?”, “What competencies are required of teachers and students in the process of applying smart technologies to teaching?”.
This study takes the first-line teachers and sophomore students of a university in Jiangxi Province as the research object, and utilizes the random sampling method to conduct a survey, obtaining a total of 513 valid information. The competence requirements of digital teaching were obtained, and the frequency statistics of the competence requirements of digital teaching are shown in Table 1. The ability to use digital tools is specifically subdivided into basic teaching skills, instructional design ability, collaborative teaching ability, data diagnosis ability, teaching decision-making ability, teaching reflection ability, interdisciplinary teaching ability, data analysis ability, and innovation ability. Among them, the survey data of frontline teaching show that teachers and students believe that the five competencies of basic teaching skills, instructional design ability, collaborative teaching ability, data diagnostic ability, and instructional decision-making ability are the main skill requirements in the teaching and learning application of digital tools, which account for more than 65% of the total number of students.
| Serial number | Critical ability | Frequency | Serial number | Critical ability | Frequency | Serial number | Critical ability | Frequency |
| 1 | Basic teaching skills | 482 | 4 | Data diagnostic ability | 367 | 7 | Interdisciplinary teaching ability | 264 |
| 2 | Teaching design ability | 430 | 5 | Teaching decision-making ability | 337 | 8 | Data analysis capability | 255 |
| 3 | Collaborative teaching ability | 404 | 6 | Teaching reflection ability | 289 | 9 | Innovative ability | 183 |
Multiple linear regression analysis examines the effect that multiple factors have on a problem, where \(Y\) is the actual problem to be solved and \(\left(x_{1} \sim x_{n} \right)\) is the multiple factors. By analyzing the relationship between the two, some regular changes can be derived, thus creating a multiple linear regression model. Because of the simplicity and practicality of this method, it is widely used in various fields, including the financial industry, the real estate industry, the medical industry, and so on.
The multiple linear regression analysis model is expressed as, \[\label{GrindEQ__1_}\tag{1} Y_{i} =\beta _{1} +\beta _{2} X_{2i} +\beta _{3} X_{3i} +\ldots +\beta _{k} X_{ki} +\mu _{i}.\]
Parameter \(\beta _{i} \left(j=1,2,\ldots ,k\right)\) in the model is the partial regression coefficient, \(n\) is the sample size, the role of the partial regression coefficient is to hold other factors constant, and the unit change in the \(j\)rd explanatory variable corresponds to the effect of the mean value of the variable.
The multivariate linear regression model for \(K\) explanatory variables with \(n\) observation samples can be expressed as, \[\label{GrindEQ__2_}\tag{2} \left\{\begin{array}{l} Y_{1}=\beta_{0}+\beta_{1}X_{11}+ \beta_{2}X_{12}+\cdots \beta_{m-1}X_{1m-1}+\mu_{1}\\ Y_{2}=\beta_{0}+\beta_{1}X_{21}+ \beta_{2}X_{22}+\cdots \beta_{m-1}X_{2m-1}+\mu_{2} \\ \vdots \\ Y_{n}=\beta_{0}+\beta_{1}X_{n1}+ \beta_{2}X_{n2}+\cdots \beta_{m-1}X_{nm-1}+\mu_{n} \end{array}\right.\] is written in matrix form as, \[\label{GrindEQ__3_}\tag{3} Y=X\beta +\mu.\] Among them \[\label{GrindEQ__4_}\tag{4} Y=\left(\begin{array}{l} {y_{1} } \\ {y_{2} } \\ {\vdots } \\ {y_{n} } \end{array}\right)X=\left(\begin{array}{ccccc} {1} & {x_{12} } & {x_{13} } & {\cdots } & {x_{1k} } \\ {1} & {x_{22} } & {x_{23} } & {\cdots } & {x_{2k} } \\ {\vdots } & {\vdots } & {\vdots } & {} & {\vdots } \\ {1} & {x_{n2} } & {x_{n3} } & {\cdots } & {x_{nk} } \end{array}\right)\beta =\left(\begin{array}{l} {\beta _{1} } \\ {\beta _{2} } \\ {\vdots } \\ {\beta _{k} } \end{array}\right)\mu =\left(\begin{array}{l} {\mu _{1} } \\ {\mu _{2} } \\ {\vdots } \\ {\mu _{n} } \end{array}\right)\]
Assumptions need to be made on the model before the model is built in order to facilitate the calculation of the model’s parameters, and the model needs to satisfy the following assumptions;
Assumption 1: Zero mean assumption: \(E\left(\varepsilon _{i} \right)=0\), \(i=1,2,\cdots n\), i.e., \[\label{GrindEQ__5_}\tag{5} E\left(\varepsilon \right)=E\left[\begin{array}{c} {\varepsilon _{1} } \\ {\varepsilon _{2} } \\ {\vdots } \\ {\varepsilon _{n} } \end{array}\right]=\left[\begin{array}{c} {E(\varepsilon _{1} }) \\ E({\varepsilon _{2} }) \\ {\vdots } \\ E({\varepsilon _{n} }) \end{array}\right]=0.\]
Assumption 2: Same Variance Assumption (the variance of \(\varepsilon\) is the same constant), \[\label{GrindEQ__6_}\tag{6} Var\left(\varepsilon _{1} \right)=E\left(\varepsilon _{i}^{2} \right)=\sigma ^{2} ,(i=1,2,\cdots ,n).\]
Hypothesis 3: No autocorrelation, \[\label{GrindEQ__7_}\tag{7} \begin{array}{c} {Cov\left(\varepsilon _{i} ,\varepsilon _{j} \right)=E\left(\varepsilon _{i} \varepsilon _{j} \right)=0,(i\ne j,i,j=1,2,\cdots ,n)} \\ {\begin{array}{rcl} &&{\left. E\left(\varepsilon \varepsilon {'} \right) =E\left[\begin{array}{c} {\varepsilon _{1} } \\ {\varepsilon _{2} } \\ {\vdots } \\ {\varepsilon _{n} } \end{array}\right]\left(\varepsilon _{1} ,\varepsilon _{2} ,\cdots \varepsilon _{n} \right)\right.} \\ {} & {=} & {E\left[\begin{array}{cccc} {\varepsilon _{1}^{2} } & {\varepsilon _{1} \varepsilon _{2} } & {\cdots } & {\varepsilon _{1} \varepsilon _{n} } \\ {\varepsilon _{2} \varepsilon _{1} } & {\varepsilon _{2}^{2} } & {\cdots } & {\varepsilon _{2} \varepsilon _{n} } \\ {\vdots } & {\vdots } & {\vdots } & {\vdots } \\ {\varepsilon _{n} \varepsilon _{1} } & {\varepsilon _{n} \varepsilon _{2} } & {\cdots } & {\varepsilon _{n}^{2} } \end{array}\right]} \\ {} & {=} & {\left[\begin{array}{cccc} {E\left(\varepsilon _{1}^{2} \right)} & {E\left(\varepsilon _{1} \varepsilon _{2} \right)} & {\cdots } & {E\left(\varepsilon _{1} \varepsilon _{n} \right)} \\ {E\left(\varepsilon _{2} \varepsilon _{1} \right)} & {E\left(\varepsilon _{2}^{2} \right)} & {\cdots } & {E\left(\varepsilon _{2} \varepsilon _{n} \right)} \\ {\vdots } & {\vdots } & {\vdots } & {\vdots } \\ {E\left(\varepsilon _{n} \varepsilon _{1} \right)} & {E\left(\varepsilon _{n} \varepsilon _{2} \right)} & {\cdots } & {E\left(\varepsilon _{n}^{2} \right)} \end{array}\right]} \\ {} & {=} & {\left[\begin{array}{cccc} {\sigma _{\mu }^{2} } & {0} & {\cdots } & {0} \\ {0} & {\sigma _{\mu }^{2} } & {\cdots } & {0} \\ {\vdots } & {\vdots } & {\vdots } & {\vdots } \\ {0} & {0} & {\cdots } & {\sigma _{\mu }^{2} } \end{array}\right]=\sigma _{\mu }^{2} I_{n} } \end{array}} \end{array}\]
Hypothesis 4: Random error term \(\varepsilon\) is uncorrelated with explanatory variable \(X\), \[\label{GrindEQ__8_}\tag{8} \left. Cov\left(X_{ji} ,\mu _{i} \right)=0\right),(j=1,2,\cdots ,k,i=1,2,\cdots ,n).\]
Assumption 5: The random error term \(\varepsilon\) follows a normal distribution with mean zero and variance \(\sigma ^{2}\), \[\label{GrindEQ__9_}\tag{9} \varepsilon _{i} \sim N\left(0,\sigma _{\mu }^{2} I_{n} \right).\]
Hypothesis 6: There is no complete multicollinearity between the explanatory variables, \[\label{GrindEQ__10_}\tag{10} rank(X)=m+1\le n.\]
The estimate of the multiple linear regression parameter \(\beta _{0} ,\beta _{1} ,\beta _{2} ,\cdots ,\beta _{m}\) is unique when the rank of the matrix of sample observations of the independent variable \(X\) is the number of parameters \(m+1\).
A key issue in multiple linear regression models is to calculate the estimates of the regression coefficients obtained, and similar to the parameter estimation method of the same linear regression model, the parameter estimates of the commonly used multiple linear regression models are also the least squares method. In the multiple linear regression model, the model requires the assumption that there is no complete covariance between the independent variables, and in practical applications, although there is usually an approximate covariance problem between the independent variables, this does not violate the basic assumption of the multiple linear regression model. Therefore, the least squares method is still the best linear unbiased estimation method, and this subsection focuses on the basic principles of the least squares method.
For the set of multiple linear regression equations expressed in Eq. 2 , parameter \(\beta _{0} ,\beta _{1} ,\beta _{2} ,\cdots ,\beta _{m}\) is estimated by the least squares method to find the estimate of parameter \(\beta _{0} ,\beta _{1} ,\beta _{2} ,\cdots ,\beta _{m}\), \(\hat{\beta }_{0} ,\hat{\beta }_{1} ,\hat{\beta }_{2} ,\cdots ,\hat{\beta }_{m}\), such that the sum of squares of the deviations of the model from the observations, \[\label{GrindEQ__11_}\tag{11} Q\left(\beta _{1} ,\beta _{2} ,\cdots ,\beta _{m} \right)=\sum\limits_{i=1}^{n}\left[y_{1} -\left(\beta _{0} +\beta _{1} x_{i1} +\beta _{2} x_{i2} +\cdots +\beta _{m} x_{im} \right)\right]^{2}\]
Obtain the minimum value, when the deviation sum of squares is minimum, \[\label{GrindEQ__12_}\tag{12} \begin{array}{rcl} {Q\left(\hat{\beta }_{1} ,\hat{\beta }_{2} ,\cdots ,\hat{\beta }_{m} \right)} & {=} & {\sum\limits_{i=1}^{n}\left[y_{i} -\left(\hat{\beta }_{0} +\hat{\beta }_{1} x_{i1} +\hat{\beta }_{2} x_{t2} +\cdots +\hat{\beta }_{mr} x_{im} \right)\right]^{2} }. {} \end{array}\]
The \(\hat{\beta }_{0} ,\hat{\beta }_{1} ,\hat{\beta }_{2} ,\cdots ,\hat{\beta }_{m}\) obtained in Eq. 12 is then called the least squares estimate of the regression coefficient \(\beta _{0} ,\beta _{1} ,\beta _{2} ,\cdots ,\beta _{m}\). The estimate of the regression coefficient \(\hat{\beta }_{0} ,\hat{\beta }_{1} ,\hat{\beta }_{2} ,\cdots ,\hat{\beta }_{{\rm m}}\) needs to satisfy the following conditions, \[\label{GrindEQ__13_}\tag{13} \left\{\begin{array}{c} {\left. \frac{\partial Q}{\partial \beta _{0} } \right|_{\hat{A}_{i} ={\mathop{\beta _{0} }\limits^{.}} } =-2\sum\limits _{i=1}^{n}\left[y_{i} -\left(\hat{\beta }_{0} +\hat{\beta }_{1} x_{i1} +\hat{\beta }_{2} x_{i2} +\cdots +\hat{\beta }_{m} x_{im} \right)\right] =0} \\ {\left. \frac{\partial Q}{\partial \beta _{1} } \right|_{\beta _{i} =\dot{\beta }_{1} } =-2\sum\limits_{i=1}^{n}\left[y_{i} -\left(\hat{\beta }_{0} +\hat{\beta }_{1} x_{i1} +\hat{\beta }_{2} x_{i2} +\cdots +\hat{\beta }_{m} x_{im} \right)x_{i1} \right] =0} \\ {\cdots \cdots } \\ {\left. \frac{\partial Q}{\partial \beta _{m} } \right|_{\beta _{m} -\hat{\beta }_{m} } =-2\sum\limits_{i=1}^{n}\left[y_{1} -\left(\hat{\beta }_{0} +\hat{\beta }_{1} x_{i1} +\hat{\beta }_{2} x_{i2} +\cdots +\hat{\beta }_{m} x_{im} \right)x_{im} \right] =0} \end{array}\right.\]
For \(X\) in Eq. 13 , if \(\left(X{'} X\right)^{-1}\) exists, then a least squares estimate of the regression coefficients can be obtained and the least squares estimate is, \[\label{GrindEQ__14_}\tag{14} \hat{\beta }=(XX)^{-1} Xy.\]
At this point, the estimates of the regression coefficients are calculated and the resulting multiple linear regression model is, \[\label{GrindEQ__15_}\tag{15} \hat{y}=\hat{\beta }_{0} +\hat{\beta }_{1} x_{1} +\hat{\beta }_{2} x_{2} +\cdots +\dot{\beta }_{m} x_{m}.\]
This study adopts the research design of hybrid method, combined with quantitative and qualitative research methods, so as to make a more comprehensive geographical solution and evaluate the application of digital tools in the culture industry management teaching. The school USES digital tools to conduct the class of cultural industry management teaching, and the study of the school year.
(1) Quantitative research: by collecting data from students’ grades, learning attitudes and learning strategies, quantitative analysis of the impact of digital tools on students’ learning effects.
(2) Qualitative research: qualitative investigation of students and teachers through in-depth interviews and observations. They collect the experience and opinions of the use of digital tools for the management of cultural industry, and understand the problems and challenges they encounter in the actual use of the process, and their expectations and Suggestions for the log-word chemical tools.
Data collection: collect data in a variety of ways, including test scores, questionnaire survey, interview records, teacher reports, and student works. Baseline data is collected before the study begins, and then collect data regularly in the course of the study to track student progress and changes.
Data analysis: using SPSS statistical software to conduct descriptive statistics and reasoning statistics on quantitative data. The relationship between basic teaching skills, teaching design ability, collaborative teaching ability, data diagnostic ability and teaching decision-making ability and cultural industry management teaching interaction were explored using t test and correlation analysis. For qualitative data, the NVivo software is used to encode and theme analysis. The interview records and observations are analyzed, the key topics and patterns are extracted, and the experience and opinions of the students and teachers are deeply understood.
This section provides a descriptive and differential analysis of the interaction between the use of digital tools and the teaching of cultural industry management through the data samples, exploring the general status of the use of digital tools and the teaching of cultural industry management, as well as the differential characteristics of digital tools for teaching cultural industry management across different pedagogies.
In this section, based on the purpose and content of the study, 513 valid data were obtained, processed and analyzed with the cultural industry management course in S-school as the research object. Based on the factors related to digital tools proposed in the previous section, i.e., basic teaching skills, instructional design ability, collaborative teaching ability, data diagnosis ability, and instructional decision-making ability, as well as the effectiveness of teaching interaction in cultural industry management, descriptive statistical analyses of relevant variables were conducted. These include sample size, median, extreme value, extreme value, mean and standard deviation. The descriptive statistics of the overall characteristics are shown in Table 2.
Except for the interactive effectiveness of teaching cultural industry management component, the scores of the five variables of the digital tool were higher than 3.3, indicating that the overall situation of each variable was better. Among them, the basic teaching skills of the digital tool scored the best overall, with the mean scores of instructional design, co-teaching, data diagnosis, and instructional decision-making being 3.732, 3.693, 3.556, and 3.469, respectively. The mean scores of the five variables of the digital tool were ranked from high to low as basic teaching skills\(\mathrm{>}\)instructional design ability\(\mathrm{>}\)co-teaching ability\(\mathrm{>}\)data diagnosis ability\(\mathrm{>}\)instructional decision-making ability. The relatively highest scores for basic teaching skills indicate that college faculty and students are more proficient in the use of digital tools and are able to perform basic teaching operations.
| Variable | Median | Minimum value | Maximum value | Mean | Standard deviation | |
| Digital tool | Basic teaching skills | 3.865 | 2.6 | 5.0 | 3.762 | 0.821 |
| Teaching design ability | 3.732 | 1.9 | 4.6 | 3.653 | 0.832 | |
| Collaborative teaching ability | 3.693 | 1.2 | 4.6 | 3.593 | 0.753 | |
| Data diagnostic ability | 3.556 | 1.5 | 4.3 | 3.548 | 0.856 | |
| Teaching decision-making ability | 3.469 | 1.1 | 4.5 | 3.305 | 0.806 | |
| Cultural industry management teaching interaction | Teaching interaction | 2.914 | 1.3 | 4.2 | 2.752 | 0.637 |
Using the background information of teaching cultural industry management as a reference, we analyze whether there are differential characteristics of teaching content, teaching time, teaching environment, and teaching strategies in the interaction between digital tools and teaching cultural industry management. This study uses independent samples t-test and one-way ANOVA to understand the differential characteristics of teaching interaction between digital tools and cultural industry management.
(1) Independent samples t-test
In order to investigate whether teaching time has differential characteristics on the teaching interaction of digital tools and cultural industry management, this study uses independent samples t-test to analyze and get specific data analysis results. The data of the test of difference of teaching time in each variable are shown in Table 3. Teaching time in teaching decision-making ability, the mean scores of 0\(\mathrm{\sim}\)30 minutes, 0\(\mathrm{\sim}\)45 minutes, and 0\(\mathrm{\sim}\)60 minutes are 3.509, 3.627, and 3.621, respectively, which get that the teaching decision-making ability of 0\(\mathrm{\sim}\)45 minutes is higher than that of 0\(\mathrm{\sim}\)60 minutes and 0\(\mathrm{\sim}\)30 minutes. Teaching time was not differentiated in both digital tools and cultural industry management teaching interactions.
| Variable | Teaching time/minute | T | ||
|---|---|---|---|---|
| 0-30 | 0-45 | 0-60 | ||
| Basic teaching skills | 3.563\(\pm\)0.863 | 3.652\(\pm\)0.875 | 3.682\(\pm\)0.792 | -1.863 |
| Teaching design ability | 3.689\(\pm\)0.832 | 3.756\(\pm\)0.798 | 3.669\(\pm\)0.804 | -1.827 |
| Collaborative teaching ability | 3.564\(\pm\)0.841 | 3.629\(\pm\)0.722 | 3.655\(\pm\)0.738 | -1.532 |
| Data diagnostic ability | 3.637\(\pm\)0.893 | 3.663\(\pm\)0.793 | 3.699\(\pm\)0.775 | -1.754 |
| Teaching decision-making ability | 3.509\(\pm\)0.835 | 3.627\(\pm\)0.708 | 3.621\(\pm\)0.760 | -1.792 |
| Teaching interaction | 3.561\(\pm\)0.864 | 3.689\(\pm\)0.747 | 3.598\(\pm\)0.775 | -0.696 |
(2) One-way ANOVA
In this study, one-way ANOVA was used to test whether there is a significant difference between teaching strategies in digital tools and cultural industry management teaching interaction. In this section, teaching strategies are divided into instructional management strategies, organizational strategies, delivery strategies, and strategies for motivating students, taking into account the research of existing scholars.
The difference analysis of teaching strategies in each dimension is shown in Table 4.
Teaching strategies are classified according to the cultural industry management profession, i.e., instructional management strategies, organizational strategies, delivery strategies and motivating students strategies.
As can be seen from the table, there is a significant difference between different instructional management strategies in data diagnostic ability and instructional decision-making ability, and the mean score of data decision-making ability is higher than the mean score of data diagnostic ability, with a difference of 0.473. In terms of instructional design ability, the strategy of stimulating students’ motivation has a significant difference with the instructional management strategy, organizational strategy, and delivery strategy, and when the instructional strategies of cultural industry management teaching can stimulate students’ motivation, the mean score of instructional design competence reaches the highest value of 3.938.
Using digital tools to practice the practical teaching of cultural industry management, students can understand the principle of work in the process of cultural industry management architecture, and the real topic learning can arouse the students’ exploration desire, cultivate the students’ problem solving ability, and form the consciousness of exploration and innovation.
| Teaching strategy | Basic teaching skills | Teaching design ability | Collaborative teaching ability | Data diagnostic ability | Teaching decision-making ability | Teaching interaction |
| Teaching management strategy |
3.657
$$\mathrm{\pm}$$0.633 |
3.645$$\mathrm{\pm}$$0.801 |
3.637
$$\mathrm{\pm}$$0.672 |
3.248
$$\mathrm{\pm}$$0.731 |
3.721
$$\mathrm{\pm}$$0.624 |
3.561
$$\mathrm{\pm}$$0.639 |
| Organizational strategy |
3.535
$$\mathrm{\pm}$$0.824 |
3.747$$\mathrm{\pm}$$
0.821 |
3.538$$\mathrm{\pm}$$
0.721 |
3.472$$\mathrm{\pm}$$
0.757 |
3.237$$\mathrm{\pm}$$0.814 |
3.590$$\mathrm{\pm}$$
0.756 |
| Transfer strategy |
3.664$$\mathrm{\pm}$$
0.789 |
3.725
$$\mathrm{\pm}$$0.765 |
3.752
$$\mathrm{\pm}$$0.831 |
3.573
$$\mathrm{\pm}$$0.688 |
3.647
$$\mathrm{\pm}$$0.834 |
3.656
$$\mathrm{\pm}$$0.779 |
| Motivational strategy |
3.468
$$\mathrm{\pm}$$0.964 |
3.938
$$\mathrm{\pm}$$0.905 |
3.478
$$\mathrm{\pm}$$0.935 |
3.376
$$\mathrm{\pm}$$0.656 |
3.235
$$\mathrm{\pm}$$0.624 |
3.389
$$\mathrm{\pm}$$0.635 |
In order to ensure the scientific validity of the results of the multiple linear regression analysis, it is necessary to diagnose whether there is a covariance problem between the independent variables in the regression model. After analysis, it was found that the tolerance of the respective variables was greater than 0.1, the CI value was more than 15, and the VIF value was less than 2, indicating that there was no multicollinearity problem among the independent variables.
Using a regression analysis model, this paper aims to explore the impact of digital tools on the interactivity of teaching cultural industry management. Combined with the previous analysis of the basic structure of digital competence, the focus here is on the basic part as well as the core part of digital competence, i.e., digital knowledge and digital skills.
In this study, there are significant differences between digital tools and cultural industry management teaching interaction in both variables of digital knowledge and digital skills, so these two variables need to be controlled.
In this section, an empirical study is conducted specifically on the impact of digital tools on the interactivity of teaching cultural industry management. Correlation analyses are conducted on the main research variables respectively, and one-way ANOVA is utilized to further examine the differences in the interaction of digital tools on the teaching of cultural industry management at different levels. Multiple linear regression analysis was then used to further explore the causal relationship that exists between the research variables.
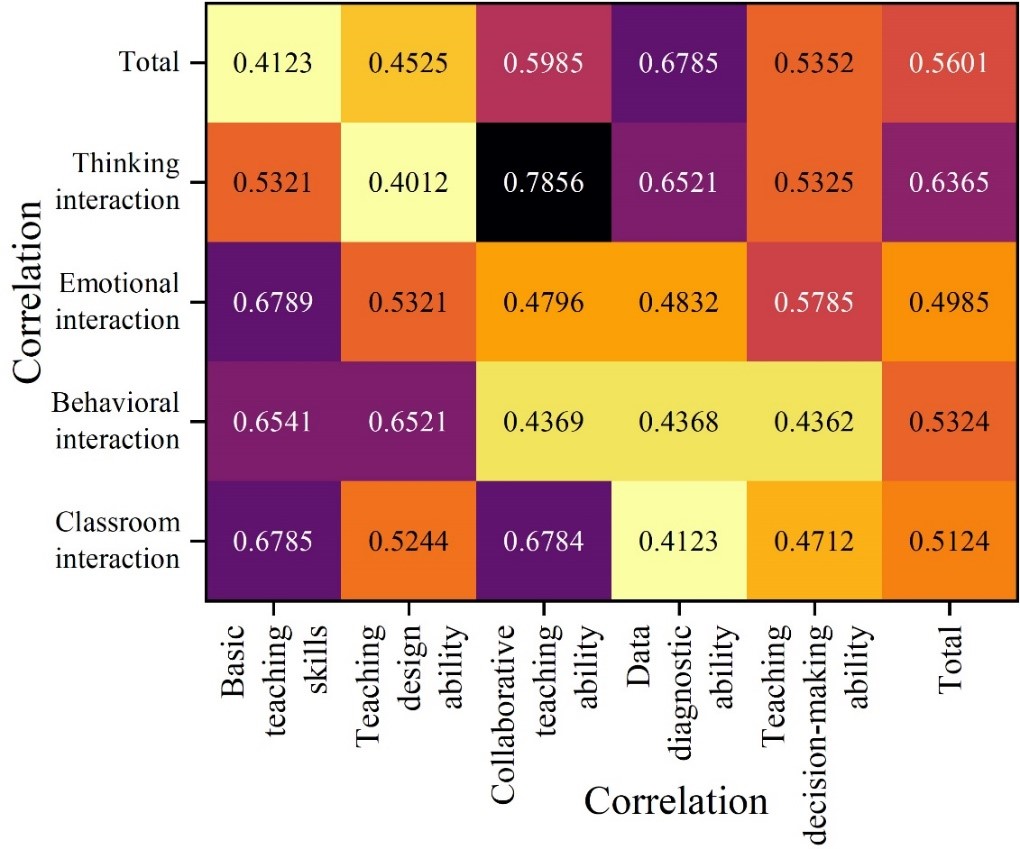
The analysis of the correlation between digital tools and teaching interaction is shown in Figure 2. As a whole, the product-difference correlation coefficient of basic teaching skills and classroom teacher-student interaction is 0.6785, which is a significant positive correlation, and the degree of association between the two is moderately correlated (0.40 \(\mathrm{\le}\) r \(\mathrm{\le}\) 0.70). In particular, it was noted that the correlation between co-teaching skills and thinking interaction was strong with a value of 0.7856.
The forced-entry variable method was chosen to conduct a class regression analysis with cultural industry management teaching interaction as the dependent variable, digital tools as the independent variable, and digital knowledge and digital skills as the control variables.
(1) Class regression analysis of each variable on cultural industry management teaching interaction
In order to observe the change of the influence of digital tools on cultural industry management teaching interaction under the control of certain variables, all control variables were added at once in Model 1, digital knowledge variables were put into Model 2, digital skills variables were put into Model 3, and the results of regression analysis are shown in Table 5.
The independent variable digital knowledge in Model 2 has an \(\beta\) value of 0.713, a T value of 43.252, p\(\mathrm{<}\)0.05, an \(R^{2}\) value of 0.425, and an \(\Delta R^{2}\) value of 0.401, which indicates that digital knowledge has a significant positive effect on the teaching interaction of cultural industry management, controlling for the influence of the factor of digital skills, and that the explanatory power of digital knowledge on the teaching interaction of cultural industry management reaches 40.1%, reaching a significant level.
After adding the digital skill variable in Model 3, the \(\beta\) value of the digital knowledge variable is 0.632. From 0.713 in Model 2 to 0.632 in Model 3, the \(\beta\) value decreases by 0.081, digital knowledge significantly positively affects the cultural industry management teaching interaction, but the influence effect is significantly weakened. That is, there is a significant positive influence of digital knowledge on cultural industry management teaching interaction when digital skills are controlled.
| Independent variable | Categories | Model 1 | Model 2 | Model 3 | |||
|---|---|---|---|---|---|---|---|
| \(\beta\) value | T value | \(\beta\) value | T value | \(\beta\) value | T value | ||
| Digital knowledge | Complete grasp and general mastery, | -0.065 | -2.251* | -0.06 | -4.583** | -0.072 | -0.485** |
| No mastery and general mastery | 0.032 | 1.017 | 0.016 | 0.613 | 0.005 | 0.118 | |
| Digital skill | Fully skilled and General proficiency | 0.069 | 2.558 | -0.004 | -0.414 | 0.000 | 0.036 |
| Unskilled and General proficiency | -0.024 | -0.710 | -0.032 | -1.493 | -0.021 | -1.059 | |
| Digital knowledge | 0.713 | 43.252** | 0.632 | 45.058** | |||
| Digital skill | 0.168 | 10.234*** | |||||
| Regression model summary | \(F\)value | 3.652*** | 158.359*** | 160.566*** | |||
| \(R^{2}\) | 0.023 | 0.425 | 0.453 | ||||
| \(\Delta F\)value | 3.760*** | 1932.298*** | 98.005*** | ||||
| \(\Delta R^{2}\) | 0.025 | 0.401 | 0.035 | ||||
(2) Stratified regression analysis of the effects of digital skills, digital knowledge and digital tools on teaching interaction in cultural industry management
In order to observe the changes in the impact of digital tools on cultural industry management teaching interaction with certain variables controlled. All control variables were added at once in Model 1, digital skill variables were put in Model 2, and digital knowledge variables were added in Model 3. The results of the hierarchical regression analysis are shown in Table 6.
The \(\beta\)-value and T-value of the independent variable digital skills in Model 2 are 0.324 and 18.969 respectively, with a p-value of less than 0.05, which indicates that digital skills have a significant positive impact on cultural industry management teaching interactions with the control of the digital knowledge factor, and that digital skills have an explanatory power of 19.3% on cultural industry management teaching interactions.
| Independent variable | Categories | Model 1 | Model 2 | Model 3 | |||
| $$\beta $$ value | T value | $$\beta $$ value | T value | $$\beta $$ value | T value | ||
| Digital knowledge | Complete grasp and general mastery, | -0.063 | -2.368* | -0.058 | -2.362* | -0.082 | -4.680** |
| No mastery and general mastery | 0.041 | 1.029 | 0.007 | 0.269 | 0.006 | 0.134 | |
| Digital skill | Fully skilled and General proficiency | 0.072 | 2.601* | 0.074 | 3.125** | 0.000 | 0.036 |
| Unskilled and General proficiency | -0.021 | -0.732 | -0.005 | -0.152 | -0.033 | -1.106 | |
| Digital skill | 0.324 | 18.969*** | 0.173 | 10.203*** | |||
| Digital knowledge | 0.737 | 43.661*** | |||||
| Regression model summary | $$F$$value | 3.911*** | 23.967*** | 165.219*** | |||
| $$R^2 $$ | 0.027 | 0.131 | 0.467 | ||||
| $$\Delta F$$value | 3.986*** | 236.852*** | 1759.366*** | ||||
| $$\Delta R^2 $$ | 0.028 | 0.193 | 0.415 | ||||
This paper shows that the application of digital tools in the teaching of cultural industry management significantly improves teaching interactivity. 513 valid samples were analyzed, and teachers and students generally believe that the application of digital tools enhances basic teaching skills, instructional design ability, co-teaching ability, data diagnosis ability and teaching decision-making ability, especially instructional design ability, which has a significantly higher mean score of 3.938 than other competencies in the strategy of stimulating students’ motivation. In addition, multiple linear regression analysis further confirms that digital knowledge and digital skills have a significant positive effect on enhancing the interactivity of teaching cultural industry management, specifically, digital knowledge has an explanatory power of 40.1% and digital skills have an explanatory power of 19.3% for the interactivity of teaching, which suggests that digital tools not only enhance teachers’ teaching ability, but also enhance their ability of teaching. These data show that digital tools not only enhance teachers’ teaching ability, but also promote students’ motivation and engagement.
The application of digital tools in the teaching of cultural industry management is of great significance in enhancing the interactivity of teaching, which not only helps to improve the efficiency and quality of teaching, but also stimulates students’ interest and motivation in learning; therefore, higher education institutions should pay attention to the application of digital tools in teaching and continue to explore and optimize the way of integrating digital tools in the teaching of cultural industry management, so as to achieve the innovation of the teaching mode and improve the quality of teaching. At the same time, education management departments should support and promote the research and development and application of digital education tools to meet the needs of modern education development.
In the practical teaching of cultural industry management, first, the teacher needs to create a real situation, which is the real problem driver, and the whole project is connected through the key problem chain. The students have a series of exploration activities around real and intentional driving problems, and the problems of the project are analyzed, the problem of analysis and the problem solving are solved.
Second, teachers set up digital learning platforms that can be written, interactive and feedback, providing rich learning resources and stents, guiding and helping students to realize digital learning and actively construct knowledge.
Finally, the teachers should be mixed with various digital tools to assist students in the project exploration, encourage students to carry out the digital innovation of cultural industry management, improve the solution in cooperation, and in practice, the process of learning is transformed into an innovative and creative process.


