In the field of digital economy, China has built and formed a number of Internet enterprises and digital economies [1,2], and is among the world’s leading companies in e-commerce, mobile payment, smart logistics and digital economy employment [3]. In recent years, online trade, education, medical care, office, entertainment and consumption and other new types of business innovation and development [4,5], the digital economy, with its resilience and power, highlights the significant role of supporting the stable development of the national economy and vitality and vigor, and presents a strong trend of vigorous development [6]. In the face of the rapid development of the digital economy, it has become an important and urgent task to accelerate the construction of a legal system adapted to the new economic form and escort the high-quality development of the digital economy [7,8].
In the context of China’s industrial upgrading and economic restructuring [9], state-owned investment institutions have gradually become the major players in the private equity investment industry by virtue of their strong capital capacity and good reputation brand [10]. However, facing the rapid growth of the scale of private equity investment [11], how to adjust and optimize the investment strategy under the existing resource elements [12], in order to maintain a stable investment return and realize the preservation and appreciation of state-owned capital, is precisely the important issue that the state-owned investment institutions need to be resolved.
With the improvement of the level of economic development, demographic changes and the high-speed development of new generation information technology [13,14], the boundaries and scope of the health industry are constantly expanding, and various industrial forms are gathering and combining to form a big health industry that spans across many industrial fields [15,16].
Currently, China’s big health industry presents the development status and trend of continuous improvement of industrial foundation, continuous pulling of industrial demand, deep optimization of industrial supply, and deepening development of industrial technology [17,18], and at the same time, the industry also exists problems such as homogenization of industrial layout, low-end product and service, primary industrial integration, and insufficient configuration of industrial data elements [19,20]. The big health industry, which meets all kinds of health needs of consumers as well as consists of multi-level industries, should be developed in accordance with the laws of industrial chain and industrial system development [21].
In order to construct the development power model of the big health industry, this paper takes the measurement of the development level of the industry as the entry point and puts forward the measurement model of the development level of the big health industry, which provides the theoretical basis for the analysis of the current situation of the overall development level of the big health industry and the simulation of the development power with the correlation coefficient of the enterprise’s investment as the regulating parameter. In the model of development dynamics of the big health industry, corresponding measurement models are proposed for the industry as a whole and individual enterprises respectively. In the industrial development level measurement model, the ant colony algorithm – projection tracing model is used to measure the development level, the indicators are normalized, the order of projection coefficients is adjusted by the ant colony algorithm to optimize the projection indicator function, and finally the optimal projection indicator function is obtained, and the corresponding order of coefficients values is the optimal projection direction. In the enterprise development level measurement model, the BP network model is used to complete the evaluation of the enterprise development level, and several enterprise-related data are selected as training samples, and the weights and thresholds are constantly adjusted, and the lower values and thresholds are fixed when the error is reduced to the required range and the system stops learning. Combined with the proposed development level measurement model of the big health industry, the development measurement analysis and development power simulation simulation analysis of the big health industry are carried out, and in the end, the construction path of the development power model of the big health industry is proposed.
In this chapter, the development level measurement model based on ant algorithm and BP neural network is proposed from the perspectives of the industry as a whole and the individual enterprises in the industry, which illustrates the development trend of the big health industry from the perspectives of the industry as a whole and the individual enterprises.
This section constructs the indicator system from the four dimensions of personnel, technology, resources and manufacturing to comprehensively evaluate the development level of the big health industry. The coefficient value of each index of the development level of big health industry is measured by using ant colony algorithm-projection tracing model, and according to the optimal coefficient value, the sub-dimension data of the development level of big health industry and the optimal result are obtained to provide relevant data for the following empirical analysis.
In this paper, ant colony algorithm is selected as the optimization algorithm. The ant colony algorithm can be carried out simultaneously by placing multiple individuals for path exploration, which improves the running efficiency of the algorithm. Ant colony algorithm is an optimization algorithm that simulates the foraging behavior of ants, and was first applied to the traveler problem to find the optimal path. The basic principle of the ant colony algorithm is that there is no pheromone initially, and the path selection starts randomly from the starting point, and the pheromone is released on the route, and the concentration of the released pheromone is inversely proportional to the length of the path. When the ant colony encounters this fork in the path again, it will choose a higher pheromone, and as the pheromone concentration gradually increases, thus enabling the colony to find the best foraging route.
In summary, choosing the optimal projection coefficient value according to the maximum of the projection direction function can make full use of each indicator to contain information, so the projection tracing model is a more objective method, which can effectively carry out a comprehensive evaluation of the indicator system. Among many optimization algorithms for coefficient values, this paper uses the ant colony algorithm to optimize the coefficient values, which has a strong computational ability, and can select coefficient values and calculate the projection values of multiple individuals at the same time, from which the optimal results of each group can be selected, which improves the operational efficiency of the algorithm. Therefore, this paper adopts the ant colony algorithm-projective tracing model to measure the development level of big health industry.
The indicators selected in this paper are all positive indicators, but due to the different units of measurement and orders of magnitude, they cannot be compared, so it is necessary to normalize the indicators to make them comparable. The formula for normalization is: \[\label{GrindEQ__1_} \hat{x}_{ij} =\frac{x_{ij} -\min \left(x_{j} \right)}{\max \left(x_{j} \right)-\min \left(x_{j} \right)} .\tag{1}\]
The sample set of each index value in Eq. (1) is \(\left\{x_{ij} \left|i=1,2,\ldots ,n;j=1,2,\ldots ,p\right. \right\}\), where \(x_{ij}\) is the \(j\)th evaluation index value of the \(i\)rd sample, \(n\) is the number of samples, \(p\) is the number of evaluation indexes, and \(\max \left(x_{j} \right)\) and \(\min \left(x_{j} \right)\) are the maximum and minimum values in the \(j\)th evaluation index data, respectively.
In this paper, the initial projection coefficient value \(a\left(a_{1} ,a_{2} ,\ldots ,a_{p} \right)\) is generated randomly, and the randomly generated projection coefficient value needs to satisfy the condition that the sum of squares is 1, and then the ant colony algorithm is used to adjust the order of the projection coefficient value. The adjusted projection coefficient values and the normalized data can get the corresponding one-dimensional space projection values \(z_{i}\), and equation (2) is the projection value calculation formula: \[\label{GrindEQ__2_} z_{i} =\sum _{j=1}^{p}a_{j} \hat{x}_{ij} .\tag{2}\]
In order to make the projection value more representative, the requirement for local projection points is to concentrate as much as possible, preferably a few point clusters, while the overall distribution of point clusters should be dispersed as much as possible. Therefore, construct the projection indicator function \(Q\left(a\right)\), compare the size of the projection indicator function, and select the projection coefficient value of the largest projection function value as the coefficient value of the indicator system in this paper. Projection indicator function calculation method: \[\label{GrindEQ__3_} Q\left(a\right)=s\left(a\right)d\left(a\right) ,\tag{3}\] where \(s\left(a\right)\) is the standard deviation of the projected value \(z_{i}\), calculated as: \[\label{GrindEQ__4_} s\left(a\right)=\sqrt{\frac{1}{n} \sum _{i=1}^{n}\left(z_{i} -\bar{z}_{l} \right)^{2} } .\tag{4}\]
\(d\left(a\right)\) is the local density of the projection value \(z_{i}\), calculated as: \[\label{GrindEQ__5_} d\left(a\right)=\sum _{i=1}^{n}\sum _{k=1}^{n}\left(R-r_{ik} \right) f\left(R-r_{ik} \right) .\tag{5}\]
Eq. (5) in \(R\) is the window radius of the local density, and when setting the specific value of \(R\), it should be ensured that the average number of projected points in the window should not be too small to prevent the slip mean from being too large, and it will not increase too much with the number of indices \(n\), therefore, in this paper, the window radius is set to \(R=s\left(a\right)*0.1\). \(r_{ik}\) is the distance between samples, and \(f\left(R-r_{ik} \right)\) is the unit step function when \(R-r_{ik} \ge 0\), \(f\left(R-r_{ik} \right)=1\), and when \(R-r_{ik} <0\), \(f\left(R-r_{ik} \right)=0\).
The key to the projection tracing model is to optimize the projection indicator function, and the projection indicator function optimization problem refers to the constraint that the coefficient sum of squares is 1, so that the projection indicator function is maximized. Each group of coefficient values can get the projection index function, using the ant colony algorithm to change the order of the coefficient values and calculate the projection index function, the maximum projection index function can be obtained for this group, repeat the calculation for multiple groups of coefficient values, and finally get the optimal projection index function, the corresponding coefficient value order is the best projection direction. Using the corresponding coefficient value to the projection value, and the projection value is the level of development of the big health industry that needs to be measured in this paper. The method is to use \(a_{j}\) as the optimization variable, the use of ant colony algorithm to solve the optimal value of the complex nonlinear problem: \[\label{GrindEQ__6_} \left\{\begin{array}{c} {\max Q\left(a\right)=s\left(a\right)d\left(a\right)} \\ {\sum\limits_{j=1}^{p}a_{j}^{2} =1} \end{array}\right. .\tag{6}\]
In this paper, the process of improving the projection tracing model of the ant colony algorithm to measure the development level of the big health industry is accomplished through Python code, and the Python code of the ant colony algorithm-projection tracing model is shown in the Appendix. Firstly, we randomly generate several groups of 13 coefficient values \(a\), and the sum of squares of each group of coefficient values is 1. We change the order of each group of coefficient values by simulating the ACO algorithm, and then we search for the largest coefficient values of the projective indicator function \(Q\left(a\right)\) after several iterations.
(1) BP network model structure
Error back propagation neural network (BP), is a multilayer feed forward network containing hidden layers. If the number of input nodes of the network is M and the output nodes are L then this neural network can be viewed as a mapping from M-dimensional Euclidean space to L-dimensional Euclidean space. This mapping is highly nonlinear. Many problems in reality, such as pattern recognition, image processing, system identification, function fitting, optimization computation, etc., can be converted into this neural network to deal with”. The problem of evaluating the internal dynamics of enterprise development is actually a spatial mapping from the M-dimensional input index value to the dimensional output value, therefore, the author uses the BP network model to complete the evaluation of the internal dynamics of enterprise development. The first layer of the network model is the input layer, the middle layer is the hidden layer, and the third layer is the output layer, and the neurons in each layer form a full interconnection connection with each other, while there is no connection between the neurons within each layer, and the number of units in the input layer is the number of indexes of the power evaluation, and the number of units in the output layer is one, i.e., the power evaluation value.
The determination of the number of hidden layer units is directly related to the number of input and output units. Too few hidden units and the network cannot be trained, or the network is not robust enough to recognize previously unseen samples and has poor error tolerance. Too many hidden units in turn makes the learning time too long and the error is not always optimal, so there exists an optimal number of hidden units, i.e.: \[\label{GrindEQ__7_} n_{H} =\sqrt{n_{1} +n_{0} } +1 .\tag{7}\]
In Equation (7), \(n_{H}\) – the number of neurons in the hidden layer, \(n_{I}\) – the number of neurons in the input layer, \(n_{0}\) – the number of neurons in the output layer, 1 – an integer between 1 and 10.
The input value of the input layer neurons in the network is equal to the output value, and the relationship between the input and output of the neurons in the hidden layer and the output layer is used in the Sigmoid function of the network response function, that is: \[\label{GrindEQ__8_} f\left(x\right)={1\mathord{\left/ {\vphantom {1 \left(1+e^{-x} \right)}} \right. } \left(1+e^{-x} \right)} .\tag{8}\]
(2) Computational principle of BP network
The first layer, the output value of the input layer: \[\label{GrindEQ__9_} O_{pi} =r_{pi} p=1,2,ksi=1,2,k,m .\tag{9}\]
The second layer, the output value of the implicit layer: \[\label{GrindEQ__10_} O_{pj} =f\left(ne_{pj} \right)j=1,2,k,n ,\tag{10}\]
where \(net_{pj} =\sum _{i=1}^{m}\bullet O_{pj} +\theta _{j} j=1,2,k,n\).
Layer 3, the input values of the output layer: \[\label{GrindEQ__11_} O_{p} =f\left(net_{p} \right) .\tag{11}\]
Of these, \(net_{p} =\sum _{j=1}^{n}\bullet O_{pj} +\theta\).
For sample mode \(p\) the error function between the actual output \(O_{p}\) and the target output \(b_{p}\): \[\label{GrindEQ__12_} E_{p} =\frac{1}{2} \left(h_{p} -O_{p} \right)^{2} .\tag{12}\]
Then the total error for \(p\) sample is: \[\label{GrindEQ__13_} E=\sum _{p=1}^{s=1}Ep .\tag{13}\]
Neural network learning ends when \(E<\varepsilon\) (\(\varepsilon\) is any small positive number given \(\varepsilon =1.0\times 10^{-3}\) in this model) in equation (13). The evaluation value of the competitiveness of each enterprise can be calculated according to the network model determined at this point.
The algorithm of this evaluation model is as follows.
In the first step, initial values are assigned to the network connection weights \(w_{ij} \left(0\right)\), \(w_{j} \left(0\right)\) and neuron thresholds \(\theta _{j} \left(0\right)\), \(\theta \left(0\right)\).
In the second step, input sample pattern pairs (input data and target data).
In the third step, starting from the output layer, adjust the weights and thresholds according to the following formula: \[\label{GrindEQ__14_} w_{j} (t+1)=w_{j} (t)+\eta \omega _{p} O_{j} +\alpha \left[w_{j} -w_{j} (t-1)\right] ,\tag{14}\] \[\label{GrindEQ__15_} w_{ij} (t+1)=w_{ij} (t)+\eta \omega _{pj} O_{pj} +\alpha \left[w_{ij} (t)-w_{ij} (t-1)\right] ,\tag{15}\] \[\label{GrindEQ__16_} \theta (t+1)=\theta (t)+\eta \omega _{p} +\omega \left[\theta _{j} (t)-\theta (t-1)\right] ,\tag{16}\] \[\label{GrindEQ__17_} \theta _{j} \left(t+1\right)=\theta _{j(t)} +\eta _{\omega _{pj} } +\omega \left[\theta _{j} -\theta _{j} \left(t+1\right)\right] ,\tag{17}\] where \(t\) is the number of iterations, \(\eta\) denotes the learning efficiency and \(\eta \in \left(0,1\right)\), \(\omega\) denotes the momentum factor, and \(\omega \in \left(0,1\right)\), and have: \[\label{GrindEQ__18_} \omega _{p} =\left(h_{p} -O_{p} \right)\left(1-O_{p} \right),\tag{18}\] \[\label{GrindEQ__19_} \omega _{pj} =O_{pj} \left(1-O_{pj} \right)\omega _{p} w_{j} .\tag{19}\]
In the fourth step, calculate \(E\) If \(E\) is less than the given convergence value, the training of the neural network is over, otherwise go to the third step.
The above network algorithm is operated with Matlab software to train the neural network. First of all, a number of enterprise-related data (including input and output) are selected as training samples, the system automatically learns after the sample data is input, and constantly adjusts the weights and thresholds, and the system stops learning when the error is reduced to the required range, at which time the weights and thresholds are fixed.
Based on the ant colony algorithm and the bp neural network, because its structure simple programming is easy to implement, and the high speed and precision of the operation is high, the following advantages are given in the use of the horizontal measure model.
Nonlinear mapping ability. In the development of major health industries, there are many factors affecting the development of major health industries, the intersection of different factors, the complexity of the relationship, and the nonlinear relationship. After the ant colony algorithm and the bp neural network are trained by a certain amount of samples, the mapping relationship can be obtained by learning, and the corresponding nonlinear mapping is realized.
Fault tolerance. In the process of the development measure of the great health and health industry, there may be incomplete situations in certain horizontal data, which can affect the accuracy of the evaluation results. However, based on ant colony algorithm and bp neural network, it can identify the incomplete information to identify the recovery and ensure the accuracy of the results.
The habit of self-study. Self-study habit refers to the information and knowledge of the ant colony algorithm and the bp network in the continuous training process, and the information and knowledge are stored in the network, and the corresponding solution rules are summarized.
Self-organizing. Self-organization refers to the adjustment of the value and valve value of the error, and the neural network of the development measure of the great health industry is automatically constructed.
The research data is derived from the Chinese statistics yearbook “China health and health statistics yearbook” the Chinese social statistics yearbook “China environmental statistics yearbook” the Chinese high-tech industry statistical yearbook, and some of the data is based on the national economic and social development statistics bulletin and the national bureau of statistics website. In order to ensure the integrity of the data, the individual missing data is calculated by the method of modification, and some of the specific data (such as the proportion of health care and the proportion of visitors to the permanent population) is measured by the original data, and the data collection and follow-up processing of the data are collected and followed, and the panel data of 31 provinces (autonomous regions and municipalities directly under the central government) of 2009-2023 are obtained.
The development level of China’s national and three major regions’ big health industry from 2009 to 2023 is shown in Table 1. In recent years, the development level of the large health industry in the country and the three major regions of the east, center and west has shown an upward trend, and the development level of the large health industry in the country has risen by 215.35% in the examination period. The three regions have always had a leading edge in the eastern region, both in terms of net growth value and growth rate. The measured value of the development level of the eastern region in 2023 reached 0.789, with a growth rate of 244.54%. The western region, on the other hand, is always in a lagging position, with the lowest net growth value and growth rate among the three regions, which are 0.583 and 198.97%, respectively, leading to the “magnifying” trend of regional differences.
| Region | 2009 | 2011 | 2013 | 2015 | 2017 | 2019 | 2021 | 2023 | Margin of growth(%) | Ranking |
|---|---|---|---|---|---|---|---|---|---|---|
| Eastern region | 0.229 | 0.237 | 0.363 | 0.331 | 0.462 | 0.564 | 0.62 | 0.789 | 244.54 | 1 |
| Central region | 0.206 | 0.256 | 0.271 | 0.381 | 0.338 | 0.515 | 0.587 | 0.662 | 221.35 | 2 |
| Western region | 0.195 | 0.213 | 0.251 | 0.344 | 0.423 | 0.525 | 0.545 | 0.583 | 198.97 | 3 |
| The whole nation | 0.215 | 0.253 | 0.295 | 0.352 | 0.408 | 0.535 | 0.584 | 0.678 | 215.35 | – |
The development level of each sub-dimension industry development level of big health is shown in Figure 1. The results show that there are differences in the development level of the major health sub-dimension industries, and the medical and health service industry has the highest development level, with an average value of 0.41 and an increase of 2.58%. The development level of health food manufacturing industry is relatively weak, with an average value of 0.027. The largest increase is in the health and sports industry, with an increase of 12.61%. The smallest increase for the health management services industry, the growth rate of only 0.06%, may be caused by environmental pollution and governance effects of uneven, and industrial content is single, is bound to “quality and capacity”. In addition, the higher level of development of the industry may not exist “high growth” trend, such as medical and health services, health and sports industry, so there may be a “catch-up” effect between industries.

Using Stata16.0 software to calculate the global Moran index from 2009-2023, the details are shown in Table 2. The results show that the development level of China’s big health industry in 2009-2023 shows a spatial positive correlation, forming the phenomenon of spatial agglomeration and polarization. In this regard, this study mainly focuses on the dynamic analysis of the distribution of spatial agglomeration of the big health industry in 2008-2018, and only analyzes the reasons for the non-significant part, and no longer carries out local spatial regional analysis. From the numerical size, the spatial agglomeration level of the health industry in 2009-2023 showed an overall “inverted U-shaped” distribution. 2015 reached the peak, and the Moran index was 0.283, so with 2012 as the node, it was divided into two agglomeration periods. In the first period from 2009 to 2015, the Moran index shows an upward trend, and the agglomeration level of the development of big health industry rises, and the difference in the development level of different places gradually widens. In the second period from 2015 to 2023, the Moran index gradually declines, and the gap between the agglomeration levels keeps narrowing, indicating that the “Matthew effect” gradually fades, the spatial heterogeneity weakens, and the development of the large health industry appears to be saturated to a certain extent.
| Year | Moran index |
|---|---|
| 2009 | -0.025 |
| 2010 | -0.004 |
| 2011 | 0.105** |
| 2012 | 0.197*** |
| 2013 | 0.224*** |
| 2014 | 0.214*** |
| 2015 | 0.283*** |
| 2016 | 0.152** |
| 2017 | 0.16** |
| 2018 | 0.185*** |
| 2019 | 0.242*** |
| 2020 | 0.193*** |
| 2021 | 0.086* |
| 2022 | 0.035 |
| 2023 | -0.094 |
| Mean value | 0.128 |
| ***,**,* indicates that there is a significant level of 5%t and 10% and 1%. | |
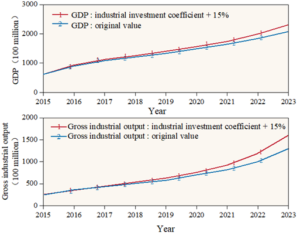
One of the main means to promote the development of the big health industry is to expand the production investment, this section takes the enterprise production investment coefficient as the regulating parameter, increases its investment coefficient by 15%, and obtains the results of the impact on the state variables such as GDP and industry GDP as shown in Figure 2. It can be seen that when the production investment coefficient grows by 15%, it can bring about a significant increase in the total output value of the big health industry and the industry GDP. In the simulated GDP data of the big health industry from 2015 to 2023, the simulated GDP value in 2023 is increased by about 10% compared with the original value, and the total industry GDP value is increased by about 17%.
Fixed asset investment is an important part of investment strategy. In this section, the fixed asset investment coefficient of enterprises is used as a regulation parameter, and its investment coefficient is increased by 15% to get the results of the impact on GDP and total fixed assets state variables as shown in Figure 3. The simulated simulation GDP data of the big health industry in 2015-2023 is comparable to the original value. The simulation data of the total fixed assets expenditure, on the other hand, has increased compared with the original value, which is about 8% higher than the original value in 2023. It can be found that increasing the fixed asset investment in the health industry does not bring a great increase in the industry GDP, but only in the value of fixed assets, and the conversion efficiency of the investment is low. Fixed asset investment money should be considered when the pressure of industrial production is not too great, and it does not agree with the blind expansion of facilities.

Combined with the above situation of measuring the development level of the big health industry and the simulation analysis of the development power simulation, this chapter will propose the construction path of the development power model of the big health industry from the perspective of the optimization of the investment strategy.
Establish a strict and efficient investment management system, and rationally arrange production and fixed asset investment. Streamline the management mechanism, clarify the management process, strengthen the management of the investment team, and formulate the investment performance appraisal system and a reasonable remuneration program.
Strengthening the design of financing modes for investment projects. Strictly control the investment scale of public welfare projects, strengthen multi-level financing, and choose suitable financing modes for projects of different natures. In public welfare projects, it is necessary to establish the necessary financing capacity reserves, take different combinations of financing modes, long, medium and short-term supporting, forming an effective linkage of financing funds. In quasi-public welfare projects, financing can be carried out through the combination of PPP mode and bonds, funds and other financing modes. At the same time, the operational projects can be opened to social capital to reduce the group’s financing pressure by attracting social capital investment.
Establish risk assessment and early warning system. Risk assessment is the primary consideration for the implementation of investment behavior. Establishment of judgmental risk early warning procedures containing risk identification, risk assessment and risk process, and formulation of reasonable risk assessment links with solvency, profitability and operating ability as the main contents. Establishing the three major balancing mechanisms to realize the balance between net assets and liabilities, cash flow, inputs and outputs.
To make full use of the prevention and detection of diseases in major health industries. We will increase the support force for disease prevention, disease detection and medical innovation, and improve the development of major health industries. Promote healthy maintenance, health improvement, and health promotion of related industries, promote the integration of major health industries and edge industries into new industries, expand industry types, improve development conditions and make great health industrial development “foundation.
To fully exert the radiation movement in the eastern region. Differentiation can be an important driver of better and faster development in a big health industry. In this regard, the development effect of regional resources should be properly allocated, and the leading role of the dominant region is maximized. We should focus on the help of the region, form the radiation drive effect, the weak with the advantage, the development of the large healthy industry with the local characteristics, and the “national health”.
To make full use of the leading role of major health industries everywhere. We will make reasonable use of regional agglomeration effect, introduce policies for the development of major health industries, increase the number of “high and high” concentrated provinces, and maintain the current momentum of development, actively develop the advantages of all parts of the country, and make the construction of “healthy China” to the real place.
This paper proposes a model for measuring the development level of the big health industry from the measurement of the development level of the industry, and uses it to carry out the analysis of the measurement of the development level of the big health industry and the simulation analysis of the development dynamics with the correlation coefficient of the investment of the enterprise as the regulating parameter. Based on the results of the analysis, the construction path of the development power model of the big health industry is proposed. The study draws the following conclusions:
During the period of 2009-2023, the development level of the national health industry increased by 215.35%, and the development level of the eastern region reached 0.789 in 2023, with a growth rate of 244.54%, which is a leading edge in the three major regions in terms of net growth value and growth rate. The development level of the health industry in the country and the three major regions of the East, Central and West shows a positive trend, but the regional differences show an “amplification” trend.
In terms of the level of industrial development in each sub-dimension of major health, the medical and health services industry has the relatively highest level of development, with an industrial average value of 0.41 and an increase of 2.58%. The smallest increase is in the health management service industry, with an increase of only 0.06%. There are significant differences in the level of development between the various sub-dimension industries in the major health industry, with varying degrees of development.
From 2009 to 2023, the spatial agglomeration level of the large health industry as a whole showed an “inverted U-shaped” distribution, and reached a peak in 2015, with the Moran index of 0.283. From 2009 to 2015, the Moran index showed an upward trend, and from 2015 to 2023, the Moran index gradually declined, and the gap in agglomeration level was constantly narrowing. narrowing. Overall the development of the large health industry has appeared a certain state of saturation.
In the simulation analysis of the development momentum of the big health industry, taking the enterprise production investment coefficient as the regulating parameter, and increasing its investment coefficient by 15%, the total output value of the industry and the industry’s GDP have been significantly increased. And in the enterprise fixed assets investment coefficient as a regulatory parameter, the same will be its investment coefficient increased by 15%, simulation simulation of the industry GDP data and the original value is not much different, only in the fixed assets value has been improved. In the optimization of investment strategy of big health industry, production investment should be the main optimization direction.References
Lei Shen, female, November 1986, Waiqingsong Road No. 7989, Shanghai, PR China, PH.D., lecturer, foreign trade and investment, factor flow.


