n recent years, the residents’ spiritual demand for a better life and the leisure demand for going out on vacation have been increasingly surging, and a series of changes are bound to occur in the motivation of travelers, the way of going out and the structure of tourism consumption after the epidemic, which will lead to the challenge of the tourism supply and demand system, which originally had structural contradictions [1-3]. The supply-side structural reform of the economy is to abandon the speed, efficiency and scale pursued in traditional production, and turn to the quality and efficiency of output, emphasizing the matching degree of supply and demand and the welfare effect of output [4-6]. The new era has given the tourism industry a strong national responsibility to prosper the border and enrich the people, and tourism development has become the preferred road to revitalize the economy of many ethnic areas and to get rid of poverty and become rich [7-9]. At present, the tourism industry in ethnic areas, whether it is to promote the overall economic and social development, or to implement the strategy of governance, have been given unprecedented height and responsibility [10-12]. Not only has the rapid surge, the scale of domestic and international demand for tourism market, but also has a world-class quality tourism resources and multi-level support to help tourism policy support [13-16]. Therefore, how to solve the contradiction between supply and demand, adjust the structure of supply and demand, create “unforgettable tourism products” for tourists, “support tourism reception” for the whole region, and “support the tourism environment” for the whole people to achieve common prosperity has become an urgent problem for the tourism industry in ethnic areas.
Game theory, also known as tournament theory or response theory, is a branch of applied mathematics. Game theory is mainly used to explore decision analysis when behaviors or interactions occur between participants and discuss the results of equilibrium decisions [17-20]. Currently, the theory is widely used in computer science, economics, military strategy, international relations, political science, biology and many other disciplines.A complete game should contain the following four elements: the participants, which is mainly the organizations or individuals who carry out independent actions, make independent decisions, and bear the results independently in the process of the game; the strategy space, which is mainly the strategies chosen by the participants in the process of the game Set, that is, in order to choose the method or behavior, in which each strategy corresponds to a result of the game. The more strategies a participant has to choose from during the game, the more complex the game is; the order of the game, which mainly refers to the order of the participants’ actions during the game. If the order of the game changes, the results of the game often have essential changes; game benefit, each strategy of the participants in the game corresponds to the result, the result indicates that the combination of strategies under the benefit of the participants. Gain information is an important factor that affects the equilibrium outcome of the game. If the above four elements are identified, a game is identified.
Under the macro environment of supply-side structural reform, the Stackelberg game of tourism system is used as a perspective to carry out hierarchical decomposition of the tourism demand system and supply system in ethnic areas, to explore the relationship and structural characteristics of the tourism supply and demand system tuned in ethnic areas, to identify the key influencing factors existing on the supply side, and to explore the transformation and upgrading of the demand side [21-22].
According to the importance of tourism talent resources development, this paper puts forward the corresponding tourism talent resources supply reform strategy, and constructs the “H” type talent two-line cultivation model. Based on the Stackelberg game model, a tourism supply-side coordination structure is established from a generalized perspective, and the node members within the structure are described, and the optimal benefits of the tourism supply side are empirically analyzed from the three aspects of tourism scenic spots, travel agencies and the overall benefits of the supply side. The framework of the role of tourism human resources supply-side reform on common wealth is proposed, and four variables, namely, development, commonality, sharing and sustainability, are chosen as the explanatory variables of this study, and the entropy method, bivariate spatial autocorrelation and the spatial panel Durbin model are combined to jointly evaluate the level of influence of the explanatory variables on the core explanatory variables of the development of tourism.
For the perception of human resources, scholars have given a variety of different explanations, after analyzing the interpretation from two aspects. First, from the perspective of capacity, for example: the so-called human resources, their own conditions have been satisfied to participate in the construction of various types of work, and at the same time have the relevant capabilities of the population. Human resources are the skills and knowledge possessed by human beings themselves, and these abilities are able to meet the needs of the production of relevant products and provide various services to the needy groups. Secondly, from the perspective of human beings, for example: human resources refers to the total working population within a certain social region, which is composed of the working-age population with the ability to work and the population over the working age. Human resource is the general term for people with intellectual and physical labor capacity who can promote social and economic development. The interpretation of the meaning of human resource is that it refers to the sum of the physical and mental capacities of human beings that contribute to the creation of value and can be utilized by the organization.
Therefore, human resources in tourism refer to the people who are engaged in activities directly related to and affecting the development of tourism, which is formed by continuous investment and accumulation in the process of tourism development.
The supply and demand of tourism talents has a certain influence on the development of tourism economy, in the mutual relationship between the two, the sustainable growth of tourism economy needs the supply of tourism talents, and the growth of tourism talents’ demand changes with the changes of tourism economy and labor productivity. Therefore, the supply and demand of tourism talents and the development of tourism economy have a close connection.
The supply and demand relationship of tourism talents is manifested in three aspects: undersupply, oversupply, and equilibrium of supply and demand. Although the supply and demand relationship of tourism talent in the state of oversupply, to a certain extent, will promote the development of tourism economy and society, but will cause a waste of tourism talent, is relative to the demand for tourism talent. When there is an oversupply of demand, it will limit the development of tourism economy to a certain extent. For a specific region and period, the supply and demand of tourism talents will present a balanced state of supply and demand.
Therefore, the study of the supply and demand relationship of tourism talents, so as to solve all kinds of problems in the process of tourism talents training and management, further improve the external and internal environment of tourism talents, improve the competitiveness of tourism talents, and create conditions for tourism talents to realize their self-worth has laid a solid foundation.
In order to meet the needs of the tourism market for various types of tourism personnel, and to realize the leapfrog development of the tourism economy, talents are the key, however, the arduous task of cultivating new types of tourism talents is assumed to be completed on schedule, with the cooperation of the relevant departments at all levels, and to carry out a series of work to ensure the successful completion of the task, such as the reform of the existing training methods of tourism talents, and the establishment of a new mode of training tourism talents. Figure 1 shows the “H”-type dual-line cultivation model.
According to the characteristics of the current situation of tourism talents, the cultivation mode of tourism talents adopts the “H” type of tourism talents two-line cultivation mode, this cultivation mode in the concept of dichotomy of talents, the scientific law to divide and cultivate different types of talents, to promote the balanced development of academic research talents and practical application talents of a new model. The “H” type tourism talent dual-line training model provides two tourism talent training channels, one to cultivate academic research talents, as shown on the left side of Figure 1, to guide the direction of potential tourism talents who aspire to be engaged in tourism-related scientific research, which can be accomplished through the general high school, general higher undergraduate education, master’s degree and doctoral degree education in tourism academic research, to become a tourism talent. education, which can accomplish the goal of this kind of tourism talents to become experts and scholars in the tourism industry. The other one is to cultivate practical and applied talents, as shown on the right side of Figure 1, which is the path planned for tourism talents engaged in applied tourism to perfect the theoretical knowledge of tourism specialties through continuing education and obtain higher education, and eventually become leaders in the industry. However, the two parallel cultivation paths can play the role of complementing and influencing each other through the exchange of experience, learning and communication, etc. At the same time, under the influence of external factors such as relevant policies (systems), structural adjustment of the tourism industry, etc., they will ultimately return to the same destination, delivering composite, open and innovative tourism talents to the tourism market.
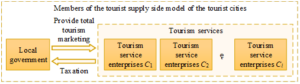
First of all, this chapter proposes to construct a tourism supply side in a broad sense, i.e., a tourism supply side model consisting of ethnic area marketing carried out by local government and tourism services provided by tourism service industry. Generally speaking, in a tourist ethnic area, the local government can invest a part of the tax revenue into ethnic area marketing, which will increase the visibility and reputation of the tourist ethnic area, thus attracting tourists to travel to the ethnic area to spend money, and all the tourist service enterprises in the district ethnic area are regarded as a whole, i.e., the tourist service industry, which is invested in the provision of tourist products and services for tourists, and the government’s ethnic area marketing helps the tourism service industry to increase revenue, and the local government as a source of marketing inputs in the ethnic areas by taxing the tourism service industry, in this way, forming a tourism supply-side circular system. In order to promote the input of tourism service industry, the local government can also contribute to the efforts of tourism service industry to improve the service quality by sharing the operating cost of tourism service industry, and the improvement of service quality will also increase the number of tourists and tourism consumption, thus increasing the tourism income of ethnic areas.
It should be noted that in this tourism supply side model, local governments and individual tourism service enterprises are node members of the supply side, and the members of the tourism supply chain model are shown in Figure 2. The overall interest of the tourism national region is the overall interest of this supply side, while the tourism service industry is an overall concept of the industry including several individual service enterprises, so the overall interest of the tourism service industry is not equivalent to the overall interest of this tourism supply side.
It is assumed that the policy variables of the local government include: marketing inputs and costs, the rate of taxation, a certain percentage of sharing the operating costs of the tourism services industry, and the management of the industry’s industrial organization of the tourism services industry in the tourism ethnic area. By virtue of its administrative power, the local government can adjust the number of enterprises providing tourism products and services in the tourism ethnic area, so that there can be two major types of industrial market structure scenarios of the tourism service industry: first, the local government can let the tourism service industry consist of a few, many or many enterprises, in which a large number of small and medium-sized enterprises can participate, that is, several enterprises decentralize the operation of tourism services in the tourism ethnic area. services. Secondly, the local government can also entrust a large commercial enterprise to unify the overall provision of tourism services in the tourism ethnic areas, that is, a large enterprise centralizes the operation of tourism services in the tourism ethnic areas, and then this large enterprise forms a second-tier entrusted agency relationship with a number of specific operators (merchants) providing tourism services, and this large and powerful enterprise can be a commercial enterprise, not necessarily an industrial enterprise. The large and powerful enterprise may be a commercial enterprise, not necessarily an industrial enterprise. In the following, the mechanism design is analyzed for each of the above scenarios, and the optimal mechanism symbols are described in Table 1.
| Symbol | Meaning |
|---|---|
| \(y\) | Tourist revenue in a tourist city |
| \(x_{g}\) | Local governments have a level of urban marketing input in a period, including all inputs and inputs for marketing (refers to propaganda). |
| \(x_{s}\) | The level of investment in a travel service in a period |
| \(c_{g}\) | The cost of urban marketing in local governments,including infrastructure investment |
| \(c_{s}\) | The cost of tourism services |
| \(TC_{g}\) | The assembly of the local government |
| \(TC_{s}\) | The assembly of the tourism service |
| \(t\) | Tax rates (including national tax rates and local tax rates) |
| \(t_{g}\) | Local government tax rates |
| \(t_{m}\) | National tax rate |
| \(\rho\) | The proportion of the operating costs of local governments in the tourism service industry |
| \(\pi _{g}\) | Local government profits |
| \(\prod _{}^{*}\) | The total maximum profit of the tourism supply chain |
| \(\pi\) | Profits of tourism services |
| \(\Theta\) | In every cycle, the tourism service is handing over a fixed income from local governments |
| \(P(Q)\) | The average price of tourism services |
| \(Q\) | Demand for travel services |
| \(q_{i}\) | The unit production of the first \(i\) tourism service enterprise; |
| \(C_{i} (q_{i} )\) | The cost of producing \(q_{i}\) units for the first \(i\) travel service; |
| \(\pi _{i}\) | The profits of the first \(i\) travel service; |
| \(\prod\) | The total profit of the tourism supply chain |
| \(s_{i}\) | The production share of the enterprise |
| \(\varepsilon\) | The demand price elasticity of the enterprise |
It is assumed that the tourism revenue of the tourist ethnic areas in a cycle is a function of the government’s marketing inputs in the ethnic areas and the inputs in the tourism service industry, and the relevant variables and functions are assumed as follows:
The tourism revenue of the tourist ethnic areas in one cycle is: \[\label{GrindEQ__1_} \begin{cases} y=f\left(x_{g} ,x_{s} \right),\\\frac{\partial f}{\partial x_{g} } >0,\\\frac{\partial f}{\partial x_{s} } >0,\\\frac{\partial ^{2} f}{\partial x^{2} } <0,\\\frac{\partial ^{2} f}{\partial x^{2} {}_{s} } <0,\end{cases}\tag{1}\] are strictly fitted concave functions, where \(x_{g} ,x_{s}\) is the level of inputs in one cycle for the local government and the tourism services industry, respectively. It is assumed that the levels of all the following variables occur in one cycle.
The total profit of the tourism ethnic area is: \[\label{GrindEQ__2_} \Pi =f\left(x_{g} ,x_{s} \right)-c_{g} \left(x_{g} \right)-c_{s} \left(x_{s} \right) .\tag{2}\] Among them \[\label{GrindEQ__3_} c_{g} \left(x_{g} \right),c_{s} \left(x_{s} \right)\tag{3}\] are the costs to local governments of marketing ethnic areas and tourism services, respectively.
Assumption \(f\left(x_{g} ,x_{s} \right)\) is a second-order continuously differentiable function that is strictly fitted concave. The total profit maximizes the first order condition: \[\label{GrindEQ__4_} \begin{cases} {\frac{\partial \Pi }{\partial x_{g} } } {=} {\frac{\partial f\left(x_{g} ,x_{s} \right)}{\partial x_{g} } -\frac{\partial c\left(x_{g} \right)}{\partial x_{g} } =0}, \\ {\frac{\partial \Pi }{\partial x_{s} } } {=} {\frac{\partial f\left(x_{g} ,x_{s} \right)}{\partial x_{s} } -\frac{\partial c\left(x_{s} \right)}{\partial x_{s} } =0}, \\ {\frac{\partial f\left(x_{g} ,x_{s} \right)}{\partial x_{g} } } {=} {\frac{\partial c\left(x_{g} \right)}{\partial x_{g} } } \\ {\partial f\left(x_{g} ,x_{s} \right)\partial x_{s} }.\end{cases}\tag{4}\] Assume that there exists an optimal solution, denoted as \(X^{*} =\left(x_{g}^{*} ,x_{s}^{*} \right)\).
Assume that the total profit of the tourism supply chain is the total profit of the tourism nation region, which is maximized: \[\label{GrindEQ__5_} \Pi ^{*} =f\left(x_{g}^{*} ,x_{s}^{*} \right)-c_{g} \left(x_{g}^{*} \right)-c_{s} \left(x_{s}^{*} \right) .\tag{5}\] In the case of independent decision-making by the local government and the tourism services industry, the total profit will generally be less than that total profit.
Assume that the tourism services industry makes independent decisions and the local government designs the mechanism so that the total profit is equal to the total profit.
Even if the tourism services industry makes independent decisions, there are different scenarios of whether the tourism services industry is centralized or decentralized.
This chapter proposes a mechanism design in which the local government pushes part of the costs of the tourism services industry. Let the total cost of the local government be:
\(TC_{g} \left(x_{g} ,x_{s} \right)\), the actual cost borne by the service sector is \(TC_{s} \left(x_{s} \right)\).
In the mechanism design, the local government can set \(x_{g} =x_{g}^{*}\) because the local government can decide its own ethnic area marketing inputs. When the local government sets the ethnic area marketing input, given the level of the local government’s ethnic area marketing input, the tourism service industry in the tourism ethnic area decides its input level. The local government is the first actor, and the service industry as the last actor can observe the result of the input decision of the first actor local government, which is a kind of Steinberg game.
Therefore, the game between local government and service industry in tourism ethnic areas is a Steinberg game.
First, observe the situation that the tourism service industry pursues profit maximization. The profit of the tourism service industry is: \[\label{GrindEQ__6_} \pi =(1-t)f\left(x_{g}^{*} ,x_{s} \right)-TC_{s} \left(x_{s} \right) ,\tag{6}\] where \(1>t>0\) is the tax rate (both the national tax rate and the local tax rate).
The optimization problem for tourism services is:
\[\label{GrindEQ__7_} \begin{cases} {\frac{\partial \pi }{\partial x_{s} } } {=} {(1-t)\frac{\partial f\left(x_{g}^{*} ,x_{s} \right)}{\partial x_{s} } -\frac{\partial TC_{s} \left(x_{s} \right)}{\partial x_{s} } =0}, \\ {\frac{\partial f\left(x_{s}^{*} ,x_{s} \right)}{\partial x_{s} } } {=} {\frac{\frac{\partial TC_{s} \left(x_{s} \right)}{\partial x_{s} } }{1-t} }. \end{cases}\tag{7}\] Comparing (4) and (7), it is clear that when \[\frac{\partial c\left(x_{s}^{*} \right)}{\partial x_{s} } =\frac{\frac{\partial TC_{s} \left(x_{s}^{*} \right)}{\partial x_{s} } }{1-t}\tag{7}\] exists (solution \(x_{s} =x_{s}^{*}\)), the total profit maximization situation can be realized.
If the proportion of the local government’s share of the operating costs of the tourism services industry is \(\rho\), then \(TC_{s} \left(x_{s} \right)=(1-\rho )c_{s} \left(x_{s} \right)\), at this point, when \(\rho =t\), \[\frac{\partial c\left(x_{s}^{*} \right)}{\partial x_{s} } =\frac{\frac{\partial TC_{s} \left(x_{s}^{*} \right)}{\partial x_{s} } }{1-t}\] holds.
Then the profit of the local government is: \[\begin{aligned} \label{GrindEQ__8_} {\pi _{g} } {=} {t_{g} f\left(x_{g}^{*} ,x_{s}^{*} \right)-c_{g} \left(x_{g}^{*} \right)-tc_{s} \left(x_{s}^{*} \right)} {=} {t_{g} \left[f\left(x_{g}^{*} ,x_{s}^{*} \right)-c_{s} \left(x_{s}^{*} \right)\right]-c_{g} \left(x_{g}^{*} \right)-t_{m} c_{s} \left(x_{s}^{*} \right)}, \end{aligned}\tag{8}\] where \(t_{s} ,t_{m}\) is the local government tax rate and the state tax rate, respectively. \[\label{GrindEQ__9_} t_{g} +t_{m} =1 .\tag{9}\] Hypothesis \(\Pi ^{*} >0\), i.e., only the case where the total maximum profit of the tourism supply chain is greater than zero is studied; otherwise, if this total maximum profit is all less than or equal to zero, it means that the ethnic region does not have sufficient tourism resources to attract tourists, and is not a tourism ethnic region, not the hypothetical case studied in this chapter.
The profit of the tourism service industry is: \[ \label{GrindEQ__10_} {\pi } {=} {(1-t)\left[f\left(x_{g}^{*} ,x_{s}^{*} \right)-c_{s} \left(x_{s}^{*} \right)\right]} >{(1-t)\left[f\left(x_{g}^{*} ,x_{s}^{*} \right)-c_{g} \left(x_{g}^{*} \right)-c_{s} \left(x_{s}^{*} \right)\right]} {=} {(1-t)\Pi ^{*} >0.} \tag{10}\] According to (8), the local government’s profit is not necessarily greater than zero. Therefore, under this mechanism design, it is possible for local governments to incur losses, making the optimal mechanism design unsustainable. Assume that in each cycle, the tourism service industry turns over a fixed revenue \(\Theta ,(1-t)\Pi >\Theta \ge 0\) to the local government, which satisfies: \[\label{GrindEQ__11_} \begin{cases} {(1-t)\Pi >\Theta \ge 0}, \\ {\pi _{g} +\Theta \ge 0.} \end{cases}\tag{11}\] Eq. (11) is equivalent to the requirement: \[ \label{GrindEQ__12_} (1-t)\left[f\left(x_{g}^{*} ,x_{s}^{*} \right)-c_{g} \left(x_{s}^{*} \right)-c_{s} \left(x_{s}^{*} \right)\right]>\Theta \ge -\left[t_{g} f\left(x_{g}^{*} ,x_{s}^{*} \right)-c_{g} \left(x_{s}^{*} \right)-tc_{s} \left(x_{s}^{*} \right)\right]. \tag{12}\] A sufficiently necessary condition for the existence of such a fixed income as surrender is: \[ \label{GrindEQ__13_} \left(1-t\right)\left[f\left(x_{g}^{*} ,x_{s}^{*} \right)-c_{g} \left(x_{g}^{*} \right)-c_{s} \left(x_{s}^{*} \right)\right] >-\left[t_{g} f\left(x_{g}^{*} ,x_{s}^{*} \right)-c_{g} \left(x_{g}^{*} \right)-tc_{s} \left(x_{s}^{*} \right)\right] . \tag{13}\] Eq. (13) is equivalent to: \[ \label{GrindEQ__14_} {\left(1-t_{m} \right)\left[f\left(x_{sg}^{*} ,x_{s}^{*} \right)-c_{s} \left(x_{s}^{*} \right)\right]}{+\left(t_{g} +t_{m} \right)c_{g} \left(x_{g}^{*} \right)+\left(2t_{g} +t_{m} \right)c_{s} \left(x_{s}^{*} \right)} {>\left(1-t_{m} \right)\Pi +\left(t_{g} +t_{m} \right)c_{g} \left(x_{g}^{*} \right)+\left(2t_{g} +t_{m} \right)c_{s} \left(x_{s}^{*} \right)}{>0.} \tag{14}\] Therefore (13) holds naturally.
\(\Theta\) satisfy (12), the profit of the tourism services industry is: \[\label{GrindEQ__15_} \pi =(1-t)f\left(x_{g}^{*} ,x_{s} \right)-TC_{s} \left(x_{s} \right)-\Theta >0 .\tag{15}\] And (7) still holds, the total profit maximization can be achieved, and the local government’s ethnic area marketing can get a positive profit, or at least will not lose money, and the ethnic area marketing can be sustained.
Figure 3 shows the optimal mechanism design of local government and tourism service industry industrial organization and management, so if the tourism service industry is pursuing profit maximization, the total profit maximization of tourism ethnic area can be achieved under this mechanism design.

In order to further validate the assignment of each parameter in this section, the model is numerically simulated using MATLAB software. Combining the relationship between each parameter and the assumed conditions, the trend curves of the tourist attractions, travel agencies, and the overall revenue of the supply side over time under three conditions are plotted, as shown in Figure 3, which shows that Figure 3(a) is the optimal revenue of the tourist places in the ethnic areas under different conditions, Figure 3(b) is the optimal revenue of the travel agencies under different conditions, Figure 3(c) is the optimal revenue of the supply side as a whole under different conditions, Figure 3(d) is the optimal revenue of the when the government intervenes and the tourist attractions and travel agencies adopt the cost-sharing mechanism.
As can be seen from Figure 3(a) and Figure 3(b), the tourist places in ethnic areas have the highest revenue under the condition of no government intervention and adopting synergistic cooperation contract with travel agencies, which stably stays at 12,000 yuan after 20 days of implementation, and the travel agencies also have the highest revenue in the previous period, and the revenue is raised from 6,000 yuan to 8,000 yuan in less than 20 days. However, since this contract is too ideal and difficult to realize, it is only used as a theoretical reference. As can be seen from Figure 3, when the government participates in the supply side as a leader and the tourist attractions and travel agencies adopt the cost-sharing cooperation contract, the government, the travel agency and the supply side of the overall revenue are maximized, and the tourist attractions also achieve the optimal revenue under the condition when the synergistic cooperation contract is not considered. Under three different conditions, the advance of the three parties of the national tourist attractions, the government and the tourism enterprises has been stabilized, and the supply side will eventually achieve the virtuous cycle of stable operation.
Finally explore the impact of tourism talent resources on tourism supply side earnings, \(\alpha\) between 0.2 \(\mathrm{\sim}\) 0.9 in 0.1 as a step uniformly take the value of the earnings of all parties affected by it, tourism talent resources on the supply side of tourism to improve the earnings of the positive impact, with the increase of \(\alpha\), the government, tourist attractions, the earnings of the Government have increased, the supply side of the overall earnings of the greatest impact, the earnings curve in the range of 0.2 to 0.9 from 20000 to 65000 rapidly, indicating that the investment of tourism talent resources can promote the development of tourism.

On the basis of existing relevant studies, this paper proposes a research and analysis framework as shown in Figure 4. Common affluence is the material affluence of a generally improved standard of living, a significant reduction in the income gap, and more equalization of basic public services, as well as the spiritual affluence of continuous spiritual and cultural abundance, and is a collection of developmentality, commonality, sharing, and sustainability. Development represents the degree of regional economic development or affluence. Commonality is the characterization of income disparity and the embodiment of fairness in income distribution. Sharedness is a characterization of the equalization of basic public services and spiritual and cultural affluence, interpreting the extent to which the fruits of economic and social development are shared by all. Sustainability emphasizes the intergenerational equity of common wealth and its adaptability to socio-economic development. With the continuous promotion of the construction of a strong tourism country, tourism has become an important way to promote the realization of common wealth.

Table 2 shows the evaluation system of tourism development and common wealth indicators.
(1) Core explanatory variables: tourism development level, using absolute income and relative income to evaluate the development level of tourism.
(2) Interpreted variables: from the four aspects of development, commonality, sharing and sustainability, to jointly evaluate the common prosperity effect brought by tourism in ethnic areas.
| Target layer | Criterion layer | Index layer |
|---|---|---|
| Tourism development \(TD\) | Absolute income \(AI\) | Tourism revenue (domestic travel income and inbound tourism income) |
| Relative income \(RI\) | The level of tourism development (tourism total GDP) | |
| Common prosperity \(CP\) | Development \(DE\) | The per capita disposable income of urban residents |
| The per capita disposable income of rural residents | ||
| The balance of the loan of the financial institutions at the end of the year | ||
| Total retail sales of consumer goods per capita | ||
| Communality \(CO\) | Urban development differences | |
| Urban and rural development differences | ||
| Sharing \(SH\) | Every hundred people public library reserves | |
| Every thousand medical institutions | ||
| The number of Internet broadband users per 100 people | ||
| Education value (education spending is the proportion of financial expenditure) | ||
| Technology importance (science and technology spending is the proportion of financial expenditure) | ||
| Sustainability \(SU\) | Per capita GDP | |
| Fiscal revenue accounts for GDP | ||
| The balance of the end of the year per capita | ||
| Urban registration unemployment | ||
| \({\rm PM}_{2.5}\)Average concentration |
In order to reduce the bias caused by subjective evaluation, this paper adopts the entropy value method to measure the level of tourism development and common wealth, the specific formula is as follows: \[\label{GrindEQ__16_} \begin{cases} {Y_{tij} =\frac{X_{tij} -X_{j\min } }{X_{j\max } -X_{j\min } } +10^{-5} {\rm (\text{Positive indicators}),}} \\ {Y_{tij} =\frac{X_{j\max } -X_{tij} }{X_{j\max } -X_{j\min } } +10^{-5} {\rm (\text{Negative indicators}).}} \end{cases}\tag{16}\] \[\label{GrindEQ__17_} P_{tij} ={Y_{tij} \mathord{\left/ {\vphantom {Y_{tij} \sum _{t=1}^{m}\sum _{i=1}^{n}Y_{tij} }} \right. } \sum _{t=1}^{m}\sum _{i=1}^{n}Y_{tij} } .\tag{17}\] \[\label{GrindEQ__18_} E_{j} =-k\sum _{t=1}^{m}\sum _{i=1}^{n}P_{tij} \ln P_{tij} ,\;\;\;\;\;\;\;\;k=1/\ln (mn).\tag{18}\] \[\label{GrindEQ__19_} G_{j} =1-E_{j} .\tag{19}\] \[\label{GrindEQ__20_} W_{j} ={G_{j} \mathord{\left/ {\vphantom {G_{j} \sum _{j=1}^{n}G_{j} }} \right. } \sum _{j=1}^{n}G_{j} } .\tag{20}\] \[\label{GrindEQ__21_} U_{ti} =\sum _{j=1}^{n}\left(W_{j} \times Y_{tij} \right).\tag{21}\]
Bivariate spatial autocorrelation is suitable for characterizing the spatial association and dependence between two geographic elements. In this paper, univariate global spatial autocorrelation is used to characterize the spatial agglomeration of tourism development and common wealth, and on the basis of this, bivariate global and local spatial autocorrelation is used to explore the spatial correlation and dependence characteristics of the two.
The expression of bivariate global spatial autocorrelation is: \[\label{GrindEQ__22_} I=\frac{\sum _{i=1}^{n}\sum _{j=1}^{n}w_{ij} \left(x_{i} -\bar{x}\right)\left(y_{j} -\bar{y}\right)}{s^{2} \sum _{i=1}^{n}\sum _{j=1}^{n}w_{ij} }\tag{22}\]
where: \(n\) is the 262 units of ethnic minority areas studied, \(x_{i}\) and \(y_{j}\) represent the tourism development level of ethnic area \(i\) and the level of common prosperity of ethnic area \(j\), respectively, \(w_{ij}\) represents the spatial adjacency weight matrix, that is, the geographical contiguous ethnic areas are set to 1, the non-contiguous ethnic areas are set to 0, \(s^{2}\) is the sample variance, \(I\) is the bivariate global spatial autocorrelation coefficient, and the value interval is [-1,1], [-1,0] represents the tourism development and ethnic areas of ethnic area \(i\) The common prosperity level of \(j\) is negatively correlated, which means that 0 is spatially uncorrelated, and (0,1) is positively correlated.
The expression for bivariate local spatial autocorrelation is: \[\label{GrindEQ__23_} I_{i} =z_{i}^{x} \sum _{j=1}^{n}w_{ij} z_{j}^{y},\tag{23}\] where \(z_{i}^{x} ,z_{j}^{y}\) denotes the variance normalized value of tourism development level of ethnic region \(i\) and common wealth level of ethnic region \(j\) respectively, \(I_{i}\) is the local correlation between tourism development level of ethnic region \(i\) and common wealth level of its neighboring ethnic regions, and there are a total of H-H (High-High), L-L (Low-Low), H-L (High-Low) and L-H (Low-High) four types of agglomeration. Low-High) four types of agglomeration. Among them, H-H type agglomeration indicates that both tourism development in ethnic areas and common wealth of neighboring ethnic areas are high, L-L type agglomeration indicates that both tourism development in ethnic areas and common wealth of neighboring ethnic areas are low, H-L type agglomeration indicates that tourism development in ethnic areas is high while the common wealth of neighboring ethnic areas is low, and L-H type agglomeration indicates that ethnic areas have a tourism development level is low, while the common wealth level of neighboring ethnic areas is high.
with affluence to reveal possible spatial spillover effects. The spatial panel Durbin model is: \[\label{GrindEQ__24_} Y_{it} =\beta X_{it} +\rho \sum _{j=1}^{n}W_{ij} Y_{jt} +\gamma \sum _{j=1}^{n}W_{ij} X_{jt} +\mu _{i} +\sigma _{t} +\varepsilon _{it} ,\tag{24}\] where \(Y_{ij}\) and \(Y_{jt}\) are the observations of the explanatory variables in region \(i,j\), \(X_{it}\) and \(X_{jt}\) are the observations of the explanatory variables in regions \(i\) and \(j\), \(W_{ij}\) is the spatial weight matrix, \(\beta\) is the vector of surrogate estimation parameters of the explanatory variables, \(\rho\) is the spatial lag coefficient of the explanatory variables, \(\gamma\) is the spatial regression coefficient of the explanatory variables, \(\mu _{i}\) and \(\sigma _{i}\) represent the spatial and temporal effects, and \(\varepsilon _{ii}\) is the random disturbance term. When \(\gamma =0\) and \(\rho \ne 0\), Eq. (24) is the spatial lag model (SPLM) and when \(\gamma +\rho \beta =0\), Eq. (24) is the spatial error model (SPEM).
Spatial autocorrelation analysis is a prerequisite for the analysis of factors influencing the spatial heterogeneity of common affluence in ethnic areas. In view of this, this study takes the ethnic areas of province J as the research unit, and adopts the global Moran’s index to identify the spatial correlation characteristics of the combined level of common affluence and the affluence level of each sub-system in the ethnic areas. Figure 5 shows the global Moran’s I values of common affluence in ethnic areas, and the Moran’s I indices of total affluence and subsystem affluence are all positive, and the distribution of Moran’s coefficients of the five indicators ranges from 0.1256 to 0.9456, and the Z-value is greater than 1.58, and the P-value is less than or equal to 0.05.

In order to deeply reveal the mechanism of the impact of tourism development on common affluence in ethnic areas, this study empirically analyzes it using the cross-sectional spatial Durbin model. Table 3 reports the regression results of tourism development affecting total affluence and the affluence of each subsystem.
The measurement results show that the estimated coefficient of tourism development level is positive, but fails the significance test at the 10% level, indicating that tourism development in ethnic areas does not contribute significantly to total affluence. The potential reason for this is that the tourism industry has suffered heavily under the impact of the new crown epidemic, which has led to tens of thousands of tourism enterprises on the verge of closure and practitioners in the plight of unemployment. The recovery of tourism industry needs to go through a difficult and long process. In addition, tourism is a relatively marginal industry in the industrial economy of Province J. The tourism economy accounts for a relatively small proportion of the total economy in most ethnic areas, and the contribution of tourism development to the total affluence is still very limited. The spatial lag coefficient of tourism development level is significantly positive at the 10% level, but the coefficient is relatively small at 0.001, indicating that tourism development has a certain spatial spillover effect on the increase of total affluence in neighboring ethnic areas. As far as the control variables are concerned, the regression coefficients of urbanization rate, digital inclusive finance, industrial structure rationalization, and infrastructure level are significantly negative, respectively -0.029, -0.018, -0.156, and -0.169, which indicates that the excessive intervention of the government of the ethnic regions in the market economy is an important factor hindering the improvement of the overall affluence. The regression coefficients of the level of opening to the outside world and the advanced industrial structure are significantly positive, respectively 0.029 and 0.123, indicating that the higher level of opening to the outside world and the more advanced industrial structure of the ethnic areas in province J are conducive to the improvement of the total affluence.
The spatial lag coefficient of developability is greater than 0 and passes the significance test at the 1% level, indicating that there is a significant spatial clustering effect of developability. The impact coefficient of tourism development level is less than 0, -0.048, but does not pass the significance test at the 10% level, indicating that tourism development under the epidemic negatively affects the developmental nature of common wealth. The current tourism industry in province J is still seriously unbalanced in the level of development between ethnic regions and between tourism segments, which to some extent is not conducive to the common prosperity of the economy between ethnic regions. The spatial lag coefficient of tourism development level is not significantly positive, indicating that tourism development does not have a significant impact on the common wealth developability of ethnic regions. This may be due to the limited size of the tourism market in ethnic regions, which has little impact on the economic growth of neighboring ethnic regions. There may be spillover effects between high-level regions, which are small and insignificant in small neighboring regions. As far as the control variables are concerned, the direction of influence of all variables is consistent with the total common wealth.
From the regression results, the estimated coefficient of the level of tourism development is less than 0, -0.068 does not pass the significance test at the 10% level, indicating that the impact of tourism development on the degree of common affluence is insignificantly negative, and the potential reasons include: First, tourism development may lead to the income differentiation of the residents of the tourist areas, unfair distribution of benefits, and the increase in the rate of tourism crime and other problems, which negatively affects the common affluence to a certain extent. The spatial lag coefficient of tourism development level is not significantly positive, indicating that the spatial spillover effect of tourism development in ethnic regions on the common affluence of neighboring regions is not obvious.
The estimated coefficient and spatial lag coefficient of tourism development level are 0.198 and 0.058, respectively, and all of them pass the significance test at the 1% level, indicating that the tourism development of ethnic areas has a positive impact on the shared affluence degree of the region in the environmental dimension, and also has a significant positive spatial spillover effect on the shared affluence degree of the neighboring ethnic areas, which is inseparable from the fact that Province J has been practicing the development concept of “green water and green mountains are the golden mountains”. This is closely related to the fact that Province J has been practicing the development concept of “green water and green mountains are golden silver mountains”.
The estimated coefficient of tourism development level is 0.265 and passes the significance test at 1% level, which indicates that tourism development can improve the sustainable affluence.
| / | \(CP\)(1) | \(DE\)(2) | \(CO\)(3) | \(SH\)(4) | \(SU\)(5) |
|---|---|---|---|---|---|
| Tourism development level | 0.019 | -0.048 | -0.068 | 0.198** | 0.265*** |
| (0.035) | (0.068) | (0.055) | (0.069) | (0.075) | |
| Urbanization rate | -0.029** | -0.039*** | 0.087 | 0.085*** | 0.068 |
| (0.018) | (0.028) | (0.019) | (0.037) | (0.065) | |
| Open level | 0.029** | 0.059*** | -0.055** | -0.006 | -0.026 |
| (0.016) | (0.018) | (0.026) | (0.036) | (0.048) | |
| Digital HP finance | -0.018 | -0.698*** | -0.028 | 0.796 | -0.008 |
| (0.032) | (0.268) | (0.019) | (0.597) | (0.026) | |
| Rationalization of industrial structure | -0.156*** | 0.198*** | -0.678*** | 0.125 | -0.152 |
| (0.168) | (0.068) | (0.269) | (0.168) | (0.465) | |
| Industrial structure height | 0.123*** | 0.165** | 0.465*** | 0.569*** | 0.485*** |
| (0.038) | (0.068) | (0.096) | (0.165) | (0.126) | |
| Infrastructure level | -0.169*** | -0.158** | -0.569*** | 0.678*** | -0.678*** |
| (0.079) | (0.059) | (0.068) | (0.168) | (0.125) | |
| W* Tourism development level | 0.001* | 0.001 | 0.002 | 0.058*** | -0.005 |
| (0.000) | (0.000) | (0.000) | (0.165) | (0.000) | |
| W* Urbanization rate | 0.001 | 0.001 | 0.015** | 0.005*** | -0.002 |
| (0.000) | (0.000) | (0.000) | (0.000) | (0.000) | |
| W* Open level | 0.002 | -0.001 | -0.001*** | 0.002 | -0.001*** |
| (0.000) | (0.000) | (0.000) | (0.001) | (0.001) | |
| W* Digital HP finance | 0.001 | 0.001 | -0.001 | -0.005 | 0.001*** |
| (0.000) | (0.000) | (0.000) | (0.005) | (0.001) | |
| W* Rationalization of industrial structure | -0.001* | -0.002*** | 0.001 | 0.001 | -0.004*** |
| (0.001) | (0.001) | (0.000) | (0.001) | (0.002) | |
| W* Industrial structure height | 0.001 | 0.002 | -0.001*** | -0.002 | -0.002 |
| (0.000) | (0.001) | (0.001) | (0.001) | (0.000) | |
| W* Infrastructure level | -0.002*** | -0.001*** | -0.001*** | -0.004*** | -0.001 |
| (0.000) | (0.001) | (0.000) | (0.000) | (0.002) | |
| \(Rho\) | 0.001 | 0.001*** | -0.001 | 0.001 | -0.002 |
| (0.000) | (0.000) | (0.000) | (0.000) | (0.000) | |
| \(sigma\) | 0.048*** | 0.045*** | 0.069*** | 0.168*** | 0.078*** |
| (0.002) | (0.005) | (0.003) | (0.015) | (0.005) | |
| \(LM-lag\) | 623.785*** | 384.787*** | 36.364*** | 136.785*** | 23.485*** |
| \(RobustLM-lag\) | 2468.495*** | 8634.487*** | 42.687*** | 659.488*** | 38.654*** |
| \(LM-error\) | 267.985*** | 642.654*** | 1.985* | 86.785*** | 1.978 |
| \(RobustLM-error\) | 2036.98*** | 8656.154*** | 6.798*** | 647.596*** | 16.785*** |
| \(LRTest\) | 68.964*** | 133.657*** | 29.654*** | 65.636*** | 21.369*** |
| \(N\) | 50 | 50 | 50 | 50 | 50 |
| \(R^{2}\) | 0.935 | 0.978 | 0.965 | 0.943 | 0.795 |
In order to test the robustness of the above regression results, this study takes the ratio of total tourist reception to resident population as a proxy variable for the level of tourism development, and analyzes the spatial impact of tourism development on the degree of common affluence, and the results are shown in Table 4. The impact estimates and spatial spillover effects of the tourism development level on the total affluence and the affluence of each subsystem are consistent with Table 3, and the variables that are negative in the impact estimates in Table 3 are developmental and common, with the values of -0.048 and -0.068, respectively, and similarly, these two values are negative in Table 4, with the values of -0.002 and -0.025, and the lag in Table 3 is negative only for sustainability and the value is -0.005, and the lag value of sustainability common wealth in Table 4 is -0.02, which indicates that the regression results of this study are robust.
| / | \(CP\)(6) | \(DE\)(7) | \(CO\)(8) | \(SH\)(9) | \(SU\)(10) |
|---|---|---|---|---|---|
| Tourism development level | 0.001 | -0.002 | -0.025** | 0.003** | 0.003*** |
| (0.000) | (0.002) | (0.000) | (0.001) | (0.005) | |
| W* Tourism development level | 0.0002** | 0.0001** | 0.0001 | 0.0001** | -0.002 |
| (0.0002) | (0.0001) | (0.0000) | (0.0001) | (0.001) | |
| Control variable | YES | YES | YES | YES | YES |
| \(Rho\) | 0.0003 | 0.003*** | -0.002 | 0.002* | -0.005 |
| (0.000) | (0.000) | (0.000) | (0.000) | (0.000) | |
| \(sigma\) | 0.025*** | 0.037*** | 0.054*** | 0.198*** | -0.097*** |
| (0.025) | (0.002) | (0.003) | (0.026) | (0.007) | |
| \(LM-lag\) | 645.354*** | 348.648*** | 35.678*** | 164.784*** | 25.697*** |
| \(RobustLM-lag\) | 2463.158*** | 13245*** | 46.568*** | 946.657*** | 37.544*** |
| \(LM-error\) | 234.578*** | 647.325*** | 0.267 | 167.598*** | 0.594 |
| \(RobustLM-error\) | 1978.658*** | 16547*** | 6.365*** | 948.358*** | 18.964*** |
| \(LRTest\) | 116.465*** | 137.985*** | 29.645*** | 56.985*** | 50.648*** |
| \(N\) | 50 | 50 | 50 | 50 | 50 |
| \(R^{2}\) | 0.798 | 0.569 | 0.978 | 0.941 | 0.745 |
Note: the numerical value of the brackets is the standard deviation.p<. 0.01 * indicates p0.05 * indicates p0.01.
In this paper, the tourism talent resources are sorted out, the supply side reform strategy of tourism talent resources is proposed, based on the Stackellberg game model, the tourism supply side model is designed, and the optimal analysis of the tourism supply side benefits is made. For the role of tourism talent resources supply-side reform on common wealth, it is empirically analyzed through entropy value method, bivariate spatial autocorrelation and spatial panel Durbin model. The influence coefficient of tourism talent resources on tourism supply-side gains ranges from 0.2 to 0.9, and the gains of the government as well as the tourist attractions have the greatest influence on the overall gains of the supply side, which is rapidly increased from 20,000 to 65,000 yuan. The empirical analysis of the region of province J shows that the distribution of Moran’s coefficient of the five indicators ranges from 0.1256 to 0.9456, and the Z-value is greater than 1.58, and the P-value is less than 0.05, which is a significant difference. In the regression analysis of the Durbin model, the level of tourism development has certain spatial spillover effects on the total affluence of adjacent ethnic regions, in which the regression coefficients of the level of opening up to the outside world and the advanced industrial structure are positive, respectively 0.029 and 0.123, which are conducive to the improvement of the total affluence level. In the robustness regression, the values of developmental and commonality are -0.002 and -0.025 respectively, which are consistent with the results of Durbin’s regression, indicating that the results of the regression analysis have strong robustness.
For the universality and applicability of the research, the scope of the research should also expand the geographical scope and the number of people. In terms of research perspective, this paper lacks the international comparative study of tourist talent resources. Therefore, this study is only the beginning of the research of the researchers, and it will also need to provide more valuable information for the tourism industry by comparing the resources management and policy application of tourism talents in different countries.
This research was supported by the Stage achievement of Tianjin Art and Science Planning Project “In-depth Integration of Cultural Tourism in Tianjin” (A18034).


