Since the implementation of China’s reform and opening-up policies, the tourism industry has undergone rapid development, garnering global attention [1]. Over the past three decades, these policies have not only laid a robust foundation for tourism but have also significantly improved tourism infrastructure, including transportation, energy, and communication systems. Consequently, tourism service facilities, product systems, destination networks, and human resource development have become more solidified, underpinning the industry’s growth. Notably, the anticipated rise in China’s residents’ income and consumption levels points to a promising future for the tourism industry, suggesting that it will sustain a favorable growth trajectory [2-4].
While China’s tourism industry demonstrates a favorable development pattern and trend on a macro scale, its micro-level development is not as optimistic [5]. This is evident in the challenges faced by some tourism enterprises, including a declining tourist source market, weak competitiveness, and low investment efficiency [6]. This underscores the fact that, despite the rapid expansion of China’s tourism industry, the initial product management strategies have fallen short in catering to tourists’ escalating demands for high-quality tourism experiences and in addressing the entrenched issues in the tourism development process [7].
Currently, “smart tourism,” synonymously referred to as intelligent tourism, encompasses the integration of Internet of Things, high-performance information processing, cloud computing, and intelligent data mining technologies within the tourism sector. This integration facilitates the harmonious blending of material resources (such as tourist attractions and accommodations) and information resources, thereby revolutionizing the traditional tourism model. This new form of tourism, which primarily relies on converged communications, centers around the interactive experiences between tourism enterprises and visitors. It aims to propel the innovative growth of the tourism industry in tandem with advancements in information technology [8-9].Tourism informatization, to a significant extent, caters to tourists’ personalized consumption needs, offering them unparalleled, high-quality service experiences. Additionally, it contributes to the cultivation of a humanistic, technological, and intelligent image for tourist attractions. The construction of intelligent tourism serves as a guiding strategy for elevating the level of tourism informatization, while simultaneously emphasizing the paramount importance of such endeavors [10,11].
As a central component and vital aspect of the modern tourism industry, the development of tourist attractions relies heavily on the planning, development, and enhancement of tourist products by attraction enterprises, coupled with the pursuit of high-quality products to secure a larger market share. Furthermore, the success of these attractions is increasingly contingent on the scientific and efficient management practices employed by these enterprises, aiming to achieve favorable market returns [12]. Bu, N. et al. compiled research papers that delve into the application of AI technology in tourism services, exploring its future advancements, diverse application forms, and potential scenarios. This compilation offers fresh insights and valuable references for stakeholders across the tourism industry’s value chain [13].
Filieri, R. et al. [14] have expounded that the tourism industry stands to gain substantially from the research and development efforts directed towards AI technology. Furthermore, an analysis of the European AI technology startup database reveals that these startups are predominantly located in major tourist hubs across Europe, with their operations centered on pre- and post-travel services. Kirtil, S. G. et al. [15] have conducted a comprehensive review of the existing literature on the application of AI technology in tourism, anticipating the various integration forms of AI within the tourism industry and forecasting potential future trends and hotspots for AI in this sector. Chi, O. H. et al. [16] have investigated the perceptions and attitudes held by tourism groups towards the incorporation of AI technology in tourism services, discovering a nuanced stance wherein the application of AI is generally deemed acceptable but encounters greater resistance in the context of hedonic services. Zhang, X. et al. [17] utilizing both questionnaire surveys and interviews, have highlighted the significant influence of perceptual elements, both dynamic and static, on the image of tourist attractions.
In the information age, the profound application of Internet information technology is transforming the traditional tourism supply chain, resulting in alterations to its organizational structure. This evolution has ushered in smart tourism as an emerging industry. Smart tourism, fueled by artificial intelligence, significantly enhances the quality of tourism services, fosters innovative management approaches, and enriches the tourism experience. It empowers tourists to proactively access tourism-related information and adjust their travel plans, thereby facilitating the sharing of tourism information resources. As a comprehensive platform for scenic tourism public services, the development of smart tourism infrastructure contributes to the sustainable development of China’s tourist attractions. Ivanov, S., et al. [18] conducted a critical assessment of the utilization of artificially intelligent robots in the tourism service sector, examining it from three distinct angles: tourism service delivery, tourists’ demands, and tourist attractions. Their analysis offers valuable reference points and insights into the economic implications of robotic tourism. Ribeiro, M. A. et al. [19] conducted an analysis of the hedonic motivation of tourists, identifying it as a pivotal factor in the positive psychology associated with travelers’ experiences. Their findings indicated that the target group and the concept of self-driving cars are fundamentally aligned with the profile of contemporary travelers. Giotis, G. et al. underscored the significance of the concept of innovation within the tourism industry, asserting that both technological and managerial innovations play a crucial role in enhancing the competitiveness of tourism enterprises. Furthermore, they highlighted the potential of artificial intelligence, information technology, and other related technologies employed in tourism services and operations to effectively elevate tourist experiences and satisfaction levels [20]. Bose, S. et al. [21] through a case analysis, emphasized the importance of local city branding, emphasizing that the unique cultural identity and value proposition embedded in a local brand image can significantly attract tourist groups and foster tourism investment.
To establish the image of leisure tourism destinations, this study initially conceptualizes the data collection framework and pinpoints the pertinent sample data sources. Subsequently, a structured process is proposed, entailing the transition from individual words to overarching topics, ultimately culminating in the generation of cohesive textual content. This is achieved through the application of topic mining techniques on leisure tourism destination review texts, utilizing an LDA model grounded in Bayesian modeling principles. Furthermore, an enhanced neural network language model, specifically CBOW, alongside the Glove model, is employed to train six-dimensional word vectors derived from leisure travel destination textual reviews. These trained word vectors, varying in dimensionality, serve as the foundational input for subsequent modeling endeavors. Ultimately, a deep, fully connected neural network model is leveraged to delve into and analyze the emotional underpinnings of tourist destination imagery.
According to the background of the selected topic and the content of the study, the data required for the study of this paper are collected, and the idea of data collection is shown in Figure 1 below:
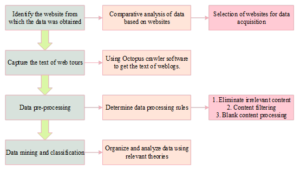
A network travelogue is a textual account in which travelers document their encounters, including sights, contents, itineraries, and experiences, shaped by their individual perspectives, cultural backgrounds, and emotional responses to travel. The primary platforms for disseminating these travelogues encompass online travel websites, forums, and various user-generated content (UGC)-centric portals. Amidst the internet-fueled proliferation of online tourism, these websites have amassed substantial user bases and traffic, which not only facilitates targeted outreach to backend online travel agencies (OTAs) or other travel service providers but also aids frontend tourism consumers in making informed decisions. Consequently, in this study, our focus on exploring the image perception of tourist destinations necessitates the selection of websites that possess significant domestic influence, a robust user base, and abundant UGC data as the primary sources for our sample data. After meticulous consideration of prominent websites and aligning them with the research objectives of this paper, Ctrip.com and MaHoneycomb were identified as the definitive sources for the sample data utilized in this research.
The traditional and widely employed text analysis technique, as discussed in the preceding section, involves the preliminary approach of word frequency counting. This method provides insights into the significance of a word by assessing its frequency of occurrence across the entire document. Nevertheless, a notable limitation lies in the fact that this statistical method solely relies on frequency counts, thereby neglecting a wealth of contextual information. To address this shortcoming, theme modeling emerges as a viable solution, capable of capturing and modeling the latent themes embedded within the text.
In this paper, the topic mining of leisure travel destination review texts uses the LDA (Latent Dirichlet Allocation) model, which assumes a process from words to topics to a text generation.
Hence, when crafting an article pertaining to tourist attractions, it is imperative to initially and randomly select a particular topic, which could encompass themes such as “food” or “beauty,” with the likelihood of “beauty” being randomly chosen potentially surpassing that of “food.” Following this selection, words pertinent to the chosen theme of “beauty” are randomly sampled, and this process of theme and word selection is iteratively repeated to produce a review text centered on the tourist attraction. Eq. (1) delineates the probability of generating a specific word within the context of the document. \[\label{GrindEQ__1_} {p\left(\text{Word}\left|\text{Documentation}\right. \right)} = {\sum_{\text{Subject}}p\left(\text{Word}\left|\text{Documentation}\right. \right) }.\tag{1}\]
Description of the LDA process: Suppose there is a total of \(M\) article, these articles are related to a total of \(K\) topics. Each article has its own topic distribution, the topic distribution is also a multinomial distribution with Dirichlet distribution parameters, and the parameter of the Dirichlet distribution is \(\alpha\). Each topic has its own word distribution, the word distribution is also a multinomial distribution with Dirichlet distribution parameters, and the parameter of the Dirichlet distribution is \(\eta\). For the \(n\)th word in an article, first randomly select a topic from the topic distribution of the article, and then randomly select a word under this topic, and repeat this process until all \(M\) articles are completed.
Theoretical explanation of LDA: LDA is based on the Bayesian model, which depends on the prior distribution, posterior distribution, and the data, the prior distribution and the data (likelihood) corresponding to the binomial distribution after the collection of the posterior distribution obtained in the back can be used as a prior distribution, such a distribution is known as the conjugate distribution. And the multinomial distribution and Dirichlet distribution also satisfy the conjugate relationship can be obtained: \[\label{GrindEQ__2_} \text{Dirichlet}\left(\vec{p}\left|\vec{\alpha }\right. \right)+\text{MultiCount}\left(\vec{m}\right)=\text{Dirichlet}\left(\vec{p}\left|\vec{\alpha }+\vec{m}\right. \right) .\tag{2}\]
LDA is of the form that there is currently \(M\) document, corresponding to a total of \(N_{d}\) words in the \(d\)nd document. And the goal is to find the topic distribution for each document and each topic-word distribution. And first of all it is necessary to first assume a topic number \(K\), so that all the distributions are obtained depending on these \(K\) topics.
The model assumes that the prior distribution of document topics is a Dirichlet distribution, i.e., for any one document \(d\) the topic distribution \(\theta _{d}\) is: \[\label{GrindEQ__3_} \theta _{d} =\text{Dirichlet}\left(\vec{\alpha }\right) ,\tag{3}\] where \(\alpha\) is a hyperparameter and the subject-word prior distribution is assumed to be a Dirichlet distribution, i.e., for subject \(k\), the word distribution \(\beta _{k}\) is: \[\label{GrindEQ__4_} \beta _{k} =\text{Dirichlet}\left(\vec{\eta }\right) ,\tag{4}\] where \(\eta\) is a hyperparameter, for the \(n\)rd word in any document \(d\) in the text, the distribution of its topic number \(z_{d_{n} }\) can be obtained from the topic distribution \(\theta _{d}\) as: \[\label{GrindEQ__5_} z_{d_{n} } =\text{multi}\left(\theta _{d} \right) .\tag{5}\]
For that subject number, the probability distribution for word \(w_{d_{n} }\): \[\label{GrindEQ__6_} w_{d_{n} } =\text{multi}\left(\beta _{z_{d_{n} } } \right) .\tag{6}\]
Assuming that the number of words for the \(k\)nd topic in the \(d\)st document is \(n_{d}^{(k)}\), the multinomial distribution is: \[\label{GrindEQ__7_} \vec{n}_{d} =\left(n_{d}^{\left(1\right)} ,n_{d}^{\left(2\right)} ,\ldots ,n_{d}^{\left(K\right)} \right) .\tag{7}\]
The posterior distribution of \(\theta _{d}\) is obtained by \(Dirichlet-Multi\)-conjugation as: \[\label{GrindEQ__8_} \text{Dirichlet}\left(\theta _{d} \left|\vec{\alpha }+\vec{n}_{d} \right. \right) .\tag{8}\]
Similarly, for the distribution of topics and words, there is a Dirichlet distribution of \(K\) topics and words, and the corresponding data has a multinomial distribution of \(K\) topic numbers, such that \(\left(\eta \to \beta _{k} \to \vec{w}_{k} \right)\) forms the Dirichlet-Multi copula.
Suppose that in the \(k\)th topic, the \(v\)th word number is \(n_{k}^{\left(V\right)}\), the multinomial distribution is: \[\label{GrindEQ__9_} \vec{n}_{k} =\left(n_{k}^{\left(1\right)} ,n_{k}^{\left(2\right)} ,\ldots ,n_{k}^{\left(V\right)} \right) .\tag{9}\]
The posterior distribution of \(\beta _{k}\) can be obtained by conjugating \(Dirichlet-Multi\) to: \[\label{GrindEQ__10_} \text{Dirichlet}\left(\beta _{k} \left|\vec{\eta }+\vec{n}_{k} \right. \right) .\tag{10}\]
This paper primarily employs an enhanced neural network language model, specifically the Continuous Bag-of-Words (CBOW) model, in conjunction with the Global Word Vectors (Glove) model. Notably, another closely related model is the Skip-Gram, which exhibits marked similarities to CBOW but differs fundamentally in its approach: CBOW utilizes the context of a known word to predict the target word, whereas Skip-Gram reverses this process, utilizing a known word to predict its contextual words. In contrast to these two language models, Glove represents a distinct type of global word vectors model that transcends their methodologies. It capitalizes on global information to train word vectors, falling under the umbrella of matrix-based distributional representations, thereby offering a unique perspective on word semantics.
CBOW Model: CBOW model is mainly composed of input layer, projection layer and output layer. As shown above, \(w\left(t-2\right)\), \(w\left(t-1\right)\), \(w\left(t+1\right)\), and \(w\left(t+2\right)\) are the contexts for word \(w\left(t\right)\), where the objective function of the model is to maximize the log-likelihood: \[\label{GrindEQ__11_} L=\sum _{w\in C}\log p\left(w\left|\text{Context}\left(w\right)\right. \right) .\tag{11}\]
Skip-gram modeling: As can be seen from the previous mention, the main idea of Skip-Gram is to project the probability of the context of the word through the known current word. The structure of Skip-Gram model is basically the same as that of CBOW, which also consists of a three-layer network combining the input layer, projection layer and output layer.
Glove model: The Glove model is an unsupervised model and the training of word vectors relies on matrix decomposition.The core idea of Glove is a word co-occurrence matrix, which mainly takes the context of a word in the vocabulary as a scanning window, scans the entire vocabulary, and computes the number of times the words scanned in the context occur together to get the word co-occurrence matrix.25 Specifically, the probability that word \(w_{j}\) The probability of occurrence in the context of word \(w_{i}\) is: \[\label{GrindEQ__12_} p_{ij} =p\left(w_{j} \left|w_{i} \right. \right)=\frac{x_{ij} }{x_{i} } ,\tag{12}\] where \(x_{i}\) represents the sum of all occurrences of all words in the context of word \(w_{i}\), so far, this probability can be used to show the degree of correlation between a certain two words. If we want to calculate the degree of correlation between word \(w_{k}\) and words \(w_{i}\) and \(w_{j}\), we only need to calculate \({\raise0.7ex\hbox{$ p_{ik} $}\!\mathord{\left/ {\vphantom {p_{ik} p_{jk} }} \right. }\!\lower0.7ex\hbox{$ p_{jk} $}}\). If this ratio is larger than 1, then it means that the degree of correlation between word \(w_{k}\) and word \(w_{i}\) is higher, and vice versa. The objective function to be optimized in Glove model is: \[\label{GrindEQ__13_} J=\sum _{i,j}^{N}f \left(X_{i,j} \right)\left(v_{i}^{T} v_{j} +b_{i} +b_{j} -\log \left(X_{i,j} \right)\right)^{2} ,\tag{13}\] where \(f\left(x\right)\) is a weight function characterized by non-decreasing properties and \(f\left(x\right)\) is usually of the form: \[\label{GrindEQ__14_} f\left(x\right)=\left\{\begin{array}{l} {\left(x/x_{\max } \right)^{\alpha } ,x<x_{\max } } \\ {1,\text{Other}} \end{array}\right. ,\tag{14}\] where \(\alpha\) generally takes the value of 3/4, and the size of \(x_{\max }\) is set according to the size of the actual corpus.
Word Vectorization: Having attained a foundational understanding of the principles governing word vectors, the subsequent endeavor involves utilizing diverse models to train various word vectors. As previously elucidated, this study primarily focuses on training two primary categories of word vectors: CBOW and Glove. It is noteworthy that distinct categories of word vectors necessitate the specification of varying dimensions. Consequently, this paper uniformly establishes the training of word vectors pertaining to text reviews of leisure and tourism destinations within a 50-dimensional interval, encompassing vectors ranging from 50 to 300 dimensions. For the training of CBOW word vectors, we utilize the renowned and widely adopted word2vec toolkit. Currently, the Glove model lacks a toolkit as contemporary as word2vec, prompting numerous scholars to frequently utilize the model’s source code, accessible via Stanford University’s official website.26 This code shares some parameters that are comparable to those employed in word2vec, enabling the training of diverse word vectors through the adjustment of these parameters. The aforementioned trained word vectors, varying in both category and dimension, serve as the foundational input for the subsequent training of the classification model. Once the word vector matrix training is finalized, each word yields a corresponding list of semantically similar terms. For instance, Table 1 showcases the top 10 similar words associated with the term “fun.” Notably, the top three similar words to “fun” are “stimulus” (with a similarity score of 0.75668), “fun” itself (0.75454), and “hi” (0.70624), suggesting a commendable performance of the word vector training process. These similar words effectively mirror the sentiment expressed by the target word, underlining the model’s ability to capture nuanced semantic relationships.
| Similar word | Similarity |
|---|---|
| Stimulate | 0.75668 |
| Fun | 0.75454 |
| Cool | 0.70624 |
| Overaddiction | 0.68985 |
| Joyfulness | 0.66382 |
| Amusing | 0.65933 |
| Good deal | 0.65721 |
| Yummy | 0.62786 |
| Interesting | 0.61989 |
| Look good | 0.61563 |
The deep fully connected neural network (DNN) model structure is shown in Figure 2, which illustrates a neural network containing five hidden layers, each containing 3-4 hidden units. A fully connected neural network containing four hidden layers and above can be called a deep neural network in a general sense, this is because deep and shallow is not an absolute issue in the concept of deep learning, a nine-layer neural network is a deep network compared to a six-layer neural network, and a six-layer neural network is a deep network compared to a three-layer neural network. So as long as the neural network is not just a simple two or three hidden layers, it can be called a deep neural network.
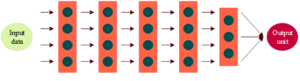
The determination of the number of neural network layers, the hidden units within each layer, the learning efficiency of gradient optimization, and other parameter settings significantly influences the ultimate training efficiency and effectiveness of the model. However, these parameters, known as hyperparameters, cannot be automatically optimized during the model’s training process. To distinguish them from ordinary parameters, scholars have designated this term. The hyperparameters of a Deep Neural Network (DNN) model encompass not only the properties of the activation function and the Minibatch size, but also the aforementioned factors. The forward propagation formulation implemented in the model is detailed as follows:
\[\label{GrindEQ__15_} A^{n} =W^{n} *Z^{n-1} +B^{n} Z^{n} =g^{n} \left(A^{n} \right).\tag{15}\]
The loss function formula and the backpropagation derivation formula for the model implementation are shown below, where the loss function is a multicategorical cross entropy function and the backpropagation formula calculates the corrected values of parameter \(W\) and parameter \(B\) at each iteration: \[\begin{aligned} \label{GrindEQ__16_} {\rm {\mathcal L}}\left(y,y\right)=&-\left(y_{1} \log \left(y_{1} \right)+y_{2} \log \left(y_{2} \right)\right.\notag\\ &\left.+\left(1-y_{1} -y_{2} \right)\log \left(1-y_{1} -y_{2} \right)\right) . \end{aligned}\tag{16}\] \(dZ^{N} =\) varies with the loss function and is not fixed, e.g., the expression is equal to (Z-Y) when the loss function is a binary cross-loss function: \[\label{GrindEQ__17_} dA^{n} =dZ^{n} *g^{n'} \left(A^{n} \right) ,\tag{17}\] \[\label{GrindEQ__18_} dW^{n} =\frac{1}{L_{n} } dA^{n} *Z^{n-1^{T} } ,\tag{18}\] \[\label{GrindEQ__19_} dB^{n} =\frac{1}{L_{n} } np\cdot sum\left(dA^{n} ,axis=1\right) ,\tag{19}\] \[\label{GrindEQ__20_} dZ^{n-1} =W^{n^{T} } *dA^{n} .\tag{20}\] Table 2 shows the description of the symbols in the formula.
| Symbol | Meaning |
|---|---|
| \(n\) | The \(n\) layer neural network |
| \(L_{n}\) | The number of neurons in the \(n\) layer |
| \(g^{n} \left(\right)\) | It’s the activation function of the \(n\) layer neural network |
| \(W^{n}\) | The matrix expression of the \(w\) coefficient,dimension is \(L_{n} *L_{n-1}\) |
| \(B^{n}\) | The matrix expression of \(b\) coefficients, the dimension is \(L_{n}\) |
| \(A^{n}\) | \(n\) layer of linear output before activation,dimension \(L_{n}\) |
| \(Z^{n}\) | The \(n\) layer of nonlinear output, dimension \(L_{n}\),\(Z^{0}\) is input |
| \(y\) | Actual classification |
| \(y\) | Classification probability of model prediction |
| \(N\) | The neural network is the total number of layers |
| \(np.sum\) | All the dimensions of the vector add up to the python command |
As advancements in artificial intelligence and deep learning persist, scholars have observed that certain functions can solely be efficiently learned by exceedingly deep neural networks, whereas shallower models fall short. When dealing with vast amounts of data, the reason for abandoning the simplistic approach of employing shallow neural networks with limited layers lies in the fact that as the number of neural network layers increases, the requisite number of neural units decreases geometrically. This implies that deep neural networks significantly conserve computational power when processing large datasets. Consequently, for neural networks, size is not paramount; rather, depth is imperative.
It is currently widely accepted that the image of a tourist destination comprises both its “perceived image” and “projected image.” In adherence to this concept, this paper embarks from the vantage point of tourists, leveraging their experiential feedback to delve into and analyze the perceived characteristics of the Sanya tourist destination. Specifically, we examine the perceptions formed by tourists through their experiences, thereby contributing to a comprehensive understanding of the destination’s image.
The current tourism attractions of Sanya tourist attractions mainly include three categories: natural scenery, cultural resources and specialty food. The statistics of cognitive image vocabulary of Sanya tourist attractions are shown in Table 3.
First, natural resources. And the natural scenery has the highest word frequency (the word frequency is 13555). Sanya (6486), Yalong Bay (4049), Sanya Bay (875), Dadonghai (812), downtown (465), Atlantis (368), islands (253), and forest parks (242) are the high-frequency vocabulary words in the secondary category of “natural scenery”.
Second, cultural resources. Sanya’s cultural resources and the unique local folklore and religious culture are inseparable. As early as in the Han and Tang dynasties, Buddhism was prevalent in Sanya, and Nanshan Temple, Yongqing Temple, Jinshan Temple and Chaoyin Temple were all established in the Han and Tang dynasties. Therefore, the high-frequency words belonging to the secondary category of “cultural resources” are Nanshan Temple (1315), Guanyin (1543), Buddhism (269), and Li ethnic group (1521).
Third, specialty food. Among the high-frequency words in the category of “specialties”, Wenchang chicken (1,443), Hele crab (1,126), and Dongshan goat (612) are quite a lot, which shows that the tourists have already closely linked the above types of food with Sanya tourism. However, other local cuisines in Sanya do not appear in the list of high-frequency words, which shows that tourists have not fully explored the attributes and values of Sanya’s local specialties, and other cuisines are less well-known.
| Primary class(frequency/percentage) | Secondary class(frequency) | High frequency vocabulary |
| Tourist attraction(26652/53.1%) | Natural wind (13555) |
Sanya(6486),Yalong bay(4049),Sanya bay(875),The east China sea(812),
The city(465),Atlantis(368),The islands(253),Forest park(242) |
| Cultural resources(9995) | Nanshan temple(1315),Guanyin(1543),Buddhism(269),The li family(1521), | |
| Special food(3102) | Wenchang chicken(1443),The crab(1126),Dongshan sheep(612) | |
| Tourism infrastructure and services (11184/22.3%) | Traffic service(2896) | The bus(3073),Driving(1723), Subway(76) |
| Accommodation services(576) | Atlantis(362) | |
| Travel agency service(635) | Adapter(256) | |
| Travel infrastructure services(7077) | Scenic spot(4923),The bridge(1885),High mountain slip(1375) | |
| Travel service environment (2545/5.1%) | Service environment (2545) | The building(1863),Service(1335),Coupons(758) |
| Tourist behavior(9801/19.5%) | Tourist consumption(6356) | Tickets(1725),Arrive(1346),Ride(1235),Net red(856),Parent-child (345),Visiting project(856) |
| Travel awareness (3445) | Time consuming (1122)Decision(1123),Position (1298) |
According to the analysis of the perception image of the tourist destination in Sanya, the “tourism service center” and “toilet” have not impressed the tourists, and show that the tourists have less sense of image of the infrastructure of Sanya city. Tourists focus on visual appreciation and satisfaction in tourism activities, and lack of immersive experience of tourism projects. This is closely related to the construction of the city’s infrastructure, which is influenced by the idea and thought of the overall urban construction planning. In the tourism planning of the Sanya city, the boundary of the tourist attractions and workplace and living areas should be reduced, and the construction of urban infrastructure is also considered, and the foundation of the development of the tourism industry is considered, and the driving force of the tourism industry is also provided for the development of the city.
The perception of tourists towards the image of tourist destinations exerts a profound impact on their overall perceptual experience during travel, with emotional image being a pivotal category of influencing factors. This subsection focuses on elucidating the current emotional image of tourists visiting the Sanya City tourist destination by selecting words imbued with emotional connotations. This approach aims to genuinely mirror tourists’ sentiments towards their experiences in Sanya City. Employing network text analysis, we have identified emotional words directly associated with the tourist attractions, tourism infrastructure, tourism environment, and natural surroundings of Sanya City. Subsequently, Table 4 presents the word frequency statistics pertaining to the emotional image of the Sanya tourist destination.
The emotional vocabulary employed by tourists in their perception of the image of the Sanya tourism destination encompasses a broad spectrum of terms, exhibiting a diverse range of word frequency attributes. To enhance the study’s reliability, this paper primarily categorizes the emotional vocabulary pertaining to the image perception of the Sanya tourism destination into three distinct groups: positive, neutral, and negative. Notably, the positive emotion words dominate, with bellicose, smooth, pretty, magnificent, beautiful, showy, shocking, ’great praise’, and marvelous occupying the top eight positions. These words authentically capture the prevailing sentiments of tourists towards their experiences in the Sanya City tourist destination. Notably, ’well-known’ and ’bellicose’ frequently recur in tourists’ logs on mainstream tourism websites, while ’smooth’, ’bright’, and ’magnificent’ are predominantly used to describe the serene beaches and renowned mountains and rivers that tourists visited in Sanya.
Tourists utilize terms like ’praised’ and ’marveled’ to articulate their perceived experiences after visiting Sanya’s entertainment attractions. Concurrently, the prevalence of negative emotion words is notable, encompassing ’tired’, ’sigh’, ’disappointed’, ’not recommended’, ’depressed’, ’reluctant’, ’cheated’, ’scared’, ’shocked’, and ’unworthy’. Notably, ’tired’ (with a frequency of 34) emerges as the most frequently used word, which can be attributed to the relatively long linear distances between tourist attractions in Sanya, necessitating substantial physical exertion, particularly when navigating famous mountains, oceans, and other thematic attractions under high temperatures. Furthermore, tourists express dissatisfaction with their shopping experiences within Sanya’s tourist attractions through words like ’disappointed’, ’not recommended’, ’cheated’, ’scared’, ’shocked’, and ’not worth it’, primarily due to the high entrance fees and associated consumption costs.Regarding neutral words, high frequencies are observed for terms such as ’waiting’ (101), ’understanding’ (185), ’fun’ (61), and ’relaxation’ (56), indicating that a significant proportion of tourists are influenced by weblogs and recommendations from family and friends, leading them to prioritize Sanya as their destination of choice.
| Vocabulary | Word frequency | Vocabulary | Word frequency | Vocabulary | Word frequency |
|---|---|---|---|---|---|
| Well-known | 656 | Understanding | 185 | Wise | 73 |
| Love | 117 | Reasonable | 96 | Excited | 44 |
| Tired | 34 | Correct | 76 | Comfort | 56 |
| Convenience | 243 | Unique | 95 | Famous | 91 |
| Free | 81 | Amazing | 69 | Firm | 41 |
| Immerse | 128 | Sighing | 82 | No recommendation | 23 |
| Better | 61 | Cherish | 82 | Strange | 17 |
| Beautiful | 152 | Overvalue | 74 | Expectation | 16 |
| Worth | 142 | Disappointment | 72 | Depression | 14 |
| Transparent | 142 | Clean | 71 | Busy | 7 |
| Beauty | 179 | Refreshing | 62 | Reluctance | 7 |
| Reluctance | 126 | Interesting | 61 | Just gasp | 1 |
| Shock | 132 | Pleasure | 61 | Cheat | 6 |
| Common love | 109 | Cozy | 61 | Scary | 5 |
| Great thumb | 103 | Comfort | 62 | Shock | 2 |
| Wait for | 101 | Relax | 56 | Not worth | 3 |
According to the analysis of emotional image, the participation, interactivity, and experiential travel project are lack in the Sanya city, and the lack of projects that enable tourists to invest deeply, the tourists cannot obtain the novel tourist experience. In this regard, Sanya should build an interactive travel system and increase the depth of the culture carried by Sanya city.
Having completed the excavation of the image of a leisure tourism destination, this paper delves further into the influential factors shaping tourists’ perceived effects on this image, utilizing regression analysis as a tool. Within this framework, tourists’ satisfaction serves as a metric to assess the perceived impact of the tourism destination’s image. Given that tourists evaluate both the quality of service and their satisfaction with leisure tourism destinations, this study specifically targets tourists from diverse age groups to ensure the veracity of questionnaire data.Considering June to October as the peak season for leisure tourism in D city, our research was conducted at this destination in July 2023. A survey was systematically administered to tourists upon completion of their tours at the tourist distribution center. A total of 500 questionnaires were distributed, and although an initial mention of collecting 4,000 questionnaires appears to be a typographical error, the accurate figure is that 494 responses were ultimately retrieved, ensuring a substantial response rate for analysis.Upon excluding incomplete data, contradictory questionnaires, and other invalid responses, a total of 465 valid questionnaires remained, resulting in a validity rate of 94.1%. The subsequent subsection delves into the correlation between tourism service quality and tourist satisfaction, employing regression analysis as the primary analytical tool. Specifically, tourist satisfaction is designated as the dependent variable, while tourism expected service quality, perceived service quality, and service quality are individually considered as independent variables. The regression analysis was performed using SPSS 21 software.
The relationship between expected service quality of tourism and tourists’ satisfaction was analyzed through regression analysis using SPSS software. The results of this regression analysis are presented in Table 5.
R²=0.702, F=171.268,p=0.000 is significant at p less than 0.001, and the corrected R² is 0.698, the model fits well and can explain about 69.8% of the data changes, which indicates that the regression of the various dimensions of the expected service quality of tourism on tourists’ satisfaction does a good job of explaining the regression of the quality of tourism expectations and the p-values of the several independent variables are less than 0.001 and the coefficients are respectively – 0.25, -0.12, -0.179, -0.354, 0.641.
The analysis reveals a negative correlation between tourist satisfaction and the five dimensions of service quality expectations in tourism, namely tangibility, reliability, responsiveness, assurance, and, contrary to the other dimensions, empathy, which exhibits a positive relationship. This finding aligns with the notion that as expectations increase, the potential for dissatisfaction also rises due to the heightened psychological impact of unmet expectations, resulting in a lower satisfaction level.
The relationship between tourism perceived service quality and tourists’ satisfaction was analyzed using regression analysis conducted with SPSS software. The results of this analysis are presented in Table 6.
F=534.103, p=0.000 is significant at 0.01 level, R²=0.862, the model fits well, the model is good, the adjusted R² value is 0.86, which indicates that 86% of the samples can be explained, and the coefficients of the dimensions of the perceived service quality are as follows: the regression coefficient of tangibles is 0.249, p is less than 0.01, it is significantly positively correlated with tourists’ satisfaction. Reliability regression coefficient is 0.232, P less than 0.01, then it is significantly positively related to tourists’ satisfaction. Responsiveness regression coefficient is 0.277, p less than 0.01, then it is significantly and positively associated with tourists’ satisfaction. Assurance regression coefficient is 0.001, p-value is greater than 0.05, which is not significant. Empathy regression coefficient is -0.111, P less than 0.01, then it is significantly negatively related to tourist satisfaction.
Tourist satisfaction is positively related to perceived service quality tangibility, reliability, responsiveness and negatively related to empathy.
To investigate the relationship between the impact of service quality, defined as the discrepancy between perceived and expected service quality, on tourists’ satisfaction, SPSS software was employed to conduct a regression analysis. The results of this analysis, which explores the influence of tourism service quality on tourist satisfaction, are presented in Table 7.
R²=0.961 and adjusted R²=0.958, which means that 95.8% of the sample can be explained. The value of the regression coefficient of tangibility is 0.43 (p=0.000\(\mathrm{<}\)0.01), which indicates that tangibility will have a significant positive effect on satisfaction. The regression coefficients of tangibles, reliability, and responsiveness are 0.43, 0.463, and 0.434, respectively, with a significant p-value, indicating that tourists’ satisfaction is positively and significantly correlated with these dimensions of service quality, and has little correlation with assurance and empathy.
The analysis indicates that tangibility, reliability, and responsiveness of tourism service quality have a positive impact on tourist satisfaction, whereas the correlation between assurance and empathy dimensions and tourist satisfaction is not statistically significant. Consequently, to enhance the overall quality of tourism services, our efforts should primarily concentrate on improving tangibility, reliability, and responsiveness, adopting efficient and practical measures to achieve this objective.
This paper delves into AI-driven innovation in leisure tourism destination images, with Sanya tourist attraction serving as a pivotal research case. Subsequent to mining the image of the leisure tourism destination, we employ regression analysis to delve deeper into the factors that influence tourists’ perceived effects on the destination image.
The cognitive image vocabulary pertaining to Sanya tourist attractions encompasses three primary categories, with tourism attractions constituting 53.1% of the total. These attractions are further subdivided into three subcategories: natural scenery, cultural resources, and specialty food. The emotional vocabulary in the perceived image of Sanya’s tourism destinations is categorized into positive, neutral, and negative sentiments. Notably, the neutral vocabulary with high frequency comprises words such as ’waiting’ (101 occurrences), ’understanding’ (185), ’fun’ (61), and ’relaxation’ (56). This suggests that a considerable number of tourists who prioritize Sanya as their travel destination are influenced by weblogs and recommendations from their family and friends.
The study found that tourist satisfaction exhibits a negative correlation with the tangibility (-0.25), reliability (-0.12), responsiveness (-0.179), and assurance (-0.354) dimensions of tourism expectations service quality, while displaying a positive correlation with empathy (641). Counterintuitively, the higher the tourists’ expectations for satisfaction, the lower their actual satisfaction tends to be. Regression analysis revealed that perceived service quality in terms of tangibility, assurance, reliability, and responsiveness was significantly positively correlated with tourist satisfaction, while empathy showed a negative regression coefficient of -0.111 (P \(\mathrm{<}\) 0.01), indicating a significant negative correlation. Specifically, tangibility, reliability, and responsiveness yielded regression coefficients of 0.43, 0.463, and 0.434, respectively, demonstrating significant positive correlations with tourist satisfaction. However, the correlation with empathy was insignificant, while the relationship with reliability was noted to be relatively weak.


