The fusion of big data with the realm of education represents a pivotal concept for propelling the profound transformation and advancement of educational systems. This integration stems from the modernization efforts, namely, the reform, innovation, and amalgamation of cutting-edge science and technology, which have diversified the modes of physical education in higher education institutions, thereby offering a multifaceted foundation for enhancing the quality of students’ physical education [1-4]. The inherent necessity of this integration between science and technology, and the traditional physical education sector, lies in fostering a comprehensive elevation in the efficiency and quality of physical education. This expansion of physical education modalities aims to uncover more scientific and effective teaching methodologies, emphasizing the distinctive merits of contemporary science and technology in education, and catalyzing the overall reform and development of educational systems [5-8]. Consequently, in the midst of reforming and enhancing basketball teaching in universities and colleges, it is imperative to prioritize adapting to the big data environment and proactively incorporate modern teaching methodologies that align with students’ basketball learning needs. Such endeavors will furnish innovative perspectives for the reform and progression of physical education, ultimately leading to a holistic improvement in students’ grasp of basketball’s theoretical underpinnings and practical abilities.
The profound implementation of comprehensive quality education has elevated the expectations for physical education and notably enhanced the standing of physical education courses within the academic landscape. Basketball, being a traditional and pivotal discipline within physical education in Chinese universities and colleges, has naturally garnered widespread attention from various stakeholders [9-11]. The teaching of basketball courses in these institutions prioritizes fostering students’ foundational basketball competencies. Amidst the advent of the information age and the swift proliferation of big data, the methodologies and modalities of basketball instruction in universities and colleges have undergone significant transformations.From a big data education perspective, the integration of information technology tools with college basketball teaching facilitates the harmonious fusion of basketball talent development objectives, instructional strategies, educational resources, and big data. This integration effectively reorients traditional basketball teaching ideologies and methodologies, thereby strengthening students’ theoretical comprehension of basketball and their proficiency in technical and tactical abilities [12-13]. Despite the significant advancements in basketball teaching in colleges and universities under the influence and guidance of informatization educational ideologies, an examination of the current state reveals persisting issues such as outdated concepts, inadequate teaching innovations, and a disregard for students’ active participation. These issues not only hinder the nurturing of students’ interest in basketball but also pose substantial obstacles to the innovative development of basketball education in higher education institutions. In light of this teaching landscape, it is imperative for colleges and universities to devise strategic plans for basketball instruction, meticulously identify shortcomings in basketball teaching amidst the backdrop of big data, and propose innovative strategies for pedagogical enhancement based on an objective analysis of the teaching status quo. Such endeavors will facilitate the substantial development of students’ basketball proficiency [14].
Literature [15] employs a multifaceted approach incorporating literature review, questionnaire surveys, and expert interviews to scrutinize the contemporary evaluation framework for basketball teaching outcomes. The study advocates that this system should encompass the attitudes of both students and teachers towards the general basketball course, enhancing instructors’ teaching proficiency and students’ enthusiasm towards the learning objectives, thereby elevating the quality of students’ basketball skills and fostering their physical wellbeing within the context of a healthily evolving general basketball class.Literature [16] endeavors to delve into the rejuvenation of basketball pedagogical philosophies in higher education institutions. It acknowledges that, despite basketball’s technical intricacies, college basketball instruction transcends mere technical proficiency. It emphasizes the cultivation of personality, individuality, and the dissemination of basketball culture through physical conditioning, technical, and tactical training. Furthermore, it highlights the importance of fostering a sense of social responsibility and instilling the virtues of diligence and enterprise.Literature [17] utilizes Visual C++ programming language, OpenGL graphical programming interface, and 3DS Max to implement and refine aspects such as texture mapping, animation, and collision detection across various modules, including the graphical user interface and level design. This technological integration aims to augment athlete training, bolstering their physical conditioning and significantly enhancing their speed and jumping ability in basketball.Literature [18] adopts an ecological perspective, examining the structural and functional dynamics of basketball teaching activities in colleges and universities within the framework of educational ecosystems and ecological balance. It seeks strategies to rectify internal and external ecological imbalances, explores avenues for the sustainable development of basketball teaching in higher education, and offers pertinent recommendations.
Literature [19] introduces an optimization design methodology for a basketball teaching and training system, grounded in motion capture technology. By juxtaposing the simulation outcomes with authentic athlete training videos, the study demonstrates that basketball motion capture effectively dissects movement discrepancies, facilitating the identification of technical shortcomings and enhancing training efficacy. Literature [20] introduces an optimization design methodology for a basketball teaching and training system, grounded in motion capture technology. By juxtaposing the simulation outcomes with authentic athlete training videos, the study demonstrates that basketball motion capture effectively dissects movement discrepancies, facilitating the identification of technical shortcomings and enhancing training efficacy. Literature [21] discusses the ongoing transformation in the pedagogical philosophy of colleges and universities, highlighting the parallel innovation in the concepts and practices of college basketball programs. It advocates breaking away from conventional teaching models and embracing a health-centric approach to guide the reform of college basketball curricula. The objective is to establish a basketball curriculum model that fosters the holistic development of students’ physical and mental wellbeing, addressing the challenges faced by college basketball teaching and enhancing students’ overall competencies. Literature [22] examines the practical implementation of sports basketball teaching applications within the contemporary new media landscape. It posits that the utilization of basketball training apps can amplify teaching outcomes, ignite students’ enthusiasm for classroom learning, and nurture self-directed learning attitudes. Furthermore, it argues that these apps can augment the effectiveness of traditional basketball training methodologies.
This paper outlines the process of big data analysis, grounded in relevant theoretical frameworks, encompassing data preparation, mining, and subsequent result expression and interpretation. Through an exhaustive examination of the traditional k-means clustering algorithm’s underlying principles, we introduce the refined DT-kmeans clustering algorithm. Applying this algorithm, we conduct a clustering analysis of the current state of basketball teaching development in colleges and universities. Building upon the insights gained from this clustering, we incorporate the SPOC teaching model’s concept and, leveraging a novel SPOC-based college basketball teaching model, empirically demonstrate its positive impact on enhancing basketball teaching efficacy in academic settings. Furthermore, we delve into the innovative avenues for advancing college basketball teaching methodologies.
Big data analytics encompasses the transformative process of converting vast amounts of raw data into actionable knowledge and insights. This involves a meticulous sequence of steps, including data cleansing, integration, and transformation, to curate datasets suitable for rigorous analysis and mining. Subsequently, tailored mining models are constructed, leveraging the unique characteristics of each dataset. Through the iterative training and learning process of these models on selected datasets, they are refined to accurately predict, propagate, and correlate pertinent knowledge and data patterns. Ultimately, these insights facilitate informed decision-making. Consequently, the core objective of big data analytics lies in extracting implicit, practical, and efficient knowledge, patterns, and laws from diverse data sources, which are then harnessed to enhance future analytical, predictive, and judgmental capabilities.
The process of big data analytics is shown in Figure 1, which generally includes data preparation, data mining, and result expression and interpretation.
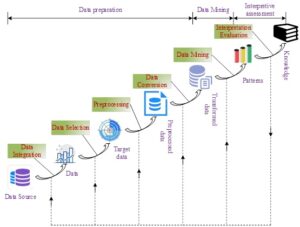
Big data analysis is to mine and analyze the data that exists in reality, and in practice, these data are usually used as data stored in the database, which is unclear, missing and contaminated, and usually these data must first be transformed into data suitable for direct mining through certain analytical processing, so the first step of data processing is data preparation. There are three aspects of data preparation specifically, firstly, data integration, secondly, selecting certain data, and finally the detailed pre-processing process. Facts show that data preparation occupies 80% of the workload in the process of big data analysis, and it can be said that it is the focus of the whole big data analysis process and has a very important role. The more detailed the data preparation work is done, the more hassle-free the data mining stage is and the more reliable the conclusions will be.
Data mining constitutes a pivotal stage within the broader knowledge discovery process, marking a critical juncture in the entire big data analytics lifecycle. Notably, it is both the most vital and intricate component of this process, attracting the concentrated efforts of numerous researchers in the field of big data analytics development. During this phase, algorithms such as decision trees, classification and clustering methods, among others, are employed to delve into processed data, aiming to uncover latent rules and hitherto unknown knowledge patterns.
Following the rigorous analysis conducted in the preceding stages, we are able to discern and refine valuable knowledge or models from the initial database. Prior to validating the authenticity of these models, it is imperative to assess their merit and relevance. For knowledge deemed congruent with reality and to be of practical value as a model, verifying the consistency between pre- and post-models is crucial to prevent any discrepancies with the original knowledge base. Regarding the newly discovered, applicable knowledge, its utilization must be judicious. Firstly, we leverage the mined knowledge to derive meaningful outcomes, thereby furnishing users with a scientific foundation for decision-making. Secondly, we incorporate the newly acquired data into our model, generating fresh insights and challenges, which we continuously refine and optimize in accordance with predefined objectives. This iterative process repeats until a robust knowledge framework is established.
Principle: The K-means algorithm is a clustering algorithm whose purpose is to divide a set of data into \(k\) different clusters, so that the data within the same cluster has a high degree of similarity and the similarity between different clusters is as low as possible. The solution process can be represented by the following steps:
Step 1: Randomly select \(k\) points as cluster centers.
Step 2: For each data point, calculate its distance from the center of each cluster and classify it as the closest family.
Step 3: Calculate the center point of each cluster and use it as the new cluster center.
Step 4: Repeat steps 2 and 3 until the center of the cluster does not change anymore or a preset number of iterations is reached.
With K-means algorithm, data can be clustered to discover potential patterns and regularities in the data.
Evaluation Indicators: SSE (Sum of Squared Errors): SSE refers to the sum of the squares of the distances of all data points in the clustering results to their corresponding clustering centers.The smaller SSE means the better the clustering effect, which can be used to evaluate the effectiveness of the clustering algorithm.The formula of SSE is: \[\label{GrindEQ__1_} SSE=\sum _{x\in C_{i} }\left\| x-\mu _{i} \right\| ^{2} ,\tag{1}\] where \(k\) is the number of clusters, \(C_{i}\) is the \(i\)rd cluster, and \(\mu _{i}\) is the center of the \(i\)th cluster.
Silhouette Coefficient: Silhouette Coefficient is a kind of index for evaluating the quality of clustering, which can be used to judge whether the clustering effect is reasonable or not. The value of Silhouette Coefficient ranges from \(\left[-1,1\right]\), and the closer to 1, the better the clustering effect. The formula of Silhouette Coefficient is: \[\label{GrindEQ__2_} s(x)=\frac{b(x)-a(x)}{\max (a(x),b(x))} ,\tag{2}\] where \(a(x)\) is the average distance between data point \(x\) and the clustering center it belongs to, and \(b(x)\) is the average distance between data point \(x\) and its nearest neighbor clustering center.
Calinski-Harabasz Index (CH index): the CH index is a clustering effect evaluation index, which is based on the distance between the SSE of the clustering results and the clustering centers, and the larger means the better the clustering effect.The formula of CH index is: \[\label{GrindEQ__3_} CH=\frac{Tr\left(B_{k} \right)}{Tr\left(W_{k} \right)} \times \frac{n-k}{k-1} ,\tag{3}\] where, \(B_{k}\) is the covariance matrix between the clustering centers, \(W_{k}\) is the covariance matrix between all the data points in the clustering results and the clustering centers they belong to, \(n\) is the number of data points, and \(k\) is the number of clusters.
Davies-Bouldin Index (DB Index): DB index is a metric used to assess the effectiveness of clustering, which takes into account the distances between clusters and the variability within clusters in the clustering results.A smaller DB index indicates a better clustering effect.The formula for DB index is: \[\label{GrindEQ__4_} DB=\frac{1}{k} \sum _{i=1}^{k}\max _{j\ne i} \frac{s_{i} +s_{j} }{d\left(\mu _{i}, \mu _{j} \right)}\tag{4}\] where \(S_{i}\) is the average distance between the samples of the \(i\)nd cluster and its cluster center, and \(d\left(\mu _{i} ,\mu _{j} \right)\) is the distance between the \(i\)th and \(j\)th clusters.
Given the inherent limitation of the traditional K-means clustering algorithm, which randomly selects initial cluster centroids, leading to instability in cluster division outcomes, this paper introduces an enhanced K-means clustering algorithm aimed at optimizing the selection of initial centroids, designated as the DT-kmeans algorithm. In contrast to the conventional K-means approach, the DT-kmeans algorithm initiates by defining an Eps neighborhood based on the t-nearest neighbor distance. Subsequently, leveraging the statistical density information of data objects within this neighborhood, the algorithm selects an initial centroid from the dataset at random. For the remaining class clusters, centroids are chosen considering the data objects’ density and their proximity to the previously determined centroids. Specifically, the selection process prioritizes data objects with high density and a substantial distance from existing centroids, as determined by a probability function. This ensures that data objects with both characteristics have a heightened likelihood of being selected as new cluster centroids. To facilitate comprehension of the algorithm, the subsequent definitions are presented:
Definition 1. In the Euclidean space \(R^{m}\), there exist two data objects \(x_{i} =\left\{x_{i1} ,x_{i2} ,\cdots ,x_{im} \right\}\), \(x_{j} =\left\{x_{i1} ,x_{i2} ,\cdots ,x_{jm} \right\}\), and the similarity between them is measured by the Euclidean distance, which is: \[\label{GrindEQ__5_} d\left(x_{i} ,x_{j} \right)=\left\| x_{i} -x_{j} \right\| =\sqrt{\sum _{i=1}^{m}\left(x_{i} -x_{j} \right)^{2} } .\tag{5}\]
Definition 2. In the Euclidean space \(R^{m}\), there exists a dataset \(D=\left\{x_{1} ,x_{2} ,\cdots ,x_{n} \right\}\) containing \(n\) data objects and \(D_{n*n}\) is the distance distribution matrix of dataset \(D\), i.e.: \[\label{GrindEQ__6_} D_{n*n} =\left\{d\left(x_{i} ,x_{j} \right)\left|1\le i\le n\right. ,1\le j\le n\right\} .\tag{6}\]
Definition 3. In the Euclidean space \(R^{m}\), there exists a dataset \(D=\left\{x_{1} ,x_{2} ,\cdots ,x_{n} \right\}\) containing \(n\) data objects, \(Eps\) with the neighborhood parameter \(\eta\) set to: \[\label{GrindEQ__7_} \eta =\left\lfloor \sqrt[{4}]{n} \right\rfloor +1 .\tag{7}\]
Definition 4. In the Euclidean space \(R^{m}\), there exists a dataset \(D=\left\{x_{1} ,x_{2} ,\cdots ,x_{n} \right\}\) containing \(n\) data objects, \(D_{n*n}\) is the distance distribution matrix of dataset \(D\), and the \(\eta\)th smallest distance parameter \(d\left(x_{i\eta } \right)\) is taken out for each row of the distance distribution matrix to obtain the distance array \(D_{\eta }\): \[\label{GrindEQ__8_} D_{\eta } =\left\{d\left(x_{i\eta } \right)\left|1\le i\le n\right. ,\eta =\left\lfloor \sqrt[{4}]{n} \right\rfloor +1\right\} .\tag{8}\]
Definition 5. In the Euclidean space \(R^{m}\), there exists a dataset \(D=\left\{x_{1} ,x_{2} ,\cdots ,x_{n} \right\}\) containing \(n\) data objects, \(\eta\) is the Eps neighborhood parameter and the Eps neighborhood distance is: \[\label{GrindEQ__9_} Eps=\overline{D_{\eta } }=\frac{1}{n} \sum _{i=1}^{n}d \left(x_{i\eta } \right) .\tag{9}\]
Definition 6. In the Euclidean space \(R^{m}\), there exists a dataset \(D=\left\{x_{1} ,x_{2} ,\cdots ,x_{n} \right\}\) containing \(n\) data objects, and the number of data objects in the neighborhood centered on data object \(x_{i}\) and radiused by \(Eps\) is called the density \(\rho \left(x_{i} \right)\) of data object \(x_{i}\) and is defined as: \[\label{GrindEQ__10_} \rho \left(x_{i} \right)=\sum _{i=1,j\ne i}^{n}u \left(Eps-d\left(x_{i} ,x_{j} \right)\right) .\tag{10}\] \[\label{GrindEQ__11_} u\left(x\right)=\left\{\begin{array}{ll} {1} & {x\ge 0} \\ {0} & {x<0} \end{array}\right. .\tag{11}\]
Definition 7. In the Euclidean space \(R^{m}\), there exists a dataset \(D=\left\{x_{1} ,x_{2} ,\cdots ,x_{n} \right\}\) containing \(n\) data objects, and the set of class cluster centroids \(V=\left\{v_{1} ,v_{2} ,\cdots ,v_{k} \right\}\) is the set of class cluster centroids for clustering and dividing the dataset, and the Euclidean distance \(d\left(x_{i} ,V\right)\) between the data objects \(x_{i}\) in the set and the set of class cluster centroids is defined to be the minimum of the Euclidean distances between \(x_{i}\) and the data objects in the set \(V\): \[\label{GrindEQ__12_} d\left(x_{i} ,V\right)=\min \left(d\left(x_{i} ,v_{j} \right)\right)j\in \left(1,k\right) .\tag{12}\]
Definition 8. In the Euclidean space \(R^{m}\), there exists a dataset \(D=\left\{x_{1} ,x_{2} ,\cdots ,x_{n} \right\}\) containing \(n\) data objects, the set of class cluster centroids \(V=\left\{v_{1} ,v_{2} ,\cdots ,v_{l} \right\}\) is the set of data objects that have been selected as class cluster centroids, and the set \(T=\)\(\left\{t_{1} ,t_{2} ,\cdots ,t_{n-l} \right\}\) is the set of data objects that are not currently selected as class cluster centroids, then the weight \(w\left(t_{j} \right)\) of a data object \(t_{j}\) in the set \(T\) that has been selected as a class cluster centroid is: \[\label{GrindEQ__13_} w\left(t_{j} \right)=d\left(t_{j} ,V\right)*\rho \left(t_{j} \right)j\in \left(1,n-l\right) .\tag{13}\]
Based on the above definition, we propose a new improved K-means clustering algorithm: the Density K-means algorithm based on the T-th nearest distance.The DT-Kmeans algorithm consists of the following steps in sequence:
Input the target dataset \(D\) containing \(n\) data object and the number of class clusters to be clustered in the dataset \(k\).
Calculate the Euclidean distance between all data objects within the target dataset \(D\) according to equation (5), and store the Euclidean distance information in the distance distribution matrix \(D_{n*n}\).
based on the number of data objects \(n\) contained in the dataset, calculate the Eps neighborhood parameter \(\eta\) according to equation (7).
Based on the distance distribution matrix \(D_{n*n}\) of the data set, take out the \(\eta\)th smallest distance parameter \(d\left(x_{i\eta } \right)\) in each row to get the distance array \(D_{\eta }\).
Based on the distance array \(D_{\eta }\), average the distance data in the array according to Eq. (9) to get the neighborhood parameter Eps.
according to Eq. (10) and Eq. (11), count the density information of the data objects, i.e., the number of data objects in the dataset whose Euclidean distance to the data object is less than or equal to the neighborhood parameter Eps.
Define an empty set \(T\), and put the data object information in data set \(D\) and the density information of the corresponding data object into set \(T\).
Define an empty set \(V\) to hold the class cluster centroids.
Randomly select a data object from set \(T\) and put it into \(V\) as the initial cluster center point, and then remove the point from set \(T\).
Count the minimum value of the Euclidean distance between the data object in set \(T\) and the class cluster centroid in set \(V\) according to equation (12).
Select a data object from set \(T\) to be added to class cluster centroid set \(V\) as a new class cluster centroid. For data object \(t_{i}\) in set \(T\), determine the weight \(w\left(t_{j} \right)\) of being selected as the class cluster centroid according to equation (13), and the probability of data object \(t_{i}\) being added is \(p=\frac{w\left(t_{j} \right)}{\Sigma _{t_{u\in T} w} \left(t_{u} \right)}\). Remove the data object from set \(T\) that was added to class cluster centroid set \(V\).
Repeating the iterative steps 10 and 11 until the number of data objects in the set \(V\) is \(k\).
Participating in K-means clustering by using the data objects in set \(V\) obtained in step 12 as initial class cluster centroids of the K-means clustering algorithm.
Calculating the distance between each data object in set \(D\) and the \(k\) class cluster centroids, and assigning the data objects to the class clusters represented by the class cluster centroids with the closest Euclidean distance.
Count the data object information in each class cluster, take the mean value as the new class cluster center point, and update the class cluster center point information.
Iteratively perform steps 14, 15 until the algorithm class cluster centroids no longer change.
Output clustering results: \(k\) class clusters independent of each other: \(C=\left\{C_{1} ,C_{2} ,\cdots ,C_{k} \right\}\).
In the execution of DT-Kmeans algorithm, step 1 is the algorithm input and parameter determination stage. Step 2 to step 6 is the data preprocessing stage, where the data object distance information is first calculated and deposited into the distance distribution matrix, and the execution time of this process is roughly \(n\times n\times m\), where \(m\) is the dimension of the data object. Determine the \(Eps\) neighborhood parameter \(\eta\), the process execution time is roughly: 1. For the distance distribution matrix containing \(n\) rows of data, take out the \(\eta\)th smallest distance parameter \(d\left(x_{i\eta } \right)\) in each row to get the distance array \(D_{\eta }\), the process execution time is roughly: \(n\times n\times \eta\). Determine the neighborhood parameter \(Eps\) from the distance array \(D_{\eta }\), the process execution time is roughly: \(n\). For the data objects in the dataset, based on the statistical density information of the neighborhood parameter Eps, the execution time of the process is roughly: \(n\times n\) Steps 7 to 13 are the initial class cluster centroid selection phase, where the first initial class cluster centroid is randomly selected, and the execution time of the process is roughly: 1, followed by the probabilistic selection of the \(k-1\) class cluster centroids, and the execution time of the process is roughly \(k\times k\times n\). Steps 14 to 16 are the dataset clustering phase, assuming that the K-means algorithm is executed with an iteration number of 1, the execution time of the process is roughly: \(1\times k\times m\times n\). The computation time of the entire DT-kmeans algorithm is roughly: \(n\times n\times (m+n+1)+1\times k\times m\times n+n\). The clustering results of the dataset are output in step 17. Typically, all sizes of \(m,\eta ,k\) are much smaller than \(n\), so the time complexity of the DT-kmeans algorithm is \(O\left(n^{2} \right)\).
The execution of DT-kmeans algorithm is able to respond well to the denseness of the space near the data objects, which reduces the probability of the algorithm falling into the local optimal solution. It improves the clustering quality of the K-means algorithm and the stability of the clustering results.
The evaluation of basketball teaching results in colleges and universities is of great significance to the quality of physical education teaching in colleges and universities and the improvement of college students’ sports literacy. This paper obtains the relevant data of basketball teaching in colleges and universities through a survey questionnaire, the survey object is a college or university to choose the basketball class and the successful completion of the students, the survey questionnaire set up six survey items, respectively, the level of physical fitness, the level of basic basketball technology, basketball theory level, the willingness to learn basketball, the ability to work together as a team and satisfaction with the teaching method. Each item is scored out of ten, and each has a standard value of attainment (0-1), below the standard value of attainment means that the student’s ability in this area is weak. The total score is 60 points. Table 1 shows the items and attainment values of this questionnaire.
| Investigation Item | Completion Criteria | |
| 1 | Physical Level | 0.75 |
| 2 | Basic Basketball Skill Level | 0.80 |
| 3 | Theoretical Level Of Basketball | 0.70 |
| 4 | Willingness To Learn The Game Of Basketball | 0.75 |
| 5 | Teamwork | 0.65 |
| 6 | Satisfaction With Teaching Methods | 0.70 |
A total of 350 questionnaires were distributed in the survey and 312 valid questionnaires were retrieved, and finally 300 questionnaire results were retained after data preprocessing as cluster analysis data.
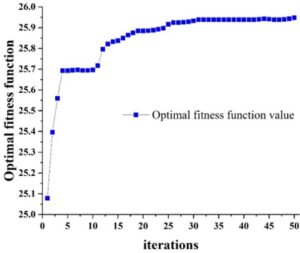
DT-kmeans clustering process: Figure 2 depicts the iterative trajectory of the DT-kmeans clustering analysis. Notably, upon the completion of the fourth generation of clustering, the fitness function of the DT-kmeans algorithm attains its initial peak value. However, instead of immediately converging, the algorithm continues to explore, seeking the absolute maximum of the fitness function until approximately the 31st iteration, whereupon it finally converges. This progression exemplifies the salient features of the DT-kmeans clustering algorithm: its rapid convergence and comprehensive global optimization search. Notably, it avoids premature convergence to local extrema, ensuring that the clustering ultimately converges to the global optimum.
Clustering Results Analysis: Table 2 presents the outcomes of the DT-kmeans algorithm’s clustering process, along with the count of distinct clustering samples. The findings indicate that, within the six-dimensional sample space, the DT-kmeans algorithm, after multiple experimental iterations, achieved optimal results with three class centroids. Furthermore, the average values of the six surveyed indicators across these three categories were used to categorize basketball course learners into three distinct types, based on the evaluation of teaching effectiveness in basketball classes as measured by these six indicators.As evident from the table, 71.3% of basketball course students fall into the second category, indicating that the overall teaching effect of the current college basketball course is moderate. The first type of students comprises 18% of the total sample and exhibits exceptional physical fitness, advanced basketball skills and theoretical knowledge, a strong proclivity for learning basketball, superior teamwork abilities, and high satisfaction with the current teaching methods. Conversely, the third group constitutes only 10.7% of the sample and displays weak physical fitness, a lack of basic basketball skills and theoretical knowledge, diminished teamwork abilities, low motivation for learning basketball, and dissatisfaction with the current college basketball teaching methods.
| First species | Second species | Third species | |
| Physical level | 0.8975 | 0.7729 | 0.6933 |
| Basic basketball skill level | 0.9036 | 0.8095 | 0.7523 |
| Theoretical level of basketball | 0.8431 | 0.7260 | 0.6508 |
| Willingness to learn the game of basketball | 0.9172 | 0.7642 | 0.6897 |
| Teamwork | 0.7934 | 0.6823 | 0.6041 |
| Satisfaction with teaching methods | 0.8563 | 0.7157 | 0.6539 |
| Sample size | 54 | 214 | 32 |
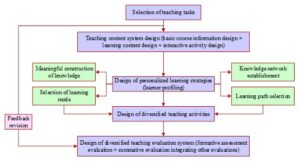
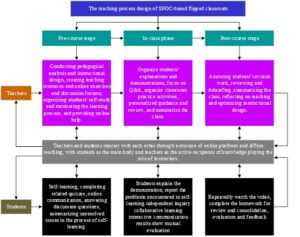
According to the results of the clustering above, the current basketball teaching model cannot be fully satisfied with the students’ continued demand. Based on the data, this paper puts forward the strategy of teaching innovation from three stages. The implementation of the SPOC teaching model comprises three distinct phases: the pre-class phase, where students engage in preliminary learning via the internet to gain an understanding of the class content and arrive in class with questions; the in-class phase, wherein students collaborate within the classroom to communicate and resolve issues, thereby achieving mastery of each knowledge point; and the post-class phase, during which students engage in group learning outside the classroom to facilitate knowledge enhancement. Figure 3 presents the framework diagram outlining the construction of the SPOC-based teaching model, encompassing the design of the teaching content system, learning strategies, teaching activities, and the teaching evaluation system.
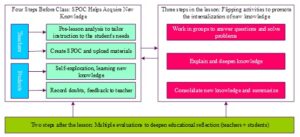
The specific idea of this teaching mode is that learners on the SPOC platform can watch short and concise teaching videos from famous schools and teachers, participate in discussions and exchanges, interact effectively with teachers, and get automated feedback after completing assignments on the platform. In addition, the physical classroom gives students a personalized learning experience, followed by review and consolidation, which continuously strengthens their mastery of knowledge. Figure 4 shows the idea diagram of SPOC teaching model, which includes four steps before class, three steps during class and two steps after class, so it is referred to as the “four-three-two model”.
The traditional way of teaching usually consists of five stages: beginning, preparation, basics, ending and reflection. This section combines the results of the analysis in section 2.3 and still adopts the four steps of teaching in the traditional classroom.Figure 5 shows the step diagram of the new model, which is divided into four steps: preparation for teaching, independent learning before class, practicing and correcting errors during class, and consolidation after class.
Preparation serves as the cornerstone for implementing the teaching mode. Teachers ought to select suitable learning platforms, establish classes, and, prior to two days before the commencement of the class, develop online teaching resources and assessment methodologies tailored to students’ needs, based on the course content, learning objectives, and key points. This enables students to engage in effective learning. Subsequently, the teacher informs students of the course content and requirements by disseminating notifications via the microblogging group. Additionally, students are instructed on how to utilize the learning platform proficiently, ensuring their seamless navigation through the platform.
In this stage, the teacher uploads the produced video, courseware, PPT, images, and other materials onto the learning platform, where students learn by watching and completing relevant quizzes. The discussion forum is utilized for students to deliberate on problems and engage in mutual communication, thereby fostering their independent learning capabilities. During this phase, students have the flexibility to repeat, adjust, and view the content at a slower pace, allowing for a preliminary comprehension of the technical movements. Simultaneously, the teacher monitors students’ learning progress in real-time and promptly addresses issues raised in the discussion area, encouraging peer-to-peer communication to aid in students’ knowledge internalization.
Contrary to traditional teaching methodologies, teachers allocate a significant portion of time for students to engage in practice, tailored to their individual understanding during the independent learning stage. Teachers emphasize crucial and challenging aspects and subsequently facilitate and organize student practice, incorporating cooperative and group activities to encourage communication and enhance mastery of technical movements. However, given that students’ preliminary understanding of technical movements may be ambiguous, they may superficially mimic movements without fully comprehending their nuances. Consequently, there exists a generalization phase in the learning of technical movements. Teachers must intervene in this process, offering corrections and guidance to assist students in distinguishing and consolidating their skills. During this process, teachers guide students to communicate, identify issues, and showcase exemplary movement practices by select groups, fostering peer evaluation while also offering their own commentary on the group’s adherence to technical norms and advantages. Through the meticulous analysis of several incorrect movements, students discern commonalities and identify areas for improvement, thereby deepening their understanding of the skills. Throughout the practice sessions, teachers regularly circulate among students to reinforce their learning.
The consolidation stage of the class constitutes a pivotal aspect in fostering students’ exercise proficiency. The teacher ought to devise practice tasks tailored to the key concepts and difficulties encountered by students in their academic pursuits within the classroom context, and assign a completion timeframe. This enables the teacher to evaluate students’ performance accurately. Additionally, the inclusion of technical movement essentials, alongside notes and theoretical knowledge assignments, encourages students to revisit previous videos repeatedly, thereby facilitating the automation of motor skills.
To enhance the scientificity, rationality, and persuasiveness of this teaching mode in terms of students’ learning outcomes, a blend of developmental and summative evaluation is employed within the SPOC-based basketball flipped classroom model. Throughout the entire teaching process, which spans pre-class, in-class, post-class activities, and performance assessments, emphasis is placed on leveraging platform evaluations, teacher evaluations, student peer evaluations, and self-assessments. Furthermore, it is imperative to permit experts and teachers to evaluate the effectiveness of the adopted teaching mode, ensuring continuous improvement and optimization.
This section outlines the design and implementation of a 10-week basketball teaching experiment, aimed at assessing the influence of a novel SPOC-based college basketball teaching model on students’ learning effectiveness and willingness to learn, both prior to and subsequent to the experiment. The primary objective is to demonstrate the efficacy of this model in enhancing college basketball teaching. The experimental setting is situated within the College of Physical Education at a university in China, with 50 students each assigned to the experimental and control groups. The experimental group will be exposed to the new SPOC-integrated basketball teaching model, whereas the control group will continue with the conventional basketball teaching methods practiced in the institution.
To effectively assess the influence of the SPOC-based novel college basketball teaching model on students’ teaching experience, both prior to and subsequent to the teaching experiment, we conducted a comparative analysis of the experimental subjects’ physical fitness, fundamental basketball skills, and enthusiasm for basketball. This analysis encompassed measurements taken before the implementation of the model, and the specific outcomes of these tests are presented in Table 3.
| Test project | Experimental group | Control group | Value T | Value P |
| 50m run | 6.65\(\mathrm{\pm}\)0.37 | 6.72\(\mathrm{\pm}\)0.45 | -0.462 | 0.578 |
| Standing broad jump | 2.55\(\mathrm{\pm}\)0.14 | 2.52\(\mathrm{\pm}\)0.19 | -0.479 | 0.693 |
| Sit-and-reach | 12.37\(\mathrm{\pm}\)3.61 | 12.43\(\mathrm{\pm}\)2.98 | -0.761 | 0.726 |
| One minute shot from the free throw line | 4.32\(\mathrm{\pm}\)1.19 | 4.41\(\mathrm{\pm}\)1.33 | -0.296 | 0.685 |
| Interest in basketball | 17.23\(\mathrm{\pm}\)2.69 | 16.89\(\mathrm{\pm}\)3.01 | -0.467 | 0.568 |
The data presented in Table 3 demonstrate that, prior to the commencement of the experiment, no statistically significant difference (P \(\mathrm{>}\) 0.05) was observed between the experimental and control groups across three fitness tests: 50m running, standing long jump, and seated forward bending. This signifies that the physical fitness levels of the two groups of students were essentially comparable at baseline. Furthermore, the p-values associated with the pre-experimental comparison of one-minute free throw shooting results and basketball interest between the experimental and control groups were 0.685 and 0.568, respectively. These findings indicate that both groups exhibited comparable levels of fundamental basketball skills and interest in the sport prior to the intervention. In summary, the absence of significant disparities in physical fitness, basic basketball proficiency, and enthusiasm for basketball between the experimental and control groups aligns with the prerequisites for a valid controlled experiment.
Upon completion of the 10-week teaching period, the subjects underwent reassessment in terms of their physical fitness, fundamental basketball abilities, and enthusiasm for basketball. The outcomes of these reassessments are presented in Table 4.
| Test project | Experimental group | Control group | Value T | Value P |
| 50m run | 6.73\(\mathrm{\pm}\)0.24 | 6.74\(\mathrm{\pm}\)0.39 | -0.621 | 0.497 |
| Standing broad jump | 2.59\(\mathrm{\pm}\)0.11 | 2.54\(\mathrm{\pm}\)0.20 | 0.411 | 0.618 |
| Sit-and-reach | 12.68\(\mathrm{\pm}\)3.27 | 12.49\(\mathrm{\pm}\)2.86 | 0.284 | 0.649 |
| One minute shot from the free throw line | 6.57\(\mathrm{\pm}\)1.03 | 5.05\(\mathrm{\pm}\)1.29 | 2.138 | 0.026 |
| Interest in basketball | 19.46\(\mathrm{\pm}\)2.51 | 17.24\(\mathrm{\pm}\)2.99 | 2.343 | \(\mathrm{<}\)0.001 |
Table 4 reveals that the P-values for the experimental and control groups across the three fitness tests—50m running, standing long jump, and seated forward bending—remain above 0.05. Following ten weeks of instruction utilizing the novel SPOC mode, no statistically significant divergence in physical fitness is discernible between the two groups, indicating that, over this brief timeframe, the distinct teaching methodologies have had limited impact on altering students’ physical fitness levels. Notably, despite the P-values exceeding 0.05, an intriguing trend emerges when comparing pre-experiment P-values with those post-intervention. Specifically, students in the experimental group have surpassed those in the control group in terms of standing long jump and seated forward bending performance, suggesting that the experimental group’s physical fitness may indeed be superior and that the new teaching mode, when applied to basketball classes, holds promise for enhancing students’ physical fitness to some extent.
After 10 weeks of teaching experiments, a comparative analysis of the free throw line one-minute shooting test index results between the experimental group and the control group revealed a P-value of 0.026, which is less than 0.05. This statistical significance suggests that there exists a notable difference in the test index outcomes, indicating that the basketball teaching mode based on SPOC employed in this study is more efficacious in enhancing students’ basic basketball skill level compared to the traditional teaching mode.Furthermore, a comparative analysis of the interest in basketball, as assessed by the free throw line test, yielded a P-value less than 0.001, substantially below the threshold of 0.05. This marked statistical significance underscores a significant difference in the test index outcomes, suggesting that the SPOC-based basketball teaching mode is more adept at fostering students’ passion for the sport of basketball than the conventional teaching approach.
Utilizing the process of big data analysis, this paper employs the DT-kmeans clustering algorithm, an enhancement of the K-means algorithm, to conduct a clustering analysis of the prevailing basketball teaching landscape in colleges and universities. Subsequently, a novel model of college basketball teaching, grounded in the SPOC framework, is devised. The efficacy of this model is rigorously substantiated through a controlled testing regime.
The clustering algorithm employed categorizes the sampled students into three distinct groups. Notably, 71.3% of the basketball class students belong to the second category as per the cluster analysis results, while 18% of the students fall into the first category, and the remaining 10.7% constitute the third category. These findings indicate that, on an aggregate level, the teaching effectiveness of basketball classes in colleges and universities is positioned at a moderate standard.
Upon completion of the teaching experiment, a statistical analysis comparing the physical fitness levels of the experimental and control groups yielded a P-value of 0.497, indicating no significant difference between the two groups. In contrast, the P-values obtained from comparing the results of the one-minute shooting test at the free throw line and the interest in basketball between the experimental and control groups were both less than 0.05, signifying a notable difference. These findings suggest that, while the SPOC-based basketball teaching mode employed in this study does not significantly enhance students’ physical fitness levels in the short term, it is more effective in elevating their basic basketball skill proficiency and fostering a deeper appreciation for the sport compared to the traditional teaching approach.


