With the wide application of computers and other network devices and the surge of data volume, the analysis of large data volume has become an important part of data analysis [1], and high-dimensional data analysis is an important part of big data analysis [2]. Most of the high-dimensional data analysis systems are based on some systems to do some operations such as data screening and dimensionality reduction, and their view display is generally in the form of quantities of information, such as scatterplot matrix, parallel axes and so on [3,4].
Knowledge dissemination refers to the process of scientific and technological knowledge, skills, information, new ideas, etc. through the diffusion across space and time so that the sharing of knowledge and information, etc. is realized between different individuals [5,6]. Knowledge dissemination in the enterprise has its inherent regularity, accelerate the dissemination of enterprise knowledge, realize the effective sharing of knowledge in order to improve the efficiency of knowledge management, and effectively improve the core competence of enterprises [7,8].
In the environment of knowledge economy, knowledge dissemination is an important part of enterprise knowledge management, and effective knowledge dissemination can improve the competitiveness of enterprises [9]. Many scholars have expressed their own opinions on knowledge dissemination, but they mainly regard knowledge dissemination as a kind of interaction between knowledge owners and knowledge receivers, that is to say, when knowledge receivers recognize the lack of a certain kind of knowledge, through the interaction with knowledge owners, through a variety of channels to obtain the required knowledge, and be absorbed and applied in the process [10-12].
There is a lot of knowledge in the enterprise, but this knowledge can only realize its value if it is disseminated and used by people [13]. Knowledge dissemination can make the staff found and created knowledge, in the dissemination process by the need to use this knowledge of production, sales and research departments of the staff and practice, to play the economic value of knowledge [14], so that the productivity of its implied productivity into the reality of productivity, so as to produce significant economic benefits for the enterprise. It can be seen that the study of knowledge dissemination within the enterprise will greatly promote the enterprise’s knowledge management, so that enterprises can better utilize their potential to create greater economic benefits [15].
Literature [16] showed that the positive impact of technological knowledge acquisition is mainly reflected through economic performance and the positive impact of market knowledge acquisition is mainly reflected through environmental performance. Literature [17] collected data through interviews and review of information. It was found that there is a dynamic cyclic relationship among the three activities of knowledge transfer, network activities and scientific and technological activities, forming a “figure-of-eight” cyclic model. Literature [18] investigated whether and how CSR knowledge affects the financial performance of the European banking sector. Literature [19] showed that CSR is believed to mitigate the threat of knowledge leakage, in particular, CSR reduces the propensity of knowledge workers to join rival firms. Literature [20] proposes stewardship theory as a more sustained and powerful orientation to make business ethics more focused on organizational identity and knowledge management as a set of practices to support improved ethical behavior in organizations from an ethically driven perspective. Literature [21] states that the number of articles related to CSR and sustainability is growing steadily, with the main driving themes being CSR, sustainability and the environment. Literature [22] argues that there is a need to develop a broader ethical response to environmental sustainability, and that businesses seeking a sustainable future must combine economic development with ethical goals and scientific knowledge.
This paper is based on the formation of high-dimensional data visualization performance, the use of visualization technology to derive the dimensions of enterprise knowledge requirements, and the use of scatter pie chart matrix for enterprise knowledge visualization presentation. The concept of information entropy is introduced, and the data dimension importance evaluation algorithm using joint entropy is used to process the data for data dimension filtering visualization design. From the perspective of enterprise, discover the needs of high-dimensional data enterprise user cognition, and establish the high-dimensional data data visualization user cognition model. Propose a task demand-oriented enterprise knowledge dissemination model, and explore the strategy of knowledge dissemination and knowledge exchange within the enterprise. A simulation environment is set up to analyze the overall law of knowledge evolution in enterprise clusters and the influence of cluster initial conditions on knowledge growth, and the learning ability parameters are adjusted to explore the effect of intra-enterprise knowledge dissemination under different learning abilities.
High-dimensional data has high dimensionality and complex structure. Therefore, in order to be able to present the relationship between the various dimensions of the data, the distribution of values and the relationship between the data, and to achieve the purpose of analyzing data clustering, outliers, correlation analysis, etc., high-dimensional data must be presented using a special visualization method.
Currently, the research work on high-dimensional data visualization focuses on these three aspects, data statistical analysis, decision analysis and customer satisfaction.
Enterprise development is reflected through various economic indicators, which are analyzed from various economic data.
Economic data has these characteristics as follows:
Massive amount of attribute data with a wide variety.
Economic data need better storage tools.
Economic data need intuitive information mining tools.
The above characteristics of economic data are closely related to data visualization. Enterprises need to manage and analyze statistical data, provide simple and clear, intuitive graphic image information expression, convenient for different time and space data statistics and its analysis, provide users with more valuable statistical data. Therefore, it is the right time to apply high-dimensional data visualization to this field.
As it is difficult for people to understand the high-dimensional space, and at the same time, the number of dimensions of high-dimensional data is too large to be visualized with regular basic charts as in the case of low-dimensional data. Therefore, processing high dimensional data so that it can be displayed in low dimensional space while retaining complete information as much as possible has become a common operation for visualizing high dimensional data. Now the common methods are basically divided into two categories, spatial mapping method and icon method.
Spatial mapping method is one of the basic methods of high-dimensional data visualization. Its main idea is to map the information of high-dimensional data into low-dimensional space, so that it can present a visualization chart that is easy to understand and can be further analyzed.
The icon method belongs to the category of direct visualization techniques, i.e., techniques that apply visual elements directly to visualize the entire data set with little or no preprocessing. Unlike the spatial mapping method, the icon method represents multiple attributes of the high-dimensional data through different visual elements.
This paper proposes a high-dimensional data visualization method which can derive dimensions that match user knowledge and reorganize the data. At the same time, by visualizing the data using this paper’s extended high-dimensional data visualization presentation method based on scatterplot matrix Scatterplot Pie Chart Matrix, users can explore the data and discover new knowledge.
In order to better understand and interpret the data, this paper aims to derive dimensions that match the user’s knowledge. The aim of this paper is to combine the user’s known and unknown data to derive dimensions consistent with the user’s knowledge, and then use the derived dimensions to reorganize the data.
Deriving dimensions consistent with user knowledge
TSVMs algorithm is a direct push semi-supervised learning method. This learning method considers unlabeled sets together and then minimizes the classification error of unlabeled sets. At the same time, it can produce a numerical distribution that conforms to the user’s knowledge, thus organizing the data, in line with the goal that this paper is trying to achieve.
The basic idea of the algorithm is as follows, given a set of sample data, including labeled data samples \(\left(x_{1} ,y_{1} \right),\ldots ,\left(x_{n} ,y_{n} \right)\), and unlabeled data samples \(x_{1} {}^{*} ,x_{2} {}^{*} ,\ldots ,x_{n} {}^{*}\). Under the condition of linear differentiability, the learning process is shown in Equation (1). Where \(y_{1} {}^{*} ,\ldots y_{k} {}^{*}\) is the labeling of the unlabeled samples that the TSVMs algorithm needs to find, and \(<w,b>\) is the hyperplane that the TSVMs algorithm needs to find. \[\label{GrindEQ__1_} \left\{ \begin{array}{c} {\text{Transductive}{\rm \; }\text{SVM}{\rm \; }(\text{lin.sep.case}){\rm \; }} \\ {\text{Minimize}{\rm \; }\text{over}{\rm \; }\left(y_{1}^{*} ,\ldots ,y_{n}^{*} ,w,b\right)} {\frac{1}{2} \left\| w\right\| ^{2} } \\ {\text{subject}{\rm \; }\text{to}:{\rm \; }\forall _{i=1}^{n} :y_{i} \left[\overrightarrow{w}\cdot \overrightarrow{x_{i} }+b\right]\ge 1} \\ \quad\qquad\qquad{\forall _{j=1}^{k} :y_{j}^{*} \left[\overrightarrow{w}\cdot \overrightarrow{x_{j} }+b\right]\ge 1} \end{array} \right.\tag{1}\]
Under the condition of linear indivisibility, its learning process is shown in (2). Where \(y_{1}^{*} ,\ldots y_{k} {}^{*}\) is the labeling of unlabeled samples to be found by the TSVMs algorithm, while \(<w,b>\) is the hyperplane to be found by the TSVMs algorithm, \(\xi\) is the slack variable, and \(C\) and \(C^{*}\) are the penalty factors.The TSVMs optimize the objective function to reduce the occurrence of errors by introducing a penalty factor for unlabeled samples, and seeks to maximize the spacing while minimizing the errors. Eq. \[\label{GrindEQ__2_} \left\{\begin{array}{c} {\text{Transductive}{\rm \; }\text{SVM}({\rm \; }\text{non}{\rm \; }-{\rm \; }\text{sep.case}{\rm \; })} \\ {\text{Minimize}{\rm \; }\text{over}{\rm \; }\left(y_{1}^{*} ,\ldots ,y_{n}^{*} ,\overrightarrow{w},b,\xi _{1} ,\ldots ,\xi _{n} ,\xi _{1}^{*} ,\xi _{k}^{*} \right):}\\\frac{1}{2}\left\| w \right\|^2+C\sum_{i-0}^{n}\xi_i+C\sum_{j-0}^{k}\xi^*_j\\ {\text{subject}\;\; \text{to}}:\forall ^n_{i-1}:y_i\left[ \overrightarrow{w}.\overrightarrow{x_i}+b \right]\ge 1-\xi_i\\ \quad\qquad\qquad\forall ^k_{j-1}:y^*_j\left[ \overrightarrow{w}.\overrightarrow{x^*_j}+b \right]\ge 1-\xi^*_i\\ \forall ^n_{i-1}:\xi_i>0\\ \forall ^k_{j-1}:\xi^*_i>0 \end{array} \right.\tag{2}\]
TSVMs can obtain the numerical distribution of user-oriented dimensions corresponding to the projection function by solving the optimization problem shown above.
Extended Visualization Presentation Method – Scattered Pie Chart Matrix
The aim of this paper is that the view can reflect the user’s perception about different aspects of the data and explore the relationship between the user’s known data and unknown data, and the relationship between the unknown data and the derived dimensions. Therefore, this paper proposes a high-dimensional data visualization presentation method Scatter Pie Chart Matrix. Scatter Pie Chart Matrix is an extension of Scatter Chart Matrix and Pie Chart. It can show the relationship between data and dimensions and reflect the user’s perception of different aspects of the data.
This chapter firstly introduces the concept of information entropy, while the joint entropy, conditional entropy and information gain derived from information entropy are introduced. Then it introduces the information gain curve and focuses on the dimensional importance evaluation algorithm based on joint entropy proposed in this paper, and also describes the visualization scheme after using this algorithm.
Information entropy and other common entropies
To facilitate further understanding of information entropy, the concept of self-information is proposed. Self-information measures the amount of information contained in a random event. The formula for self-information is shown in (3): \[\label{GrindEQ__3_} I\left(x_{{\rm i}} \right)=-\log p\left(x_{i} \right) .\tag{3}\]
Information entropy can be understood as a measure of the uncertainty of all random events. The formula for information entropy is shown in (4): \[\label{GrindEQ__4_} H(X)=-\sum _{i=1}^{n}p \left(x_{i} \right)\log p\left(x_{i} \right) .\tag{4}\]
Self-information represents the amount of information about a random event \(p\left(x_{i} \right)\) and cannot represent the total confidence measure of a collection of events \(X\). \(H(X)\) is known as the entropy of a collection of random variables \(X\), which is a measure that represents the uncertainty of a random variable, and is the expectation of the amount of information generated by all possible events.
The joint entropy is the amount of information needed to describe a pair of random variables and expresses the uncertainty of the system when two events occur simultaneously. The joint quantity expresses the random distribution of a binary variable, and the concept of joint entropy can be further expanded when there are multiple discrete random variables, which is advantageous when dealing with multidimensional data. The formula for the joint entropy is shown in (5): \[H(X,Y)=-\sum _{x,y}p (x,y)\log p(x,y),\] \[\label{GrindEQ__5_} =-\sum _{i=1}^{m}\sum _{j=1}^{n}p \left(x_{i} ,y_{j} \right)\log p\left(x_{i} ,y_{j} \right) .\tag{5}\]
Conditional is describes the uncertainty of random variable \(Y\) under the condition that random variable \(X\) is known. The formula of the conditional entropy can be obtained from the formula of the joint entropy and the formula of the information entropy, and the formula of the conditional entropy is shown in (6): \[\label{GrindEQ__6_} \begin{aligned} H(Y,X) &= H(X,Y) – H(X) \ \\&= -\sum_{i=1}^{m}\sum_{j=1}^{n}p(x_{i},y_{j})\log p(x_{i},y_{j}) \\ &\quad- \left(-\sum_{i=1}^{m}p(x_{i})\log p(x_{i})\right) \ \\&= -\sum_{i=1}^{m}\sum_{j=1}^{n}p(x_{i},y_{j})\log p(y_{j}|x_{i}). \end{aligned}\tag{6}\]
Information gain, also known as mutual information, is denoted as \(g(Y,X)\) for the information gain between discrete random events \((Y,X)\). Its mathematical expression is obtained by subtracting the information entropy of the random variable \(Y\) from the conditional entropy of \(Y\) under the condition that the random variable \(X\) is known, and the mathematical expression for the information gain is shown in (7): \[\label{GrindEQ__7_} {\rm g}(Y,X)=H(Y)-H(Y|X) .\tag{7}\]
Data dimension filtering methods
Joint entropy-based dimensional importance evaluation algorithm
A joint entropy based data dimension importance evaluation algorithm is applied to quantify the contribution of individual dimensions to the overall uncertainty, thus helping the user to select subsets from large-scale datasets.
Let a dataset with \(N\) dimension and \(K\) samples be constructed with the structure of a \(N*K\)rd order matrix. The information theory measure is applied to the \(N*K\)th order matrix by considering it as 5 random variables.
In information theory, the joint entropy \(H\left(X_{1} ,X_{2}\right.\) \(\left.,\ldots ,X_{n} \right)\) quantifies the total amount of uncertainty in a system consisting of a set of random variables \(X_{1} ,X_{2} ,\ldots ,X_{n}\). In order to calculate the contribution made by a single variable \(X_{n}\) of them to the uncertainty of the system, it can be obtained by calculating the difference \(D\left(X_{n} \right)\) between the joint entropy of all the variables and the joint entropy of the remaining variables after the removal of \(X_{n}\), as shown in (8): \[\label{GrindEQ__8_} D\left(X_{n} \right)= H\left(X_{1} ,X_{2} \ldots ,X_{n} \right) \]\[-H\left(X_{1} ,X_{2} \ldots ,X_{n-1} \right), \tag{8}\] where \(D\left(X_{n} \right)\) quantifies the contribution of variable \(X_{n}\) to the overall uncertainty of the variable system. The appearance of \(H\left(X_{1} ,X_{2} ,..,X_{n} \right)\) in Eq. (8), i.e., the joint entropy of variable \(X_{1} ,X_{2} ,\ldots ,X_{n}\), can be calculated using the following formula, shown in (9):
\[\begin{aligned}\label{GrindEQ__9_} H\left(X_{1} ,\ldots ,X_{n} \right)=-\sum _{x_{1} \in X_{1} }\ldots \sum _{x_{1} \in X_{n} }p \left(x_{1} ,\ldots ,x_{n} \right)\log \left(p\left(x_{1} ,\ldots ,x_{n} \right)\right), \end{aligned}\tag{9}\] where \(p\left(x_{1} ,\ldots ,x_{n} \right)\) is the joint probability density of variable \(X_{1} ,\ldots ,X_{n}\), which can be computed by constructing a joint histogram.
Visualization design
After preprocessing the data using the joint entropy-based dimensional importance evaluation algorithm, in order to facilitate the user to filter the data dimensions and pick the analysis path, the data dimension filtering interface is designed based on the strategy of coordinated correlation multi-view.
The specific idea of this process is: firstly, the requirement from the definition threshold is based on the distance between the dimensions layout and the calculated dimensions obtained. If the distance between the dimensions is less than the threshold defined by the user, they are connected and eventually form one or more unmapped. Therefore, if the threshold of the user Settings is larger, more connections will be generated, and the more nodes that will be included in the unindicated map. On the other hand, if the threshold of the user Settings is smaller, the smaller the generated connection, the smaller the resulting junction will be
Decrease, but the correlation of these nodes is bound to be high. Next, the nodes of the undirected graph will be numbered, the collection of all nodes, and the collection of the connection nodes of each node, and then entered into the brent-kerbosch algorithm program, and the great mass detection. According to the programming of the algorithm, the output of the different number nodes and the large mass of the nodes in the final sequence, the nodes in the large group, the dimension points, form a subset of the dimensions.
The visual information presented in the high-dimensional data visualization interface is complex and varied, and for the user, there are differences between the information displayed and the information decoded by the user’s brain. Therefore, this chapter focuses on the user’s point of view, studies the problems encountered by users in the process of reading data and the inconvenience of using it, and explores the two perspectives of the information processing and decoding process of the high-dimensional data visualization interface as well as the process of typical task execution. The user’s cognitive needs are studied to discover the cognitive needs of high-dimensional data users and establish a user cognitive model for high-dimensional data visualization.
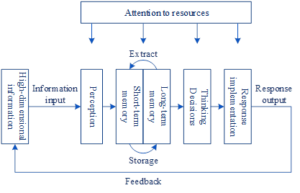
According to the information processing mechanism, brain information processing mainly includes four parts: perception system, control system, memory system and reaction system. For high-dimensional data visualization, the user divides the main task into a number of subtasks separately. The cognitive process of high-dimensional data visualization is shown in Figure 1.
First, users acquire interface features through receptors.
Then, attention etc. is applied to acquire relevant features and store them to short-term memory.
Secondly, relevant patterns are extracted from the long term memory to recognize the information and make predictions and judgments through thought decisions.
Finally, the formulated method is transmitted to the effector, thus controlling the effector to execute the action. Afterwards, the changes in the interface information are fed back to the user with new features for the next round of the process, which is repeated until the task is completed. In the whole process, the acquisition of information directly determines the results of thinking decisions and judgments.
Through the analysis of user cognitive needs of high-dimensional data visualization interface, the high-dimensional data visualization user cognitive model is constructed. The high-dimensional data visualization user cognition model is shown in Figure 2.
The model takes the user’s general cognitive stages as clues, i.e., the four cognitive stages of perception, attention, memory and thinking, and sorts out the cognitive characteristics of each stage. Based on the cognitive characteristics, it also analyzes the problems encountered by users when they are acquiring information in the high-dimensional data visualization interface, and puts forward the cognitive needs.
The user cognitive needs are supplemented with the task execution process, and the user cognitive needs based on the user cognitive process and based on the task type are summarized. Among them, the relationship between the visual presentation of high-dimensional data interface and user cognitive needs explains the reasons for users’ problems in the process of reading information of high-dimensional data visualization, which is a factor to be considered by designers when they carry out the design of high-dimensional data visualization, and it provides a reference to troubleshooting the problems of the interface of high-dimensional data visualization design and offers guidance for its design.

The elements of knowledge dissemination within the enterprise include:
Knowledge discoverers and disseminators within the enterprise
Knowledge receivers and users within the enterprise
Intra-enterprise knowledge characteristics and channels of knowledge dissemination
The knowledge dissemination environment within the enterprise
Effectiveness of knowledge dissemination within the enterprise
To have a complete understanding of knowledge diffusion requires recognizing the fact that the process of knowledge diffusion is ultimately a person-to-person process and is interactive and dynamic. Based on this idea and on the various factors mentioned above, a conceptual model of knowledge diffusion within the enterprise is proposed. The conceptual model of knowledge dissemination within the enterprise is shown in Figure 3.
Firstly, the knowledge discoverer discovers or creates new knowledge by himself or in cooperation with others, and then passes it to the knowledge disseminator through certain dissemination channels. The knowledge disseminator passes it to the knowledge receiver who has the need for this knowledge, and the knowledge receiver then passes it to the knowledge user who needs to apply this knowledge.
In the whole transmission process, the knowledge receiver will also feedback on the whole transmission process. For example, whether there is any interference in the transmission, whether the content of the transmission is comprehensive and complete, and so on.

Organizations often face a variety of tasks of different nature in their daily operations. Tasks can be categorized into two types based on the complexity of task requirements. One is simple tasks and the other is complex tasks. Tackling tasks within an organization are typically complex tasks, and for the knowledge requirements of such complex tasks, an attempt is made to use a requirements matrix \(TR\) to approximate the extent to which Task \(y\) requires a single piece of knowledge and a variety of cross-cutting knowledge: \[\label{GrindEQ__10_} TR(y)=\left[\begin{array}{ccccc} {tr_{11} (y)} & {tr_{12} (y)} & {tr_{r_{13} } (y)} & {\ldots } & {tr_{1,} (y)} \\ {} & {tr_{22} (y)} & {tr_{23} (y)} & {\ldots } & {tr_{2n} (y)} \\ {} & {} & {\vdots } & {\ldots } & {\vdots } \\ {} & {} & {} & {tr_{n-1,n-1} (y)} & {tr_{n-1,n} (y)} \\ {} & {} & {} & {} & {tr_{nn} (y)} \end{array}\right]_{n\times n} ,\tag{10}\] where \(0<r_{ij} (y)<1\) denotes the extent to which task \(y\) requires cross knowledge of the two types of knowledge \(i\) and \(j\). When \(i=j\), \(tr_{i} (y)\) denotes the extent to which task \(y\) requires a single piece of knowledge \(i\), and \(1\le i,j\le n\) denotes the type of knowledge.
As with the individual knowledge stock representation, the multiple knowledge possessed by each member \(x\) of the team is represented as a \(n\)-dimensional knowledge vector \(K(x)\): \[\label{GrindEQ__11_} K(x)=\left[k_{1} (x),k_{2} (x),\cdots ,k_{n} (x)\right],0<k_{i} (x)<1,\tag{11}\]
where \(i=\{ 1,2,\cdots ,n\}\) denotes the different knowledge categories and \(n\) is the total number of knowledge categories.
From the perspective of knowledge synergy, team knowledge is essentially the synergistic knowledge generated by members of different departments through “horizontal” knowledge sharing in the course of cooperation, integrating their respective domain knowledge to meet the multiple knowledge needs of the task. Specific knowledge synergy generation rules and matching rules are as follows:
Knowledge Co-generation Rule
It is stated in the study of enterprise alliances cooperating on knowledge innovation tasks that when two enterprises \(p\) and \(q\) cooperate, each type of knowledge \(i\) they possess will be combined separately to generate a joint knowledge stock \(k(p,q)\), which can be written as: \[\begin{aligned} \label{GrindEQ__12_} k_{i} (p,q)= (1-\theta )\min \left\{k_{i} (p),k_{i} (q)\right\} +\theta \max \left\{k_{i} (p),k_{i} (q)\right\} . \end{aligned}\tag{12}\]
(12) reveals the nature of collaborative knowledge generation under the demand of knowledge innovation tasks.
Referring to the principle of (12), the synergistic knowledge stock generated by team member \(x\) after integrating the two types of knowledge \(i\) and \(j\) that he/she possesses is defined as \(k_{ij} (x)\): \[\begin{aligned} \label{GrindEQ__13_} k_{ij} (x)= (1-\theta )\min \left\{k_{i} (x),k_{j} (x)\right\} +\theta \max \left\{k_{i} (x),k_{j} (x)\right\}. \end{aligned}\tag{13}\]
In this paper, we argue that the size of \(k_{ij} (x)\) is simultaneously related to member \(x\)’s mastery of the two knowledge categories, but depends more on the knowledge category with low knowledge stock.
Team knowledge and task demand matching rule
It has been shown that the team has the efficacy of “\(1+1>2\)” in accomplishing the task. Based on this fact, the team knowledge stock \(tk_{ij}\) is defined as the expansion of the mean value of the synergistic knowledge stock of all members within the team to a certain extent, and \(\varepsilon\) is the coefficient of knowledge stock expansion. That is: \[\label{GrindEQ__14_} tk_{ij} =\frac{1+\varepsilon }{M} *\sum _{x\in M}k_{ij} (x) .\tag{14}\]
The matching rule between team knowledge and task requirement knowledge is: \[\label{GrindEQ__15_} h_{ij} =tk_{ij} -tr_{ij} .\tag{15}\]
In the above equation, if the stock \(tk_{ij}\) of each type of knowledge of the team is greater than or equal to the corresponding value \(tr_{ij}\), i.e. \(h_{i} \ge 0\), in the task knowledge requirement matrix, the task requirement is considered to be satisfied and the task is completed. Otherwise, the team members need to continue to exchange and accumulate knowledge, improve their own knowledge level, and finally complete the team task together.
Knowledge dissemination rules
In order for team members to reach a consensus on the understanding of the team’s task requirements and task objectives, and to form team knowledge, it is necessary to continuously communicate and accumulate knowledge among team members. For each type of knowledge \(i\) of two members \(x_{p}\) and \(x_{q}\) of the team, after the occurrence of knowledge dissemination, the individual member’s knowledge stock can be mountain its previous moment of knowledge stock and the stock of newly received knowledge at that moment cumulative to get, that is: \[\begin{aligned} k_{i}^{t+1} \left(x_{p} \right)=&k_{i}^{t} \left(x_{p} \right)+\lambda _{i} \left(x_{p} \right)*r_{pq} \\&*\left(k_{i}^{t} \left(x_{q} \right)-k_{i}^{t} \left(x_{p} \right)\right),{k_{i}^{t} \left(x_{q} \right)\ge k_{i}^{t} \left(x_{p} \right)}, \end{aligned}\] and \[\begin{aligned} \label{GrindEQ__16_} k_{i}^{t+1} \left(x_{q} \right)=&k_{i}^{t} \left(x_{q} \right)+\lambda _{i} \left(x_{q} \right)*r_{pq} \\&*\left(k_{i}^{t} \left(x_{p} \right)-k_{i}^{t} \left(x_{q} \right)\right), {k_{i}^{t} \left(x_{q} \right)<k_{i}^{t} \left(x_{p} \right)} \end{aligned}\]
Compared with knowledge dissemination rules, knowledge dissemination among team members under task demands is more positive and proactive. Therefore, the conditions under which knowledge dissemination behavior occurs are set as follows: \[\label{GrindEQ__17_} \max \left\{n\left(x_{p} ,x_{q} \right),n\left(x_{q} ,x_{p} \right)\right\}>0 .\tag{16}\]
In Equation (16), \(n\left(x_{p} ,x_{q} \right)=\# \left\{i:k_{i} \left(x_{p} \right)>k_{i} \left(x_{q} \right)\right\}\) denotes the number of knowledge categories in which team member \(x_{p}\) has an advantage over \(x_{q}\). Similarly, \(n\left(x_{q} ,x_{p} \right)=\# \left\{i:k_{i} \left(x_{q} \right)>k_{i} \left(x_{p} \right)\right\}\) denotes the number of knowledge categories in which team member \(x_{q}\) has an advantage over \(x_{p}\).
Knowledge exchange strategy
As a matter of fact, team members will not only consider their own interpersonal network when choosing who to exchange knowledge with. And they will also consider the knowledge level of each member in the team and analyze with whom they can learn more knowledge through knowledge exchange. Therefore, there are two kinds of communication strategies, interpersonal relationship-based and knowledge-based, in the process of knowledge exchange among team members.
In order to comprehensively examine the dynamic process of knowledge diffusion within business clusters and the factors that may influence it, the following three sets of scenarios are examined in this paper. In this paper, the validity of the system is verified by case analysis, and the results show that the system can effectively assist the user to analyze the uncertain data.
Scenario 1: Number of firms \(M=12\), number of customers \(N=60\), knowledge dimension \(w=5\), initial firm knowledge stock \(\mathrm{<}\) 0.8, initial demand knowledge vector level \(\mathrm{>}\) 0.6, all firms adopt randomly selected customer strategies. Examine the changes in average knowledge stock and knowledge dispersion of growing clusters over time.
The setting of the number of firms \(M<N\) is in line with the reality that there are far fewer service providers than service demanders in the current market, and the initial firms and initial demand knowledge vector levels are set to ensure that the firms do not fail to find tasks that can be accomplished when they first enter the market, i.e., to ensure that the source of motivation exists.
Scenario 2: Other parameters Scenario 1, examining the changes in the average knowledge stock of the cluster at the number of customers \(N=30\), 60 and 120.
Scenario 3: Other parameters are the same as in Scenario 1, examining the changes in the average knowledge stock of the cluster at knowledge dimensions \(w=2\), 4 and 6.
Evolution of cluster average knowledge stock
The curve of 12 clusters’ average knowledge stock is shown in Figure 4, the cluster’s knowledge stock shows an overall increasing trend over time, but its growth rate is getting slower and slower, and there is a fluctuation of the knowledge stock growth trend at t=50, and the fluctuation interval of the 12 clusters’ average knowledge stock growth is [0.65, 0.9], and the growth rate is slowed down at t=150, i.e., the knowledge dissemination efficiency within the clusters is getting lower and lower .
In some moments, the knowledge stock curve may even show a stagnant state, at which time it can be approximated that there is no dissemination phenomenon occurring within the current cluster. From a macroscopic point of view, this stagnation state will be maintained over time and last longer and longer. That is to say, the later the cluster develops, the less obvious its spreading effect becomes.
Although the 12 clusters are of the same size and scale, the final average knowledge stock of the clusters is different because of the different initial knowledge status of each of them, coupled with the complexity and randomness of choosing a path in the market, so the final average knowledge stock of the clusters is also different in height. However, it can be seen that the internal propagation of clusters will eventually fall back and converge to a specific value, i.e., the internal propagation terminates. This also shows that there are limitations if clusters only rely on mutual learning of internal enterprises, and they should actively broaden the market, appropriately introduce external stimuli, maintain the consistency between the small local knowledge network of clusters and the big knowledge network of the world, and at the same time, encourage the internal enterprises in the clusters to carry out knowledge innovation in order to form a good momentum of sustainable development.

Evolution of knowledge dispersion of clusters
The knowledge dispersion curves of the 12 clusters are shown in Figure 5, and the individual knowledge dispersion shows large fluctuations in the [0,50] interval, and the knowledge deviation can reach 0.09.
The dispersion curves obtained from each simulation and the average dispersion curve of 12 times in the upper right corner show that the cluster knowledge dispersion will show a violent oscillation state in the early stage, at this time, the knowledge difference of the clusters is suddenly large and small, and in the oscillation, it quickly reaches a certain maximum value. After reaching the highest value, the curve will gradually fall back, and with the growth of time oscillation and tends to flatten, and eventually converge to a certain value. This final value is the final degree of knowledge dispersion of the cluster.
It can be seen that in the early stage of cluster formation, cooperation is frequent and dissemination is also frequent, which results in the distribution of cluster knowledge is also varied. There must be a part of the enterprise by virtue of the innate conditions or opportunities to get the development of the first, these fast-growing enterprises in the market by virtue of their respective knowledge advantage is always more likely to win the customer, the formation of a virtuous cycle.

To eliminate uncertainty, each curve in the figure is the average value obtained by calculating after at least one simulation, and the average knowledge stock under different parameters is shown in Figure 6. Figures 6(a) and 6(b) show the average knowledge stock under different number of customers and different knowledge dimensions, respectively.
In Figure 6(a), when \(t>30\), the larger the number of customers \(N\), the higher the average knowledge stock, i.e., the larger the market, the more favorable the knowledge stock. This is because the size of the market represents the number of potential customers, the size of the business scope, or the vastness of the development space of the enterprise. The larger the market is, the more conducive to the long-term growth of the whole cluster.
In Figure 6(b), as a whole, the highest knowledge stock occurs at knowledge dimension \(w=6\), while at either \(w=2\) or \(w=3\), the knowledge dimension is not favorable for knowledge stock. Too low a dimension means that firms in the cluster have a single type of technology or resource, and the types of business and the nature of the firms are similar across firms.

In order to explore the impact of different parameters on the dissemination of tacit knowledge in enterprises, the comparative experimental method as well as the enumeration method are used. In the initial value state, the model is simulated, and when a single variable is changed to keep other parameters unchanged, the result can be used as a comparative reference value, which can be used to derive the effect of the parameter on tacit knowledge dissemination.
The first choice is to measure the impact of different parameters on the effect of knowledge dissemination. In this paper, the effect of knowledge dissemination is measured by the number of new knowledge sources. Next, the impact of each parameter is tested one by one.
The experiment mainly centers on the impact of learning ability on knowledge dissemination effect. Learning ability represents the individual’s ability to learn, understand, and absorb new knowledge, and its initial value is 0.2, which indicates the general learning and absorption level, now increase or decrease the initial value, and observe and record the changes in the model output results. The effect of learning ability on the effect of knowledge dissemination can be seen through the comparison experiment.
Statistical simulation program running data and results shown in Table 1, simulation running data show that when the incentive coefficient is 0.9, the dissemination effect is 95, and when the learning ability is 0.9, the dissemination effect reaches 235, the dissemination effect is significant.
| Excitation coefficient | Propagation effect | Learning ability | Propagation effect |
|---|---|---|---|
| 0.2 | 85 | 0.2 | 61 |
| 0.3 | 88 | 0.3 | 73 |
| 0.4 | 89 | 0.4 | 98 |
| 0.5 | 92 | 0.5 | 121 |
| 0.6 | 95 | 0.6 | 165 |
| 0.7 | 98 | 0.7 | 183 |
| 0.8 | 96 | 0.8 | 210 |
| 0.9 | 95 | 0.9 | 235 |
Thirty effective simulations of the initial model were conducted to explore the general laws and forms of enterprise knowledge dissemination in the initial state. In the initial model, the average dissemination time of enterprise knowledge is 400s, and the quantitative relationship of each subject is immunizer\(\mathrm{>}\)disseminator\(\mathrm{>}\)learner with the number of nodes unchanged. Subsequently, keeping the other parameters of the model unchanged and changing the value of one parameter, a comparative experiment was conducted using the enumeration method in an attempt to identify the key factors in the enterprise that affect the efficiency and speed of knowledge dissemination. Through the analysis of the simulation results, it is found that the incentive coefficient of the organization and the learning ability of the subject have an impact on knowledge dissemination.
The subject’s learning ability also has an effect on knowledge dissemination in the enterprise. The relationship between the influence of learning ability on knowledge dissemination is shown in Figure 7. The influence of learning ability on the enterprise’s tacit knowledge dissemination is positive. When the propagation speed is in the interval of [0.8,0.9], the propagation effect reaches the maximum value. With the increase in the learning and absorption capacity of organizational members, the effect and speed of knowledge dissemination increases, especially the effect of knowledge dissemination increases significantly. This is due to the increase in learning ability, shorten the process and cycle of knowledge digestion and absorption, and improve the efficiency of knowledge dissemination.
It can be learned from this, how the knowledge disseminated and shared in the organization can be innovative, the key lies in the ability of employees to learn and absorb knowledge. Only on the basis of digesting and absorbing the existing knowledge system can we “innovate”. The learning ability of members is the basis of organizational knowledge innovation, enterprises should seize this key point to improve the level of knowledge learning of employees themselves.

This paper utilizes the visual presentation form of high-dimensional data, combines the data dimension filtering method of information entropy for enterprise knowledge visualization, and constructs the user cognitive model of high-dimensional data visualization. Utilizing the elements of intra-enterprise knowledge dissemination, it carries out the research on task demand-oriented enterprise knowledge dissemination. Set up a simulation environment to analyze the development of knowledge dissemination within enterprises in clusters.
When the number of enterprises \(M=12\), the number of customers \(N=60\), the knowledge dimension \(w=5\), the initial enterprise knowledge stock \(\mathrm{<}\)0.8, the initial demand knowledge vector level \(\mathrm{>}\)0.6, and all the enterprises adopt the randomly selected customer strategy, the cluster’s knowledge stock shows an overall increasing trend over time, but its growth rate is getting slower and slower, and it gradually slows down at t=150.
When the number of customers \(N\) is larger and the knowledge dimension is also larger, the average knowledge stock is higher, in which the larger the number of customers and the larger the market are more favorable to the long-term growth of the whole cluster.
The subject’s learning ability affects the knowledge dissemination of the enterprise, and the effect of learning ability on the dissemination of tacit knowledge of the enterprise is positive. Simulation results show that when the propagation speed is in the interval of [0.8,0.9], the propagation effect reaches the maximum value.
Using high-dimensional data visualization technology to deal with the knowledge of enterprise development, accelerating the dissemination of knowledge within the enterprise, combining with the model of knowledge dissemination within the enterprise, and optimizing the parameter settings can further enhance the effect of knowledge dissemination, and promote the development of the enterprise within the enterprise.


