
In order to avoid blindness in vocal teaching, it is necessary to seek the correct method of vocalization that conforms to the principles of physiological science and to correct the wrong method of vocalization. In this paper, we describe the differences of vocal vocalizations by MFCC coefficients and pitch features, and adopt LAS model to extract high-level features in speech signals. And different vocalizations are explored in different acoustic feature parameter spaces. Deep learning and transcribed text techniques in artificial intelligence are utilized to detect and correct the errors identified by vocalizations. The results show that the absolute error of vocal error vocalization correction is between -1.99 and 7.15 Hz, with an accuracy rate of 97.1729%, and the error is controlled within 3%, which meets the needs of vocal teaching. The identification and correction method proposed in this paper is feasible and has positive significance for the informational reform of vocal music teaching.
n the study of vocal music, there is a great blindness in singing vocal training because there is no correct concept of voice as a guide, and there is no recognition and mastery of the basic principles of vocal articulation [1,2]. Beginners want to get a better sound effect, so they make their vocal organs sing in an unnatural state, which will cause some problems over time [3].
The biggest difference between vocal music and instrumental music lies in the fact that the instrument used in instrumental music is a “thing” outside the body, while the instrument used in vocal music is a part of our body. The structure, shape, volume, and proportion of any instrument are fixed, and the articulation is mechanical, so it is easier to control [4-6]. When there is a problem with a musical instrument, the broken part can be repaired and replaced with a new one. As long as there are materials and people who can repair the instrument, everything can be easily solved [7]. The articulators in our body are made up of the vocal cords, larynx, pharynx, mouth, sinuses, lungs, and many other organs [8]. The structure of each organ is very flexible, and the functions of each organ are very variable and not easy to control; and when singing, it is necessary to match the functions of these many organs perfectly, so it is impossible for an untrained person or a person who has been incorrectly trained to produce a voice that is accurate in “pitch” and beautiful in sound quality [9-11]. Singing pronunciation is closely related to breathing, vocalization and resonance, so in order to solve the wrong pronunciation in singing, it is necessary to solve the three fundamental problems of breathing, vocalization and resonance [12,13].
The scientific method of vocalization can make the movements of each vocal organ coordinated and make them form a whole movement, which will not only bring beautiful and melodious singing, but more importantly, it can make the voice relatively youthful and prolong its artistic life [14,15]. As for the wrong method of vocalization, due to the improper cooperation of each vocal organ, the result, not only leads to the lack of artistic charm of the singing voice, but also long-term in a kind of abnormal, non-physiological laws of the local vocal state, may cause hoarseness and other lesions of the voice [16]. Therefore, a scientific method of vocalization is very important for those who learn vocal music, especially those who are new to the field of vocal music [17].
In this study, firstly, the acoustic and rhythmic features in the traditional voice recognition system are investigated, and the data preprocessing methods for speech recognition are summarized, as well as the calculation of MFCC features and pitch features. Secondly, each feature in the hypothetical string of recognition results is classified by Artificial Intelligence technique to determine whether it is correct or not. Candidate sequences are constructed for the vocalization confusion network labeled as incorrect and the candidate sequences are scored using the trigram model, and the highest scoring acoustic feature is selected as the result of error correction. Finally, the correspondence between voice vocalizations and source signals is analyzed to provide a theoretical basis for acoustic analysis and vocalization error correction, and the effectiveness of the identification and correction models is empirically tested.
The expression of the voice depends on two main factors, the size of the vocal cavity and the way the vocal apparatus operates.
The features that characterize differences in vocalizations can generally be considered in the following ways:
Acoustic features, the most widely used currently are MFCC coefficients based on cepstral coefficients.
Rhythmic features, i.e., pitch (F0) features describing vocal vocal differences in a small set range.
In the following, the above two features will be extracted one by one in this paper to provide a data base for the subsequent recognition and correction of erroneous vocalizations.
Strictly speaking, pitch belongs to the auditory perception of tone, in which a person’s subjective perception is used to evaluate a heard sound as being high or low in pitch. It can be measured by asking the listener to compare the alternating presentation of a complex signal, whose pitch is to be estimated, with the frequency of a sinusoidal variable signal. In this paper we use the normalized correlation function coefficients (NCCF), to characterize the pitch cycle in speech signals.
Calculating the NCCF First, the lag range of the NCCF needs to be determined. This depends on the frequency range to be searched, define \(\min {\rm \; }lag=1/\max -f_{0}\), \(\max {\rm \; }lag=1/\min -f_{0}\) such that is the minimum and maximum lag time (s) of the desired NCCF.
And further defined: \[\label{GrindEQ__1_} \text{upsample filter frequency}=\frac{\text{resample frequency}}{2}.\tag{1}\]
This is the filter cutoff used when upsampling the NCCF.
Consider frame index \(t=0,1,\ldots\) such that all frame indexes \(t\) generate outputs such that the time span is well within the time span of the input. Let \(w_{t} =\left(w_{t,0} ,w_{t,1} ,\ldots \right)\) be used for the sample sequence of frame \({\rm t}\) and let \(V_{t,1}\) denote the subsequence of \(w_{t}\) starting from position \(i\). The NCCF for frame \(t\) and lag index \(l\) is: \[\label{GrindEQ__2_} \phi _{t,l} =\frac{v_{t,0}^{T} v_{t,l} }{\sqrt{\left\| v_{t,0} \right\| _{2}^{2} \left\| v_{t,l} \right\| _{2}^{2} +n^{4} nccf-ballast} } .\tag{2}\]
Next, the NCCF is upsampled in a nonlinear manner: \[\label{GrindEQ__3_} L_{i} =\min -lag(1+delta-picth)^{i} ,i\ge 0 ,\tag{3}\] where \(L_{i} \le \max -lag\) determines the largest index \(i\).
The outputs of this algorithm are the base pitch of each frame and the NCCF of each frame, with the pitch on frame \(t\) equal to \(1/L_{st}\). The value of the NCCF is computed over a selected lag time. Therefore, we output \(\phi _{t,l}\) on frame \(t\). In order to make pitch extraction more relevant for practical application purposes, based on previous work, we propose to compute the NCCF without the nccf-ballast term.
If there exists an NCCF extracted in the region of silence, the pitch values of neighboring speech regions are inserted linearly between the gaps. For regions of clear speech at file boundaries, only the first or last pitch value is needed. The reason for adding noise and smoothing is to make the output quantized to discrete values of the base tones produce clear trajectories that help the pitch extraction to be smoother.
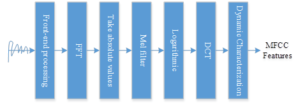
At this stage, most of the vocal recognition systems are still based on MFCC as the acoustic feature parameter to characterize vocal music, and the acoustic features in this research work all adopt MFCC as the acoustic feature parameter of vocal music. The extraction process of MFCC is shown in Figure 1.
Pre-emphasis
Pre-emphasis, using high-pass filtering to process the speech signal to improve the energy distribution of the high-frequency portion of the speech signal, and the signal resolution of the high-frequency component, so that the spectral distribution of the speech signal as a whole becomes flat: \[\label{GrindEQ__4_} H(z)=1-az^{-1}.\tag{4}\]
Framing and windowing
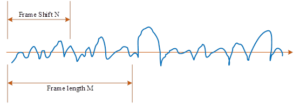
The generation of speech signals is mainly determined by the human’s own vocal apparatus, and the process of speech generation is considered to be slower than the dynamic change of the sound itself, as the movement of the vocal apparatus corresponds to the state change. In order to avoid the leakage of information between frames, frame splitting is required. Generally, the overlap between frames is set to be one-third to one-half of the frame length. Speech signal sub-frame processing process shown in Figure 2, directly using a movable plus window function with the speech signal weighted processing to achieve, the specific operation is the window function and the speech signal multiplication.
The most widely used window function in speech signal processing is the Hamming window, and the Hamming window function is expressed as: \[\label{GrindEQ__5_} \omega (n)=\left\{\begin{array}{cc} {0.54-0.46\cos [2\pi n/(N-1)],} & {0\le n\le (N-1)} \\ {0,} & {n=else} \end{array}\right.\tag{5}\]
Fast Fourier transform and short-time energy spectrum
The amount of information in the time domain of the speech signal is difficult to see the information properties of the speech signal, generally converted from the time domain to the frequency domain to analyze the speech signal, the energy distribution of the speech in the frequency domain reflects the rich information of the speech signal. So after the speech signal is divided into frames, each frame of the speech signal also needs to go through the fast Fourier transform (FFT) to get the energy distribution in the spectrum. Fourier transform formula: \[\label{GrindEQ__6_} X(k)=\sum _{j=0}^{N-1}x (j)e^{-j\frac{2mk}{N} } (0<k<N).\tag{6}\] FFT transform processing of the speech signal is also required to derive the short-time energy spectrum: \[\label{GrindEQ__7_} P(k)=|X(k)|^{2} .\tag{7}\]
Mel Filter
After the signal is converted from the time domain to the frequency domain, it is converted to the frequency domain that is more in line with the auditory perception of the human ear from passing through the Mel triangular filter bank. The following formula corresponds to the delta filter bank division: \[\label{GrindEQ__8_} H_{m} (k)=\left\{\begin{array}{cc} {0,} & {k<f(m-1)} \\ {\frac{k-f(m-1)}{f(m)-f(m-1)} ,} & {f(m-1)\le k\le f(m)} \\ {\frac{f(m+1)-k}{f(m+1)-f(m)} ,} & {f(m)\le k\le f(m+1)} \\ {0,} & {k>f(m+1)} \end{array}\right.\tag{8}\]
Calculate the logarithmic energy of the output of each filter bank
The speech signal is essentially a convolutional signal, and the previous step transforms the speech signal from the time domain to the frequency domain, at which point the speech signal is a multiplicative signal. For easier subsequent processing, the multiplicative signal is multiplied by the additive signal through a logarithmic transformation. The logarithmic energy at the output of the filter bank is: \[\label{GrindEQ__9_} S(m)=\ln \left(\sum _{k=0}^{N-1}P (k)H_{m} (k)\right),0\le m\le M .\tag{9}\]
The MFCC is obtained by discrete cosine transform:
The Discrete Cosine Transform (DCT) is more advantageous for dealing with covariance matrices, especially in speech processing where covariance matrices are generally taken as diagonal matrices. In the previous step there is a large correlation between the logarithmic energy outputs from the triangular filter bank, and the DCT serves to eliminate the correlation between the different output parameters. In general, the first \(n\) coefficients of the DCT indicate most of the characteristics of the feature parameters, and the MFCC in voiceprint recognition is generally taken as the input to the model of order 0-12 or 0-19. The MFCC can be obtained:
\[\label{GrindEQ__10_} c(n)=\sum _{n=0}^{N-1}s (m)\cos (\pi n(m-0.5)/M),0\le n\le M .\tag{10}\]
The LAS model is based on the Sequence to Sequence (Seq2seq) framework with the attention mechanism, which mainly consists of a Listener and a Speller. The former is a pyramidal RNN encoder that extracts high-level features from the speech signal, while the latter is an RNN decoder that utilizes the attention mechanism to convert the high-level features obtained by the encoder into character output. The structure of the model is shown in Figure 3, where the input of the model is the extracted acoustic feature \(x=(x_{1} ,x_{2} …,x_{T} )\) and the output is the character sequence \(y=\left(\left\langle sos\right\rangle ,y_{1} ,…,y_{u} ,\left\langle eos\right\rangle \right)\).
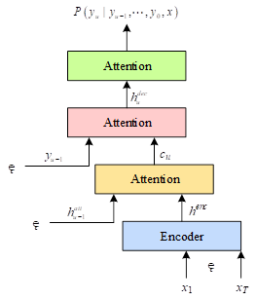
The model structure of the listener employs a three-layer pyramidal bi-directional long-short time series model (pBi-LSTM), and for each time step \(i\), the output of the layer \(j\) Bi-LSTM is: \[\label{GrindEQ__11_} h_{i}^{j} =pBiLSTM\left(h_{i-1}^{j} ,\left[h_{2i}^{j-1} ,h_{2i+1}^{j-1} \right]\right) .\tag{11}\]
This pyramidal model structure reduces the computation time by a factor of 8 compared to a normal Bi-LSTM. It also reduces the dimension of speech feature vectors, which facilitates the extraction by the attention mechanism and enables better nonlinear features to be obtained.
The speller of the model, on the other hand, uses an LSTM Transducer model based on an attention mechanism, where each output character is subject to a probability distribution computed based on the results of the characters that have been predicted earlier. For an output of \(y_{i}\), its probability distribution is computed from decoder state \(s_{i}\), and context vector \(c_{i}\). The decoder state \(s_{i}\) is then a function of the previous decoder state \(s_{i-1}\) and the character predicted in the previous step \(y_{i-1}\) and the context vector \(c_{i-1}\) of the previous step. Context vector \(c_{i}\) is generated through the attention mechanism: \[\label{GrindEQ__12_} c_{i} =\text{Attention Context}\left(s_{i} ,h\right).\tag{12}\] \[\label{GrindEQ__13_} {\rm s}_{{\rm i}} =RNN\left(s_{i-1} ,y_{i-1} ,c_{i-1} \right).\tag{13}\] \[\label{GrindEQ__14_} p\left(y_{i} |x,y_{<i} \right)=\text{Character Distribution}\left(s_{i} ,c_{i} \right).\tag{14}\]
Subsequently, the scale energy \(e_{i,u}\) is transformed by a softmax function into a probability distribution \(a_{i,u}\), and this probability, together with the listener’s features \(h_{u}\), will be used to compute a context vector \(c_{i}\), which is used to select the input features that are relevant to the output, so that the model’s attention will be focused on the processing of valid information. The above steps are computed as follows: \[\label{GrindEQ__15_} e_{i,u} =<\phi \left(s_{i} \right),\psi \left(h_{u} \right)> .\tag{15}\] \[\label{GrindEQ__16_} a_{i,u} =\exp \left(e_{i,u} \right)/\sum _{u}\exp \left(e_{i,u} \right).\tag{16}\] \[\label{GrindEQ__17_} c_{i} =\sum _{u}a_{i,u} h_{u},\tag{17}\] where \(\phi\) and \(\psi\) are both multilayer vector machine networks, and \(c_{i}\) can be viewed as a continuously weighted vector sum of encoder hidden vectors \(h\).
For the training of the LAS model, joint training can be used to maximize the following logarithmic probability function: \[\label{GrindEQ__18_} {\mathop{\max }\limits_{\theta }} \sum _{i}\log P\left(y_{i} |x,\tilde{y}_{<i} ;\theta \right),\tag{18}\] where \(\tilde{y}_{t}\) is obtained by randomly sampling or selecting real characters from the distribution of characters that have been predicted, i.e: \[\label{GrindEQ__19_} \tilde{y}_{i} \sim \text{Character Distribution}\left(s_{i} ,c_{i} \right).\tag{19}\]
When inference is performed, the most probable sequence of characters in the input features is found by maximizing the logarithmic probability: \[\label{GrindEQ__20_} \hat{y}=\arg \max _{y} \log P(y|x).\tag{20}\]
The same left-to-right clustering algorithm was used for decoding. While performing the training the data of the text is larger than the data of the transcribed speech signal, so a language model can be trained to re-score the constraints obtained after the cluster search algorithm.The LAS model suffers from a small error for shorter acoustic segments, this error can be eliminated by regularizing the output according to the length of the characters and the probability obtained by the language model, i.e.: \[\label{GrindEQ__21_} s(y|x)=\frac{\log P(y|x)}{|y|_{c} } +\lambda \log P_{LM} (y),\tag{21}\] where \(\lambda\) is the weight of the language model and \(|y|_{c}\) is the restricted length of the output characters, sized by the retained validation set.
For the encoder component of las, the conformer model based on the transformer architecture is replaced by the PBLSTM architecture; For las’s speller component, replace LSTM with bigr.and replace the focus mechanism with a long self-focus mechanism while using the tone level CTC decoder for auxiliary training. The results of the CTC decoder’s weight affect the experimental results in the data set of the data set, when the ratio of the wer is low in the near 0.3, and the rate of the model is getting worse and the rate of the CTC weight is reduced or increased, and this also shows that the CTC decoder is suitable for auxiliary training, and the weight value of the experimental model should be selected by 0.3.
In this paper, we propose a method for vocalization recognition results, error detection and error correction. First, each word in the hypothetical string of recognition results is classified by artificial intelligence techniques to determine whether it is correct or not. Next, a candidate sequence is constructed for the vocalization obfuscation network labeled as incorrect, the candidate sequence is re-scored using the trigram model, and the acoustic features with the highest scores are selected as the results of the error correction, while the acoustic features that were originally used as the recognition results are judged to be incorrect are replaced.
Vector Support Machine (SVM) is a machine learning system built on the principle of minimizing structural risk of statistical learning theory, which has the advantages of small-sample learning and strong generalization ability of promotion, and can be well applied to the 2-class pattern recognition problem. So, in this paper, SVM classifier is used to determine the right or wrong of each word in the word string as the recognition result.The model of SVM classifier is: \[\label{GrindEQ__22_} r=\overrightarrow{p}{\kern 1pt} ^{T} \cdot \overrightarrow{f}+c,\tag{22}\] where \(\vec{f}\) is the normalized feature vector, \(\vec{p}\) is the projection vector, and \(c\) is the threshold. \(r\) is the classification score, when \(r>0\) means the word is correct and \(r<0\) means the word is wrong.
Based on the acoustic feature confusion network, a set of candidate features, such as acoustic model scores, language model scores, and maximum a posteriori probabilities of words, are first listed. Then, a data-driven approach is used to refine the set of features for use in the SVM error classifier. A 10-fold cross-validation experiment is performed for all candidate features and the dataset is divided into 10 parts, 9 of which are used for training and 1 for testing in turn, with one candidate feature removed each time. The impact of the feature on the classification performance is evaluated based on the mean of the results of the 10 times and if there is no improvement in the classifiability then the feature is removed from the candidate feature sequence. After such a feature selection process, the following features are finally retained for use in the classifier:
The position of the acoustic feature in the entire sequence to be selected.
The length of the entire speech signal around.
Whether the acoustic feature with maximum a posteriori probability in the neighboring confusion set is NULL.
The maximum a posteriori probability of the acoustic feature in the current confusion set.
The unigram probability of the acoustic feature.
The mean and variance of the a posteriori probability of the acoustic feature in the current confusion set.
The number of candidate features in the current confusion set.
The score span, i.e., the difference between the maximum and minimum scores, of all acoustic features in the current confusion set in the language model.
After error detection of the vocalization recognition results, a sequence of wrong candidates is constructed for the acoustic features determined to be wrong, forming a search network. The detailed algorithm is described as follows:
Construct a sequence of candidate features, and for the features labeled as wrong vocalizations, select the confusion set with temporal overlap with wrong vocalizations from the corresponding confusion network, and replace the wrong vocalizations to form a new search network.
For this new search network, each of the paths in it is a string hypothesis that constitutes the sentence. For each candidate feature, the candidate features are classified using a tool that performs disambiguation on the vocal corpus on which the acoustic model is trained.
Re-score each candidate feature hypothesis using the trigram acoustic model: \[\label{GrindEQ__23_} HScore\left(w_{1} w_{2} \ldots w_{n} \right)=\sum _{i=2}^{m}P \left(w_{i} |w_{i-2} ,w_{i-1} \right).\tag{23}\]
Rank each candidate acoustic feature in order of score.
The candidate feature with the highest score is selected as the result of incorrect vocalization correction. And the original vocalizations that were labeled as erroneous were replaced by the vocalizations at the corresponding positions in the candidate features.
At the beginning of this paper, it was suggested that acoustic features are divided into two parts: MFCC features and pitch features, pitch is further subdivided into a variety of specific intonation elements, and rhythm is further subdivided into different levels of rhythmic units. These rhythmic elements are closely related to each other, and their cross-talk in the speech stream forms a vocal rhythmic feature.
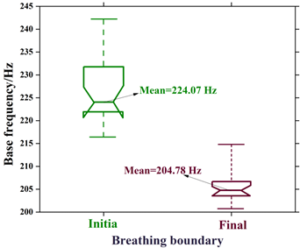
This experiment observes vocal changes at the boundaries of respiratory clusters, i.e., the syllables at the beginning of each respiratory cluster and the syllables at the end of each cluster are cut out and labeled as the beginning group and the end group, respectively. And by comparing the differences in their vocal performance, the vocal vocal vocalization changes at the boundaries of the respiratory clusters were identified. In addition, because vocal voicing is also affected by different tonal flatness and oblique patterns, the experiment analyzed yin and yin flat syllables in order to eliminate the influence of these flatness and oblique patterns on the experimental results. The beginning group analyzed was 24 syllables, and the ending group was 32 syllables, from which the fundamental frequency was extracted as a parameter variable, and the average value of each group was obtained after time normalization. The fundamental frequency analysis of respiratory rhythm is shown in Figure 4, where the box refers to the 25% to 75% distribution of the fundamental frequency, the horizontal line inside the box refers to the mean value, and the upper and lower lines refer to the maximum and minimum values, respectively. It can be seen that the average decrease in fundamental frequency from the beginning to the end of the respiratory rhythm is 19.29 Hz, reflecting a general intonation phenomenon such as pitch dip. According to the basic characteristics of vocal music, the change in vocal music when the fundamental frequency falls is generally a fall in the open quotient and a rise in the velocity quotient.
In this paper, we explore the variation of the open quotient and velocity quotient based on the vocalization recognition model of the LAS algorithm. It is mainly reflected in the changes of spectral slope and high-frequency energy in vocalizations. For example, the open quotient is closely related to the change of H1-H2 values, and the velocity quotient reflects the change of high-frequency energy. Thus, the rise of the open quotient and the fall of the velocity quotient at the boundary of the respiratory group are acoustically reflected in the fall of high-frequency energy. This paper further discusses the main acoustic characteristics of voice changes in breathing rhythm through acoustic analysis of vocal vocal characteristics.
The high-frequency energy changes of the voice at the beginning and the end of the respiratory group are shown in Figures 5 and 6, and it can be seen that there is an obvious difference between the high-frequency energy at the beginning and the end of the respiratory group, and the high-frequency energy at the end of the respiratory group decreases dramatically, with the maximum amount of the change reaching 37.52 dB. The magnitude of the high-frequency energy is also related to the slope of the spectrum, and the difference in the energies of the first harmonic and the second harmonic (H1-H2 values) is the main variable in the slope, which is the response to the spectral slope of the breath. The energy difference between the first harmonic and the second harmonic (H1-H2 value) is the main variable of the slope, which reflects the change of the high-frequency energy. From the variation of the H1-H2 value in the figure, it can be seen that the H1-H2 value at the beginning of the respiratory group is 3.63 dB, but the value at the end of the respiratory group is 6.29 dB, which is a large increase at the end of the respiratory group. This indicates that the slope of the spectrum at the end of the respiratory cluster is greater, reflecting the decrease in high-frequency energy.
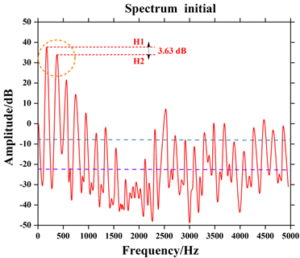
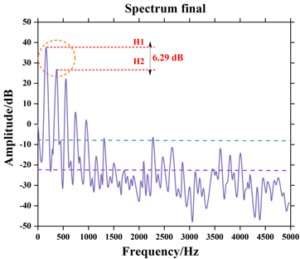
It can be seen that changes in respiratory rhythm are acoustically characterized by a decrease in high-frequency energy, which is reflected in the spectrum. It should be noted, however, that the use of spectral analysis in the process of vocal recognition must be done in the same band to be meaningful; if the resonance peaks of the analyzed objects have a different structure, comparisons between these variables will not be meaningful.
A large number of practices have proved that the correction of vocal mispronunciation through machine learning is subject to a certain degree of error, and the existence of error is inevitable and universal. The study of the error that always exists in the measurement process is the basis for fully understanding the reduction or elimination of error. Error is the difference between the measured value and the true value, according to the reasons for the error and the nature of the error can be divided into two categories of systematic error and chance error.
For this experiment, when acquiring vocal acoustic signals, video images were recorded at the same time for the convenience of comparative analysis, and the real data of the sound acquisition equipment was used as the real value of this experiment through specific image observation software and limiting the number of time value digits.
The vocal characteristics of the previous section and the real data were imported into the model, and the data at \(\Delta t\)=5min, 10min and 20 min were calculated in the same order, and the error analysis of vocal mispronunciation correction was obtained as shown in Table 1. It can be seen that the absolute error of vocal mispronunciation correction ranges from -1.99 to 7.15 Hz, and the error increases with the increase of vocal pronunciation time.In the 20-min vocal pronunciation test, the accuracy of AI-based vocal mispronunciation correction is 97.1729%, and the error is controlled within 3%, which is in line with the design requirements. The results of this experiment verify the feasibility of the method of envelope extraction of acoustic signals during vocal mispronunciation based on artificial intelligence technology and the use of peak time point as a feature parameter for identification and correction.
| Step size\(\Delta t\)/ ms | Acoustic features/ Base frequency | Absolute error/Hz | Relative error/% | Accuracy rate of error correction | |
|---|---|---|---|---|---|
| Desired value/Hz | Actual value/Hz | ||||
| 5 | 215.37 | 217.36 | -1.99 | 0.9240 | 99.076% |
| 10 | 243.59 | 249.75 | -6.16 | 2.5288 | 97.4712% |
| 20 | 252.91 | 245.76 | 7.15 | 2.8271 | 97.1729% |
In the teaching of vocal music, many students often meet the phenomenon of wrong vocalization. The reason for this is that beginners have poor ability to identify the sound and cannot distinguish between right and wrong sound, which leads to the formation of wrong vocalization in the long-term practice. Based on artificial intelligence technology, this paper constructs a vocal mispronunciation identification and correction model, and verifies its effectiveness, which can be applied to vocal music teaching to improve teaching efficiency.
The accuracy rate of vocal mispronunciation correction based on artificial intelligence is 97.1729%, and the error is controlled within 3%, which is in line with the teaching demand. The method proposed in this paper realizes computer-assisted vocal vocalization teaching, detects the identification of errors in students’ voices in real time, and avoids the complicated labeling work of teachers.
The method of vocal mispronunciation correction based on artificial intelligence can minimize the appearance of subjectivity and blindness. A positive and correct method of vocalization in accordance with scientific principles is constructed to correct the wrong way of vocalization and overcome the bad habits on vocalization.
This research was supported by the Research on the inheritance status and countermeasures of Zigong Salt Worker’s Trumpet (No.: MYYB2023-25).
This research was supported by the Exploring the Teaching Mode of Ethnic Music Integrated into Physical Education Professional Practice Courses in Colleges and Universities (No.: MYYB2023-20).