apped from the national level down to the urban and rural regional economies, it is evident that the circular economy model plays a pivotal role within the context of urban-rural integration [1]. Currently, the urban-rural economic cycle is primarily facilitated by logistics and transportation, and the prevalence of logistics supply chains underscores their rationale [2]. Nevertheless, the urban and rural logistics supply chain currently faces challenges stemming from disparities in transportation products, resulting in suboptimal transportation efficiency and difficulties in establishing a robust circular system [3-4].
The urban and rural logistics system serves as a crucial conduit for the construction and development of the urban-rural circulation market, fundamentally reinforcing the interconnection between urban and rural logistics markets [5,6]. Currently, China’s economy is undergoing a pivotal period of transformation, with high-quality development being the paramount priority in the comprehensive pursuit of socialist modernization. Consequently, it is imperative to establish a novel development paradigm, enact strategies aimed at expanding domestic demand, intensify supply-side structural reforms, bolster the endogenous momentum and reliability of the domestic cycle, and elevate the quality and efficiency of urban-rural logistics circulation [7,8].
In the intricate landscape of domestic and international economic and trade dynamics, the construction of an urban-rural logistics system emerges as a potent driving force facilitating the efficient allocation and seamless circulation of various production factors within the new development paradigm. It constitutes a vital channel for expanding the rural circulation market and harnessing the latent consumption power of rural areas. Additionally, this system is imperative for accelerating the establishment of a unified national market system and regulations, thereby dismantling local protectionism, overcoming market fragmentation, and unblocking key economic constraints. Furthermore, it represents a necessary avenue for fostering urban-rural integration, ultimately leading to shared prosperity and advancing modernization. Consequently, the development of this logistics system is pivotal in advancing urban-rural integration, ensuring collective affluence, and accelerating modernization [9,10,11].
The Internet, as the representative of digital technology, is accelerating the integration and development across various societal fields, with interconnection emerging as the new norm in both urban and rural industrial development. The digitalization-driven reconstruction of the urban-rural logistics system serves as a pivotal conduit for addressing the key bottlenecks in urban-rural economic circulation, a crucial element in shaping a novel development paradigm, and an inevitable path towards achieving the synergistic development of urban-rural integration [12].Literature [13] conducted a comparative analysis of the environmental impacts between drone and motorcycle modes of transportation logistics, revealing that the particulate pollution emanating from drone transport is halved compared to that generated by motorcycles, thereby imparting positive environmental implications.Literature [14] introduced an adaptive learning method for fleet allocation, with the results of simulated numerical tests indicating that this approach optimizes logistics management strategies while concurrently reducing operational costs.Literature [15] scrutinized the profound conflict of interests between biodiversity and road logistics in Årebro, Sweden. It emphasized the importance of drawing insights from local authorities’ experiences in balancing biodiversity conservation with logistics economic development, aiming to maintain biodiversity’s ecological integrity while fostering the sustainable development of road logistics and transportation.Literature [16] developed an application (APP) aimed at enhancing urban and rural e-grocery logistics and distribution, thereby promoting informatization within urban and rural logistics systems and increasing the value of value-added services. This innovation is conducive to facilitating rural revitalization efforts.Literature [17] proposed four unique implementation techniques for urban logistics systems (ULS), designed to optimize the current challenges of urban traffic congestion and logistics distribution bottlenecks. Through empirical analysis, the feasibility of these approaches was verified, resulting in a certain degree of improvement in the dilemma of urban traffic congestion and logistics distribution difficulties.
In the context of the digital economy, the rural population’s demand for distribution facilitated by digital technology has exhibited explosive growth. Consequently, the establishment of a digital-enabled urban and rural logistics system is pivotal in stimulating the rural consumer market and bridging the development gap between urban and rural areas. Literature [18] investigates and analyzes the potential of subway transportation channels for logistics distribution, conducting a simulation analysis test. The test results indicate that logistics distribution utilizing subway infrastructure can effectively mitigate the likelihood of logistics congestion and concurrently reduce the environmental pollution associated with logistics activities. Literature [19] outlines a potential future development trajectory for logistics transportation and introduces an analytical framework, centered on systems thinking theory, to identify influential factors governing logistics development and operation. Literature [20] endeavors to disentangle the relationship between reverse logistics and urban logistics, exploring and examining this relationship from multidimensional perspectives, including land use and infrastructure. Literature [21] proposes a strategy involving the implementation of fixed storage cabinets for logistics parcels, aiming to diminish the costs and environmental pollution stemming from parcel delivery, thereby contributing to the field of environmental protection. Lastly, Literature [22] contemplates a logistics prioritization and evaluation scheme, designed to offer an optimal path for urban logistics, ensuring logistical efficiency, meeting customer needs, and minimizing logistics cost investments.
Drawing upon the current state of urban-rural logistics systems and the new development paradigm strategy, this study delves into the interlinkage mechanisms between these two entities and formulates a mechanism model outlining their mutual interactions within this framework. Initially, we employ the gray correlation analysis method to quantify the correlation coefficient between the urban-rural logistics system and the new development paradigm strategy, thereby offering an initial assessment of their linkage. Subsequently, leveraging the logistic model, we establish an analytical framework for economic development under the new development paradigm strategy. Within this framework, we conduct marginal analysis, inflection point analysis, and elasticity analysis on both the urban-rural logistics system and the new development paradigm strategy, aiming to comprehensively explore their linkage relationship within the broader interlinkage mechanism. Lastly, to validate our model, we conduct an empirical analysis focusing on City A, examining the linkage relationship between the urban-rural logistics system and the new development paradigm strategy over the period from 2013 to 2023. This analysis serves as a robust data support for the linkage mechanism model proposed in this paper.
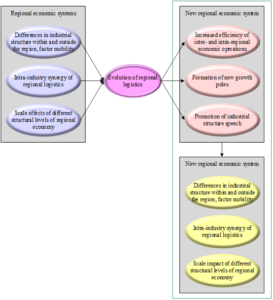
The linkage mechanism model between the logistics system and the new development pattern strategy, as constructed in this paper, is presented in Figure 1. This model illustrates a progressively tighter integration between the new development pattern strategy and the functioning of the urban and rural logistics system. Within this framework, the urban and rural logistics system, functioning as a subsystem within the broader new development pattern strategy, experiences an inevitable interplay with other system components. This interaction is mediated by order parameters that are external to the logistics system itself, ultimately manifesting in a transformation of the urban and rural logistics system from a state of disorder to a new ordered state. At the critical point of this phase transition, the fluctuations in various order parameters are pronounced, indicating a pivotal shift. Consequently, managing the evolution of these order parameters that influence the system is essential for achieving the orderly development of the urban and rural logistics system. Such as the economy from the traditional economy to the modern economy in the process of transformation, must pay attention to the adjustment of industrial structure between regions, only in the regional comparative advantage based on the industrial division of labor, to avoid industrial convergence, and promote the development of urban and rural logistics system [23]. On the other hand, the urban and rural logistics system is not just passive adaptation, the logistics system will guide and promote the development of new development pattern strategy. In this way, there is a possibility of generating collective behavior, cooperation, and synergy within the larger system. This behavior may cause changes in the strategic structure of the new development pattern and generate a new structure. The urban-rural logistics system has to re-adapt within this new structure, and so on and so forth, an organic linkage mechanism is established between the urban-rural logistics system and the NDS strategy.
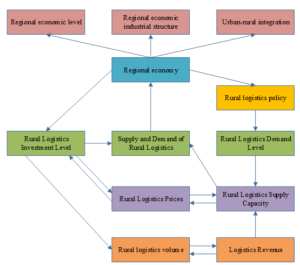
This paper, based on the previously established linkage model, delves into the interplay mechanism between urban-rural logistics and the new development pattern strategy. The specific configuration of this interplay mechanism is illustrated in Figure 2. The urban-rural logistics system and the new development pattern strategy form an interdependent and mutually reinforcing linkage, where the economic development level within the new development pattern strategy dictates the extent of development achieved by the urban-rural logistics system. Conversely, the progression of the urban-rural logistics system fosters the advancement of the new development pattern strategy. The linkage mechanism between these two entities mutually influences each other through the dynamics of demand and supply within the urban-rural logistics system. Specifically, the development of the new development pattern strategy propels the urban-rural logistics system forward by augmenting its demand and bolstering its supply capacity. In turn, the urban-rural logistics system enhances the overall state of logistics supply and demand, thereby laying a solid logistical foundation for the further development of the new development pattern strategy.
Gray correlation analysis is a methodology employed to ascertain the relationship between factors by quantitatively assessing the degree of similarity between the geometric curves that represent the temporal variations of these factors, based on their time series data. This approach is inherently dynamic, and in practical applications, it is commonly utilized to evaluate the extent of correlation by computing the gray correlation coefficient between a reference series and one or more comparison series. In this paper, we establish a gray correlation analysis model specifically tailored to investigate the preliminary linkage between the logistics system and the strategy of the new development pattern.
Let \(x_{1} ,x_{2} ,\cdots ,x_{n}\) be \(N\) factors, and the data reflecting the change characteristics of each factor are, respectively, \(\left\{x_{1} \left(t\right)\right\},\left\{x_{2} \left(t\right)\right\},\cdots ,\left\{x_{n} \left(t\right)\right\}\) and \(t=1,2,\cdots ,M\). If the reference column is set to be \(x_{0} =\left\{x_{0} \left(t\right)\left|t=1,2,\cdots ,M\right. \right\}\), the columns of the other \(N\) factors are the comparison columns. Then the correlation of \(t\) moment factors \(x_{n}\) to \(x_{0}\) can be calculated according to the following steps:
The first step is to find the initial term (or mean like) of each series to achieve dimensionlessness of the variables: \[\label{GrindEQ__1_} x'_{i} \left(t\right)=\frac{x_{i} \left(t\right)}{x_{i} \left(1\right)} =\left(x'_{i} \left(1\right),x'_{i} \left(2\right),\cdots ,x'_{i} \left(n\right)\right), \tag{1}\] for\(i=0,1,\cdots ,n.\)
The second step solves for the sequence of differences. Notation: \[\label{GrindEQ__2_} \begin{cases} \Delta _{i} \left(t\right)=\left|x'_{0} \left(t\right)-x'_{i} \left(t\right)\right|,\\ \Delta _{\max } =\max _{i} \max _{i} \Delta _{i} \left(t\right),\\ \Delta _{\min } =\min _{i} \min _{t} \Delta _{i} \left(t\right) . \end{cases} \tag{2}\]
The third step calculates the correlation coefficient: \(\xi _{01} \left(t\right)=\frac{\Delta _{\min } +\rho \Delta _{\max } }{\Delta _{i} \left(t\right)+\rho \Delta _{\max } }\), \(\rho\) is for is the gray scale between \(\left[0,1\right]\), generally take \(\rho =0.5\).
The fourth step calculates the degree of association: \[\label{GrindEQ__3_} \xi _{0i} =\frac{1}{n} \sum _{t=1}^{m}\xi _{0i} \left(t\right),i=1,2,\cdots ,n . \tag{3}\]
Gray correlation analysis is used to identify the linkage between the development of urban and rural logistics system and the strategy of new development pattern, that is, to take the development level of urban and rural logistics system as the reference factor, and the development of the strategy of the new development pattern as the comparative factor, and bring the data series of the corresponding characterization indexes to the model for solving, and the greater the calculated correlation, the higher the correlation proves the correlation between the urban and rural logistics system and the strategy of the new development pattern. The higher the calculated correlation, the higher the correlation between the urban and rural logistics system and the new development pattern strategy.
The logistic function model, also referred to as the growth curve function model due to its origins in biological reproduction research, is widely employed in the depiction and analysis of industrial growth processes. The functional expression of this model is as follows: \[\label{GrindEQ__4_} y=\frac{1}{K+ab^{x} } , \tag{4}\] where \(y\) is GDP, \(x\) is freight volume, \(K\), \(a\), \(b\) are unknown constants, \(K>0\), \(a>0\), \(0<b\ne 1\).
Logistic function growth curve has certain characteristics and laws, the growth curve is divided into two parts by the inflection point \(\left(x^{*} ,y^{*} \right)\), in the first part, with the increase of the value of \(X\), the value of \(Y\) grows slowly at first, and then the growth rate is gradually accelerated and enter the accelerated growth stage. After the accelerated growth, a critical point is reached, which is the inflection point \(\left(x^{*} ,y^{*} \right)\). In the second part, after the inflection point is reached, the growth rate gradually slows down as the value of \(X\) continues to increase.
Based on the characteristics of the “S” growth curve of the logistic function, the logistic function shows a non-linear growth curve, with the growth of the urban and rural logistics system (freight volume), the rate of economic growth (GDP) under the new development pattern strategy is different, the rate of economic growth can be changed from decreasing to increasing at a certain point, and from increasing to decreasing at a certain point. Increasing, and from increasing to decreasing at a certain point. This provides a research direction to study the role of urban and rural logistics system development on economic growth. Therefore, this paper applies “marginal analysis”, “inflection point analysis” and “elasticity analysis” to study the relationship between the urban-rural logistics system and the strategy of the new development pattern.
In the study of the relationship between the development of urban and rural logistics system and economic growth, the margin is to describe the change in the amount of change in the gross domestic product in the change of one unit of freight volume, the margin is also the derivative of the function \(y=f\left(x\right)\), written as \(M\left(f\right)\), the marginal point is the best point in the economic decision-making, the marginal point of the function of the function of the value of the function of the smallest value or the largest value, to determine the marginal point can be made the most conducive to the development of the regional urban and rural logistics system of the economic decision-making. This paper applies the “marginal” to analyze the contribution of the development of urban and rural logistics system (freight volume) to the strategic growth of the new development pattern (GDP), i.e., the amount of strategic growth of the new development pattern caused by the growth of one unit of the regional urban and rural logistics system. The specific formula is: \[\label{GrindEQ__5_} \frac{dy}{dx} =-a\left(\ln b\right)\times \frac{b^{x} }{\left(K+ab^{x} \right)^{2} } . \tag{5}\]
The driving effect of the growth of freight transportation in the urban and rural logistics system on the gross regional product changes at the inflection point \(\left(X^{*} ,Y^{*} \right)\), when the growth rate of the driving effect of the growth of freight transportation in the logistics system on the gross regional product changes from “increasing” to “decreasing”. The “inflection point” is a function of the second-order derivative is equal to zero, when the development of urban and rural logistics system on the new development pattern of strategic growth contribution to the inflection point in the period before the growth of the urban and rural logistics system for each growth of 1 unit of the new development pattern of strategic growth brought about by the increase in the size of logistics and increase. When the contribution of the development of the urban-rural logistics system to the growth of the NDP strategy is in the period after the inflection point, the growth of the NDP strategy per unit of growth of the urban-rural logistics system decreases with the increase of the logistics scale. When the contribution of the development of the urban and rural logistics system to the strategic growth of the new development pattern is just at the inflection point, it means that the amount of strategic growth of the new development pattern brought about by the urban and rural logistics system for each unit of growth has reached its maximum value. The value at the inflection point is satisfied: \[\label{GrindEQ__6_} \frac{d^{2} y}{d^{2} x} =\frac{-a(\ln b)^{2} \times b^{x} \times \left[\frac{1}{\left(K+ab^{x} \right)} -\frac{2ab^{x} }{\left(K+ab^{x} \right)^{2} } \right]}{\left(K+ab^{x} \right)} . \tag{6}\]
In economics, elasticity is a frequently employed concept to quantify the sensitivity of one economic variable to changes in another, specifically, the percentage change in one variable in response to a 1 percent variation in another. In this paper, we apply the notion of “elasticity” to investigate the growth rate of the Gross Domestic Product (GDP) under the New Development Pattern Strategy (NDPS), which is induced by every 1% increase in the freight volume of the urban and rural logistics system. The specific formula utilized for this analysis is: \[\label{GrindEQ__7_} \xi = \frac{dy}{dx} \times \frac{x}{y} =-a\left(\ln b\right)\times \frac{b^{x} }{\left(K+ab^{x} \right)^{2} } \times \frac{x}{\frac{1}{K+ab^{x} } } . \tag{7}\]
When \(\xi >1\), it means that the growth rate of urban and rural logistics system is less than the economic growth rate, and the growth of urban and rural logistics system promotes the growth of the strategy of the new development pattern. When \(\xi <1\), it means that the urban-rural logistics system grows faster than the economic growth rate, and the economic growth drives the development of the regional urban-rural logistics system. When \(\xi =1\), it means that the urban-rural logistics system and the new development pattern strategy are growing simultaneously.
To comprehensively analyze the interrelationship between the urban-rural logistics system and the new development pattern, this paper adopts economic development as the primary metric for formulating the strategy of the new development pattern. Seven indicators of economic development are selected, namely, GDP (X1), primary industry output value (X2), secondary industry output value (X3), tertiary industry output value (X4), total industrial output value (X5), total retail sales of consumer goods (X6), and urban and rural per capita disposable income (X7), to represent different facets of economic progress. Furthermore, cargo transportation volume (Y1), cargo turnover (Y2), and logistics infrastructure development (Y3) are identified as the key indicators of the urban-rural logistics system for subsequent analysis.Utilizing City A as a case study, the gray correlation analysis is conducted to quantify the relationship between its urban-rural logistics system and economic development over the period from 2013 to 2023. The specific outcomes of the gray correlation coefficients are presented in Table 1. Notably, during this decade-long period, the economic domain and the urban-rural logistics system in City A have exhibited a strong correlation, with all correlation coefficients surpassing 0.7. This observation underscores the significant linkage existing between the urban-rural logistics system and the strategy of the new development pattern.The primary economic indicators influencing cargo transportation volume and cargo turnover in City A are the output value of the tertiary industry and the per capita disposable income of urban residents, exhibiting strong correlations of 0.8789 and 0.9261, respectively. As the urban and rural logistics system falls within the tertiary industry, it inherently demonstrates a high degree of correlation with the output value of this sector. Additionally, the urban and rural logistics system is intimately tied to people’s daily lives, and an increase in the per capita disposable income of urban residents generally leads to an elevated demand for logistics services. Among the three primary industrial sectors, aside from the tertiary industry, the secondary industry shows the closest relationship with the urban-rural logistics system, with an average gray correlation coefficient of 0.86565. Notably, City A has long served as a pivotal industrial production hub and distribution center for consumer goods in China, where the volume of material flows is intricately intertwined with both industrial and commercial activities.Simultaneously, it is noteworthy that the correlation between the total industrial output value and both the cargo transportation volume and cargo turnover in City A is relatively weaker (with correlation coefficients of 0.7442 and 0.7869, respectively). This indicates that the current development of the urban and rural logistics system may not fully align with the demands of industrial and commercial expansion. Consequently, within the linkage mechanism between the urban and rural logistics system and City A’s new development pattern strategy, the prioritization of industry (specifically, manufacturing) and commerce in the development of a modern urban and rural logistics system is imperative. As commerce becomes more advanced, the demand for logistics services correspondingly increases, thereby facilitating the establishment of an urban and rural logistics system. Conversely, this logistics system provides vital support and assurance for the progression of industry and commerce, ultimately fostering a seamless integration between the urban and rural logistics system and the strategy of the new development pattern.
| Index | Y1 | Y2 | Y3 | Y4 |
| X1 | 0.8174 | 0.8033 | 0.8094 | 0.8456 |
| X2 | 0.7736 | 0.8703 | 0.8377 | 0.8457 |
| X3 | 0.8546 | 0.8309 | 0.7109 | 0.8914 |
| X4 | 0.8789 | 0.8444 | 0.9363 | 0.803 |
| X5 | 0.7442 | 0.7869 | 0.8248 | 0.8584 |
| X6 | 0.7575 | 0.8818 | 0.79 | 0.8866 |
| X7 | 0.7942 | 0.9261 | 0.9319 | 0.7867 |
In the aforementioned section, an initial analysis of the linkage relationship between the urban-rural logistics system and the strategy of the new development pattern within the linkage mechanism framework is conducted, utilizing the gray correlation coefficient as a tool. This subsequent section delves deeper into the influence of the urban-rural logistics system on the implementation of the new development pattern strategy within the same linkage mechanism, thereby providing robust data support for the establishment and realization of the linkage mechanism model.
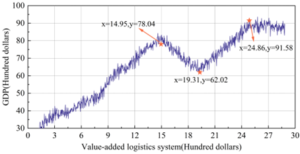
In this study, the urban and rural logistics system is designated as the independent variable (x), while the GDP under the new development pattern strategy serves as the dependent variable (y). We have analyzed the relationship between these two variables within the context of City A’s urban and rural logistics system and GDP from 2013 to 2023. The specific outcomes of this analysis, particularly the interaction between x and y, are presented in Figure 3. Herein, the horizontal axis represents the value-added of the urban and rural logistics system, whereas the vertical axis corresponds to the regional GDP under the new development pattern strategy.Our findings reveal a robust positive correlation between the urban and rural logistics system and GDP within the linkage mechanism of the urban and rural logistics system and the new development pattern strategy. Generally, it appears that the GDP of City A exhibits a pattern of initial rapid growth followed by a gradual slowdown, concomitant with the expansion of the urban and rural logistics system. Notably, at a logistics system value-added of 1.495 billion yuan, the GDP value-added peaks at 7.804 billion yuan. However, upon further increasing the logistics system’s value-added to 1.931 billion yuan, the GDP value-added unexpectedly declines to 6.202 billion yuan. This trend aligns closely with the S-shaped growth characteristics of a logistic curve, thereby justifying the selection of the logistic model as an appropriate tool for analyzing economic development within the linkage mechanism of this paper.
Utilizing the logistic model and integrating theoretical analyses encompassing marginal analysis, elasticity analysis, and inflection point analysis, this study examines the dynamics of the modern urban and rural logistics system and its impact on GDP growth in City A from 2013 to 2023. The specific quantitative outcomes pertaining to the role of the urban and rural logistics system on GDP within the framework of the new development pattern strategy are detailed in Table 2. Insights derived from the marginal analysis reveal temporal variations in the contribution of the urban and rural logistics system to economic growth under the new development pattern strategy in City A. Specifically, for every dollar increment in the value-added of the urban and rural logistics system in City A in 2014, 2019, and 2023, the corresponding GDP growth is observed to be 1.5844, 3.2589, and 3.9155 dollars, respectively.From the aspect of elasticity analysis in the strategic linkage mechanism between urban and rural logistics system and the new development pattern, the elasticity coefficients of urban and rural logistics system are all between 0 and 1.1, indicating that the pulling effect of urban and rural logistics system of City A on regional GDP is different in different periods.The elasticity coefficient in 2023 is 1.0265, which indicates that when the value-added of the urban and rural logistics system of City A is 2,695.8 million yuan, and the urban and rural logistics system then continues to increase by 1%, then the GDP of City A will increase by 1.0265%, which is the year when the urban and rural logistics system of City A has the greatest pulling effect on the strategic growth of the NDP. When the elasticity coefficient is greater than 1, the growth rate of urban and rural logistics system in City A is smaller than the growth rate of the NDP strategy, and it is mainly the urban and rural logistics system that drives the growth of the NDP strategy, and the elasticity coefficient of the year 2023 reflects this situation, which indicates that the NDP strategy as a whole develops faster than the urban and rural logistics system in that year. When the elasticity coefficient is less than 1, the urban and rural logistics system grows faster than the growth rate of the new development pattern strategy, and the growth of the new development pattern strategy promotes the development of the regional urban and rural logistics system.During the period of 2013-2022, the elasticity coefficients of the logistics of City A are all less than 1, and the new development pattern strategy promotes the regional urban and rural logistics system significantly, and the roles played by the new development pattern strategy are different in different time periods. When the elasticity coefficient is equal to 1, it indicates that the urban and rural logistics system of City A and the new development pattern strategy grow synchronously and promote each other. The results of the inflection point analysis in the linkage relationship can be found that the added value of urban and rural logistics system in City A is 2.6958 billion yuan in 2023, which is still far from the inflection point value of 5.1264 billion yuan. It indicates that the urban and rural logistics system of City A is in a period of rapid development, logistics resources are continuously integrated, and the development mode of the logistics system is changing to intensive and effective. The urban and rural logistics system in City A will continue to develop in the long term, will not reach saturation in the short term, and will also be the main growth point of the new development pattern strategy in the future due to its linkage mechanism with the new development pattern strategy.
| Year | Marginal analysis | Elastic analysis |
| 2013 | 1.5436 | 0.4531 |
| 2014 | 1.5844 | 0.4764 |
| 2015 | 1.8427 | 0.5247 |
| 2016 | 2.1774 | 0.5648 |
| 2017 | 2.5198 | 0.6395 |
| 2018 | 2.5767 | 0.6623 |
| 2019 | 3.2589 | 0.7262 |
| 2020 | 3.7766 | 0.7522 |
| 2021 | 3.7921 | 0.8171 |
| 2022 | 3.829 | 0.8458 |
| 2023 | 3.9155 | 1.0265 |
| Inflection point | \(X^{*} \)=51.264 | |
| Added value of logistics system | \(X_{2023} \)=26.958 | |
From the linkage mechanism established in this study between the urban-rural logistics system and the new development pattern strategy, it is discernible that economic development is positively correlated with logistics demand, with more economically advanced regions generally exhibiting higher logistics requirements. This section delves into the impact of economic development on the urban-rural logistics system within the context of this linkage mechanism. Specifically, the urban-rural logistics system is quantified using freight turnover (W2) and passenger turnover (W1). Given the robust correlation between freight and passenger turnover, a regression analysis is conducted to derive a regression equation, which is then utilized to convert both into a logistics equivalent. This logistics equivalent serves as a metric to quantify logistics demand within the urban-rural logistics system of City A. To mitigate the influence of price fluctuations, the real GDP for each year is calculated based on the nominal GDP and the corresponding price index.The analysis outcomes pertaining to the urban-rural logistics system and GDP of City A spanning the period from 2013 to 2023 are presented in Table 3. A visual inspection of the data reveals a clear trend: as real GDP escalates, so does the logistics equivalent within the urban-rural logistics system of City A. In 2013, when the real GDP stood at 98.138 billion yuan, the logistics equivalent amounted to merely 8.620 billion tons/km. By contrast, in 2023, under the guidance of City A’s new development pattern strategy, the real GDP surged to 382.256 billion yuan, accompanied by a corresponding increase in the logistics equivalent of the urban-rural logistics system to 12.489 billion tons/km. This augmentation underscores the concomitant growth of logistics demand with economic development, thereby reinforcing the intricate linkage between the urban-rural logistics system and the new development pattern strategy.
| Year |
Real GDP
(Hundred dollars) |
Passenger turnover
W1 |
Freight turnover
W2 |
Shipping equivalent | Logistics equivalent |
| 2013 | 981.38 | 50.76 | 41.27 | 41.83 | 86.20 |
| 2014 | 1057.40 | 67.81 | 43.16 | 46.14 | 91.50 |
| 2015 | 1097.53 | 69.23 | 48.57 | 46.2 | 96.57 |
| 2016 | 1417.72 | 78.42 | 50.71 | 47.13 | 99.16 |
| 2017 | 1540.35 | 84.13 | 50.78 | 47.28 | 100.12 |
| 2018 | 1672.93 | 92.20 | 51.01 | 48.46 | 101.71 |
| 2019 | 1674.46 | 96.85 | 58.19 | 50.07 | 101.97 |
| 2020 | 2869.04 | 169.96 | 65.33 | 51.73 | 102.65 |
| 2021 | 3545.36 | 172.97 | 68.01 | 52.07 | 118.74 |
| 2022 | 3688.00 | 183.4 | 70.38 | 55.55 | 124.57 |
| 2023 | 3822.59 | 190.14 | 71.83 | 59.58 | 124.89 |
This paper establishes a linkage mechanism between the urban-rural logistics system and the new development pattern strategy, utilizing economic development as the primary indicator of the latter. Through the application of methods such as gray correlation analysis, marginal analysis, and elasticity analysis, the study delves into the intricate relationship between these two systems within the established linkage mechanism. The findings reveal that:
The gray correlation coefficients between the urban and rural logistics system and economic development in City A, spanning the period from 2013 to 2023, are consistently above 0.7, suggesting a strong degree of linkage exists between the urban-rural logistics system and the new development pattern strategy. Among the various sectors contributing to economic development, the secondary industry demonstrates the closest relationship with the urban-rural logistics system, evidenced by an average gray correlation coefficient of 0.86565.
The relationship between the growth of the urban-rural logistics system and GDP in City A exhibits an S-shaped growth pattern, congruent with the characteristics of the logistic curve. This validation underscores the appropriateness of adopting the logistic model to analyze the economic development within the context of the linkage mechanism. Specifically, the elasticity coefficient computed for 2023 is 1.0265, signifying that when the urban-rural logistics system of City A achieves an added value of 2,695.8 million yuan and experiences a further 1% increase in growth, the GDP of City A will correspondingly grow by 1.0265%. This year marks a pivotal point where the urban-rural logistics system exerts its maximum influence on the strategic growth trajectory of the new development pattern. Additionally, our analysis reveals a positive correlation: as the real GDP of City A rises, so does the logistics equivalent within its urban-rural logistics system.
The comprehensive analysis conducted in this study reveals a robust linkage between the urban and rural logistics system and the new development pattern strategy, thereby validating the validity and rationality of the linkage mechanism model proposed herein.


