As a pillar industry of China’s social and economic development, the construction industry has caused unavoidable problems such as excessive consumption of resources and environmental pollution while developing at a high speed [1, 2]. In addition, the homogenization of China’s architectural residential design has become more and more serious over the years [3]. Currently, China’s construction industry is in a critical stage of transformation and upgrading, and the assembly building with the core of green development concept and the BIM technology and NSGA algorithms with the goal of information management are the two most important tasks [4, 5]. However, assembled buildings bring an increase in cost while improving environmental benefits, because the industry’s current understanding of assembled buildings is not thorough enough, making the development of China’s building industrialization often limited to assembled concrete structures [6, 7]. but we also need to study and promote the industrialization of cast-in-place systems, and increase the promotion of steel structures [8, 9]. The main problems in the promotion of building informatization in China are data non-interoperability, data silos, and difficulty in data exchange [10, 11]. Each participant in the project has repeated data entry in different applications and platforms, which leads to a huge waste of resources [12, 13]. The platform is not perfect and lacks incentives for the underlying applications [14].
The service of “personalized customization” appears in many modern high-end brands, mainly serving the aristocrats or celebrities, but its nature is not unfamiliar, it is in the era of non-mechanized mass production is only a kind of manufacturing and processing [15]. personalized mass customization as a new type of production method, it is for the end-users to customize the products of a method, not only can provide diversified, economical products for the user, but also can effectively avoid the type of many types of inefficiency of production production methods [16, 17].
The above research area of BIM in mass personalized and customized buildings has achieved the construction of BIM component libraries, residential customized design applications such as Wiki House, and the personalized needs and interactive design of users, although it has achieved the construction of BIM component libraries, Wiki House, and other residential customized design applications. However, purely customized components cannot achieve productivity improvement, and there is no construction of component-based combination optimization to control cost, energy consumption, and user preference from the perspective of components. Therefore, this study needs to construct the relationship between components, user preference, and energy consumption, so as to realize the fine management of components and provide a research basis for constructing a mass customization component combination optimization system.
At the beginning of the thesis, BIM software is utilized for cost simulation to establish a building cost and duration model based on direct cost, indirect cost and commissioning benefit. Apply NSGA-II algorithm for multi-objective optimization to deal with multiple conflicting objective functions in order to find the optimal combination of cost and efficiency. Contextual analysis is done using the VIKOR method to demonstrate three optimization scenarios to accommodate different user preferences. The effectiveness and stability of the method is verified by comparing the duration and cost optimization results of the algorithm iterations.
The diversity of the underlying theories and the independence of the disciplines make the building analysis tools specialized, and problems such as fragmentation of the tools, model reconstruction and protection of property rights arise. Revit used in this study belongs to the BIM software, while the models created by SketchUp and Rhino in the form of points, lines, and surfaces are currently not available to the construction industry standards for delivery, and its lack of support for IFC format export does not fully comply with the characteristics of BIM software. And building simulation software OpenStudio is SketchUp as a platform, integrated building performance analysis engine LadybugTools and integrated multi-objective algorithms Wallacei to Rhino and Grasshopper as a platform. The advantages of each platform need to be utilized to assist in building design. In the face of multi-platform, multi-disciplinary joint analysis, the basic problem is the circulation and sharing of data, the need to establish common data standards, make full use of the BIM model, in support of building design, construction and other phases at the same time, to meet the requirements of the building performance simulation, to avoid duplication of the modeling, breaking the “information silo”, to realize the “one model, many calculations”. “One model, many calculations”.
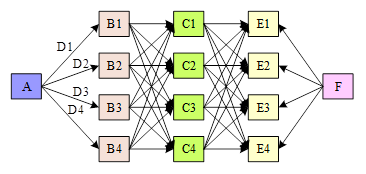
There exists a certain constraint relationship between schedule and cost, i.e., shortening the schedule will cause the cost to increase, and cost reduction will cause the schedule to be extended. This kind of problem in which the objective value of one function is reduced to increase the objective value of another function is called a multi-objective optimization problem, which can also be expressed as the minimum point cost shortest path problem (MCSP) in graph theory, whose directed graph is shown in Figure 1. By determining the duration for each process and preparing a construction plan, an equilibrium state is sought between the contingency state and the normal state to achieve the integrated optimization of schedule-cost. Where each process is represented by a node, where the English letter inside the node indicates the number of the process. The purpose of the duration-cost optimization problem studied in this paper is to find a shortest path from node A to node F that minimizes the cost of all nodes.
In order to reduce the number of iterations of the algorithm, the optimal solution obtained is more accurate and objective, it is necessary to make the corresponding assumptions in the establishment of the duration-cost optimization model;
Assumption 1: There are no other resource constraints and no rework problems in each process.
Assumption 2: The construction organization design of the project has been determined, involving the planned duration and cost targets to determine, before the completion of all processes, the program will not make significant adjustments.
Assumption 3: Process duration and cost have a certain functional relationship. Table 1 is a note on the notation used in this paper.
| Symbol | Implication | Symbol | Implication |
|---|---|---|---|
| \(C_{1}\) | Direct cost | \(T_{\max }\) | Contract period |
| \(C_{2}\) | Indirect cost | \(T\) | Construction period |
| \(P\) | Put into operation benefit | \(n\) | Number of processes |
| \(D_{il}\) | Normal schedule of the i process | \(C_{1i}\) | Direct costs of work i |
| \(D_{ie}\) | Emergency duration of operation i | \(C_{2i}\) | Indirect costs of work i |
| \(D_{i}\) | Duration of item i work | \(C_{1i\min }\) | Direct contingency costs for item i work |
| \(K_{1}\) | Marginal cost coefficient | \(C_{1i\max }\) | Normal direct costs of work in Item i |
| \(M\) | Daily overhead | \(\alpha\) | Reward and punishment factor |
The project cost is mainly composed of direct and indirect costs, but the benefits of commissioning the project after completion are added to take into account the effect of the duration of the commissioning phase on the cost. A nonlinear function is used to describe the relationship between each cost element and process duration.
1) Direct cost
Once the duration is adjusted in the project, the cost will change accordingly. Accelerate the construction schedule at the same time, need to invest more labor and mechanical equipment. Labor and machinery and equipment costs are an important part of the direct costs of the project, i.e., the increase in the duration of the process leads to an increase in direct costs. However, considering that the total amount of manpower and machinery to be invested in a certain process is certain, the cost of catching up will not always decrease with the increase in the duration of the work, and therefore the decrease in direct costs will slow down, i.e., \[\label{GrindEQ__1_}\tag{1} C_{1i} =C_{1i\min } +k_{1} \left(D_{il} -D_{i} \right)^{2}.\] \[\label{GrindEQ__2_}\tag{2} k_{1} =\frac{C_{\lim ax} -C_{\lim in} }{\left(D_{il} -D_{ie} \right)^{2} }.\]
2) Indirect Costs
Project indirect costs are mainly composed of taxes, management fees, office expenses and other fixed costs, and the duration of a process does not have a clear correlation, can be approximated as a single working day of indirect costs as a fixed value. That is, \[\label{GrindEQ__3_}\tag{3} C_{2i} =M*D_{i}.\] \[\label{GrindEQ__4_}\tag{4} M=\frac{C_{2} }{T}.\]
3) Commissioning Benefits The shorter the duration of individual activity processes, the faster the duration is accordingly, and the sooner the project is commissioned and running, the greater the time value of money generated, i.e., \[\label{GrindEQ__5_}\tag{5} P=\alpha \left(T-T_{\max } \right),\] where \(\alpha =\left\{\begin{array}{l} {\alpha _{1} T-T_{\max } \ge 0} \\ {\alpha _{2} T-T_{\max } \le 0} \end{array}\right.\), \(T=\sum D_{i}\).
In summary, the relationship between cost and process duration can be expressed as: \[\label{GrindEQ__6_}\tag{6} C_{i} =C_{1i} +C_{2i} +P.\]
Establish the mathematical modeling equation. The objective function 1 is, \[\label{GrindEQ__7_}\tag{7} MinC=\sum C_{i}.\]
The objective function 2 is, \[\label{GrindEQ__8_}\tag{8} MinT=\sum D_{i}\].
The constraints are, \[\label{GrindEQ__9_}\tag{9} \left\{\begin{array}{l} {D_{ie} \le D_{i} \le D_{il} } \\ {T\le T_{\max } } \end{array}\right. .\]
Personalized mass customization of building construction site temporary facilities combination optimization problem usually involves multiple objective functions, and the indicators of each objective function often conflict with each other and are difficult to coordinate. In order to solve the above multi-objective optimization problem, a multi-objective evolutionary algorithm (MOEA) based on dominance relationship is proposed.
Multi-objective optimization problem (MOP), which consists of objective functions and related constraints, is given below as a general description about MOP.
For a given decision variable \(X=\left(x_{1} ,{\rm \; }x_{2} ,…,{\rm \; }x_{n} \right)\), the following constraints need to be satisfied, \[\label{GrindEQ__10_}\tag{10} \left\{\begin{array}{l} {g_{i} (X)\ge 0,i=1,2,\cdots k} \\ {h_{i} (X)=0,i=1,2,\cdots ,w} \end{array}\right. .\]
In an optimization problem, assume that there is \(r\) optimization objective, and the optimization objective is denoted as, \[\label{GrindEQ__11_}\tag{11} f(X)=\left(f_{1} (X),f_{2} (X),\cdots ,f_{n} (X)\right).\]
In a multi-objective optimization problem, the aim is to find \(X^{*} =\left(x_{1}^{*} ,x_{2}^{*} ,\cdots ,x_{n}^{*} \right)\) that satisfies the aforementioned constraints such that \(f(X)\) satisfies Eq. 11 while reaching optimality.
Unlike single-objective optimization problems, multi-objective optimization problems cannot take into account all objectives. Given a multi-objective optimization problem \(\min f\left(X\right)\), \(X^{*} \in \Omega\) is optimal if \(\forall X\in \Omega\), satisfies one of the following two conditions, \[\label{GrindEQ__12_}\tag{12} \left\{\begin{array}{l} {{\mathop{\wedge }\limits_{i\in I}} \left(f_{i} (X)=f_{i} \left(X^{*} \right)\right)} \\ {{\mathop{\wedge }\limits_{j\in I}} \left(f_{j} (X)>f_{i} \left(X^{*} \right)\right)} \end{array}\right.\] where \(I=\{ 1,2,\cdots ,r\}\), then \(\Omega\) is said to be a feasible solution set satisfying Eq. 12 , i.e., \[\label{GrindEQ__13_}\tag{13} \Omega =\left\{X\in {\rm R}^{n} \left|g_{i} \left(X\right)\ge 0,h_{j} \left(X\right)=0\right. ,\left(i=1,2,\cdots ,k;j=1,2,\cdots ,w\right)\right\}. \]
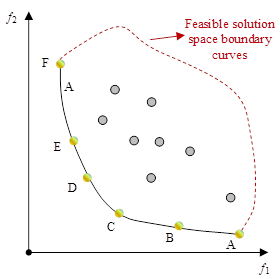
The set of Pareto optimal solutions to a multi-objective optimization problem, expressed in the space of objective functions, is known as the Pareto optimality bound (\(PF^{*}\)). It is defined as follows, \[\label{GrindEQ__14_}\tag{14} PF^{*} =\left\{f(X)=f_{1} (X),f_{2} (X),\ldots ,f_{r} (X)\left|X\in X^{*} \right. \right\}.\]
Taking the two-dimensional target space as an example, the Pareto optimal boundary is shown in Figure 2, and the Pareto optimal boundary is the curve ABCDEF.
The Non-dominated Sorting Genetic with Elite Strategies (NSGA-II) algorithm is an improvement on the NSGA algorithm, compared to the NSGA algorithm, the NSGA-II algorithm is improved in the following three ways,
a. proposing a fast non-dominated sorting method
The fast non-dominated sorting makes the complexity of the optimization algorithm decrease from the original \(O(rN^{3} )\) to \(O(rN^{2} )\), where \(r\) is the number of objective functions and \(N\) is the population size, which improves the computational efficiency.
b. Introduction of crowding comparison operator
The crowding comparison operator eliminates the influence of artificially specified sharing parameters. And it makes the individuals in the population can be uniformly expanded to the whole Pareto space, so as to ensure the diversity of the population.
c. Introduction of elite strategy
The elite strategy expands the sampling space and retains the optimal individuals.
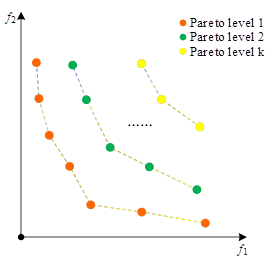
In NSGA-II algorithm, the dominance relationship reflects the relative merits of individuals. Assume that the size of the population Pop is \(N\), the population is sorted by non-inferiority hierarchy to obtain \(k\) non-inferior frontiers \(P_{1} ,P_{2} ,\cdots ,P_{k}\), and each non-inferior frontier satisfies the following conditions,
\(\bigcup _{p\in \left\{P_{1} ,P_{2} ,\cdots ,P_{k} \right\}}P =Pop.\)
For \(\forall i,j\in \{ 1,2,\cdots ,k\} ,i\ne j,P_{i} \cap P_{j} =\emptyset\).
\(P_{1} \succ P_{2} \succ \cdots \succ P_{k}\), i.e., the individual in \(P_{l+1}\) is directly governed by the individual in \(P_{l}\), \((k=1,\cdots ,l-1)\).
Let two vectors \(\left\{n_{p} \right\}\) and \(\left\{s_{p} \right\}\), where \(p\in Pop\), \(n_{p}\) are the number of individuals dominating individual \(p\) and \(s_{p}\) is the set of individuals dominated by individual \(p\), viz \[\label{GrindEQ__15_}\tag{15} n_{p} =\left|\left\{q\left|q\succ pp,q\in Pop\right. \right\}\right|,\] \[\label{GrindEQ__16_}\tag{16} s_{p} =\left|\left\{q\left|p\succ qp,q\in Pop\right. \right\}\right|.\]
The \(n_{p}\) and \(s_{p}\) for each individual are calculated by binary loops, then \(P_{1} =\left\{q|n_{q} =0,q\in Pop\right\}\), and then \(P_{k} =\left\{q|n_{q} -k+1=0\right\}\) is calculated sequentially in the same way, and the resulting Pareto rank stratification is calculated as shown in Figure 3 until all individuals have been assigned to the appropriate stratum.
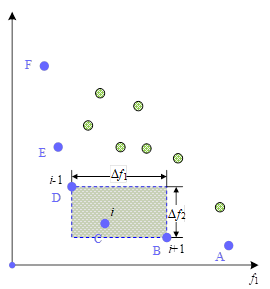
To maintain population diversity, Deb introduced the concept of crowding. The crowding distance of individual \(i\) is shown in Figure 4, and the aggregation distance of individual \(i\) is \(P[i]_{distance}\) assumed to be the value of \(P[i].t\) as a function of individual \(i\) on the objective function \(t\) in a two-dimensional space: \[\label{GrindEQ__17_}\tag{17} P[i]_{dis\tan ce} =\left(P[i+1]\cdot f_{1} -P[i-1]\cdot f_{1} \right)+\left(P[i+1]\cdot f_{2} -P[i-1]\cdot f_{2} \right). \]
Extending to the general case, when there is \(r\) subgoal, the aggregation distance of individual \(i\) is: \[\label{GrindEQ__18_}\tag{18} P[i]_{dis\tan ce} =\sum _{j=1}^{r}\left(P[i+1].f_{j} -P[i-1].f_{j} \right).\]
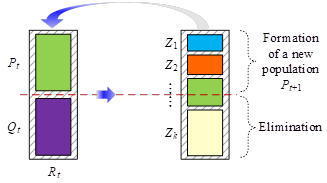
In NSGA-II optimization algorithm, the parent population and the offspring population will be combined together to form a mating pool. Individuals in the mating pool generate the next generation population by competing with each other. This is conducive to the transfer of excellent genes from good individuals to the next generation, thus improving the accuracy of the optimization results. The specific process is shown in Figure 5,
Merge parent population \(P_{t}\) as well as child population \(Q_{t}\) to form a new population \(R_{t}\).
Generate a number of Pareto rank subsets \(Z=\left(Z_{1} ,Z_{2} ,\cdots ,Z_{k} \right)\) based on a fast non-dominated sorting rule.
Select the first \(N\) individuals in \(R_{t}\) to form the next-generation parent population \(P_{t+l}\), and the remaining individuals are eliminated.
In this case, we take the house type E of the H1 building of the L project in G city as the object of study, and set the quantity constraints of the required prefabricated components according to the original residential design based on the component information in the database of mass customized components. The length and projected area constraints of the components are set, a multi-objective optimization model is established using the NSGA-II algorithm, and the Pareto solution set is selected after iterative evolution, and the contextual analysis of the three component selection scenarios is carried out based on the user’s weight settings for cost, energy consumption, and preference.
From the point of view of industrial construction, a single-story residential house type contains a variety of components such as prefabricated slab B, prefabricated balcony Y, prefabricated interior wall N, prefabricated exterior wall W, prefabricated air-conditioning panel K, prefabricated beam L, prefabricated window P, etc. These components are classified into types according to their materials, uses, and construction characteristics. And these components are divided into different types according to different materials, uses, construction characteristics and so on. For example, prefabricated panels are divided into prefabricated PK panels, prefabricated laminated panels, prefabricated hollow core panels, prefabricated waffle panels and so on.
The study sample house type requires a variety of building blocks (=7, containing B, Y, N, W, K, L, P, where 1 stands for building block B, 2 stands for building block Y, and so on) to form a mass-customized house, each type of component requires \(j(j=1,2,…,n)\) respectively, the amount of work for each component is \(Q_{ij}\), the cost of production is \(C_{ij}\), and the energy consumption of the building is \(B_{ij}\), The user preference is \(P_{ij}\) with a projection area of \(A_{ij}\). Q, I, C, B, P, A, L, M, etc. are selected as the main parameters of the building blocks. The combination chosen for each building block is\(B=\{ B_{1} ,B_{2} ,…,B_{j} \}\) and the final combination scheme is \(\mathrm{\{}\)B, Y, N, W, K, L, P\(\mathrm{\}}\).
Taking the components in the database as the selection range of the customized building combination scheme, the minimum value of the cost and energy consumption of the large-scale customized building, and the maximum value of the user’s preference as the optimization objectives, the initialized population size is set to be 500, and the number of iterations is 20,000 generations, and the number of \(\mathrm{\{}\)B, Y, N, W, K, L, and P\(\mathrm{\}}\) is \(\mathrm{\{}\)10, 3, 5, 5, 10, 50, and 1\(\mathrm{\}}\), and the NSGA-II algorithm for multi-objective optimization, and the multi-objective optimization results are obtained as shown in Figure 6, which contains 191 pareto solutions. From the pareto solution set in the figure, it can be seen that after 10,000 iterations, the three objective values of the optimization objectives have been stabilized and formed a good image of the three-dimensional curved surface, and the effective solutions account for 92% of the total number of solutions, with uniform distribution, and the above 191 solutions are the effective solutions of the combinatorial optimization scheme for personalized mass customization of buildings.
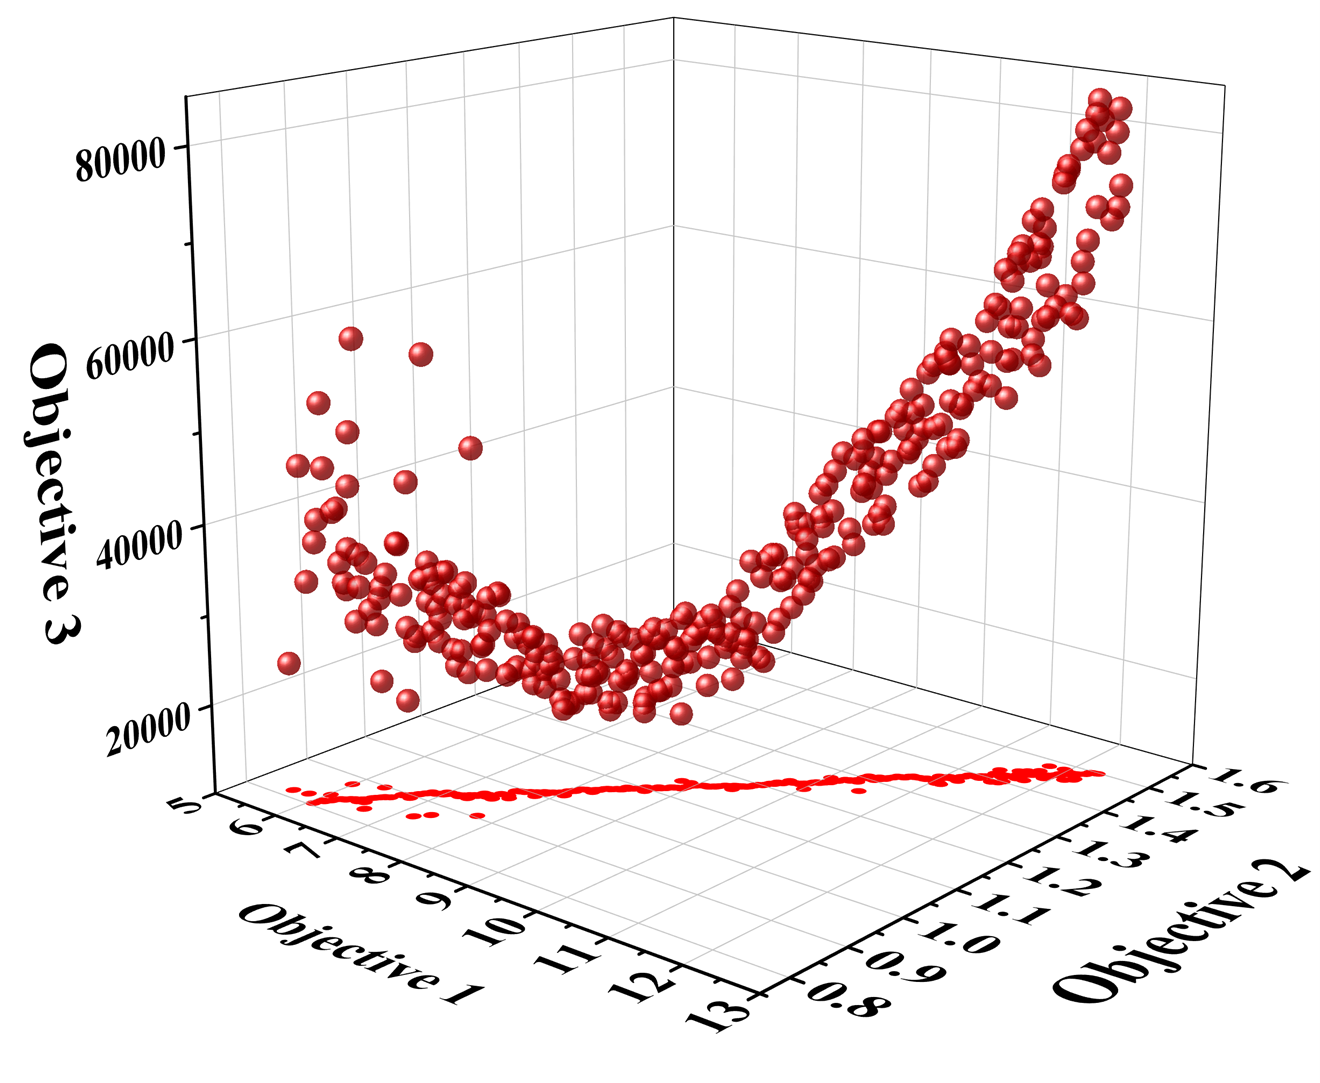
The circular scatter is the set of Pareto solutions obtained by combining the three objectives of energy consumption, cost and user preference. The VIKOR method is used to analyze the optimal combination of solutions under three scenarios by changing the weights on the three objectives. The following are the weights set under the three scenario analysis based on the user perspective,
The importance given to cost is greater than the importance given to preference.
The importance given to cost is less than the importance given to preference.
the importance given to cost is equal to the importance given to preference.
This study set the weight of energy consumption to a fixed 0.2 to position it as a more important objective indicator. In order to make the cost objective and preference objective produce the perspective of component differentiation, the two indicators are set to 0.5:0.3, 0.3:0.5, 0.4:0.4 according to the three cases, cost: preference, respectively.The compromise solution is the ideal solution of the VIKOR method for solving the multi-objective optimization model, and any point U in the Pareto solution is set as the ideal solution, so that the overall utility is maximized and the individual regret is minimized VIKOR method can solve the multi-objective optimal solution.
Assuming \(v\)= 0.2, the overall utility and individual regret of each solution and the ideal solution are calculated to obtain the comprehensive evaluation index. The comprehensive evaluation indexes of the 191 Pareto solutions are ranked, and the main parameters of the top 2 optimal solutions are shown in Table 2, in which the No. 131 of the No. 1 ranking and the No. 158 of the No. 2 ranking are the optimal solutions.
| Sort | 1 | 2 |
|---|---|---|
| Quantity of work | 18.27 | 17.96 |
| Projected area | 85.33 | 81.27 |
| Member length | 130.54 | 124.38 |
| Cost | 58493.37 | 56784.77 |
| Energy consumption | 51227.56 | 50321.45 |
| Carbon emission | 1316.83 | 1297.42 |
| Preference | 4.56 | 4.11 |
| Scheme number | 131 | 158 |
Setting the cost, energy consumption, and preference weights to 0.5, 0.2, and 0.3 in turn, with a compromise coefficient of 0.5, the results of the compromise coefficient changes carried out for programs 131 and 158 are shown in Table 3. The value of \(v\)\(\mathrm{\in}\) [0, 1] is taken 10 times, and the stability of the evaluation model is tested by changing the compromise coefficient \(v\) and conducting sensitivity analysis. Through the above sensitivity analysis, it is found that the ranking of the 6 alternatives is mainly dominated by Option 131, Option 158, Option 142, Option 156 and Option 137 at different values. Therefore, it can be determined that the model is insensitive to \(v\) perturbations, further indicating that the method has good stability. From the table, it can be seen that a change in the trade-off coefficient causes a change in the ranking results. When the compromise coefficient is \(v{\rm <0.2}\), the ranking result 131\(\mathrm{>}\)158\(\mathrm{>}\)other schemes, the best compromise solution is scheme 131 with scheme 158. When the compromise coefficient is \({\rm 0.2<}v{\rm <0.5}\), the first ranked schemes are all 158, the compromise solution is scheme 131 with scheme 142 with 137. Therefore, the decision maker chooses different compromise coefficients and chooses different compromise solutions.
| Sort | 0 | 0.1 | 0.2 | 0.3 | 0.4 | 0.5 | 0.6 | 0.7 | 0.8 | 0.9 |
|---|---|---|---|---|---|---|---|---|---|---|
| 1 | 131 | 131 | 158 | 158 | 158 | 158 | 156 | 137 | 142 | 158 |
| 2 | 158 | 158 | 131 | 142 | 142 | 137 | 158 | 103 | 121 | 137 |
| 3 | 137 | 137 | 156 | 2 | 131 | 142 | 1 | 142 | 156 | 2 |
| 4 | 156 | 142 | 2 | 137 | 156 | 156 | 137 | 158 | 137 | 142 |
| 5 | 142 | 1 | 137 | 2 | 137 | 1 | 142 | 156 | 138 | 2 |
| 6 | 1 | 156 | 142 | 156 | 2 | 2 | 1 | 2 | 106 | 156 |
| Compromise solution | 131/ 158 | 131/ 158 | 158/ 131 | 131/ 142 | 158/ 142 | 131/ 137 | 156/ 158 | 137/ 103 | 142/ 121 | 158/ 137 |
In order to verify the validity and reliability of the algorithm, this study takes the customized building dimensions of (15,11) and (21,11) as an example, and firstly solves the optimal solution for the three sub-objective (cost, energy consumption, and preference) functions. The experiment confirms that there is an absolute dominant solution, i.e., all three objective values are lower than the original combination solution, which is 57834.75, 53481.45, and 3.95, respectively, in comparison with the original combination solution, indicating that the original combination solution gets a more reasonable solution after optimization of the model in this study. When the number of iterations reaches 10,000, the optimization result tends to be stable, and its custom building dimensions and its optimization objective values are shown in Table 4. 191 solutions are screened to obtain the four optimal combination solutions of a, b, c, and d. The four optimal combination solutions of a, b, c, and d are shown in Table 4. Among the four schemes, the cost sub-objective (\(F_{1}\)) is optimal, i.e., \(F_{1}\) is minimized to 55283.34 for scheme b. The energy consumption sub-objective (\(F_{2}\)) is optimal to 50805.42 for scheme d, and the preference sub-objective (\(F_{3}\)) is optimal to 4.68 for scheme a. The optimal combination of the four schemes is shown in Table 4.
| Option | Size 1 | Size 2 | Size 1 (x,y) | Size 2 (x,y) | \(F_{1}\) | \(F_{2}\) | \(F_{3}\) |
|---|---|---|---|---|---|---|---|
| a | 16,13 | 20,21 | (45,18) | (43,20) | 58118.25 | 52039.61 | 4.68 |
| b | 15,10 | 19,17 | (42,20) | (30,18) | 55283.34 | 51809.66 | 4.37 |
| c | 18,12 | 20,24 | (28,21) | (27,25) | 56935.71 | 53043.28 | 4.20 |
| d | 13,14 | 16,18 | (30,18) | (25,24) | 56583.59 | 50805.42 | 4.08 |
| Original scheme | 15,11 | 21,11 | (31,24) | (31,28) | 57834.75 | 53481.45 | 3.95 |
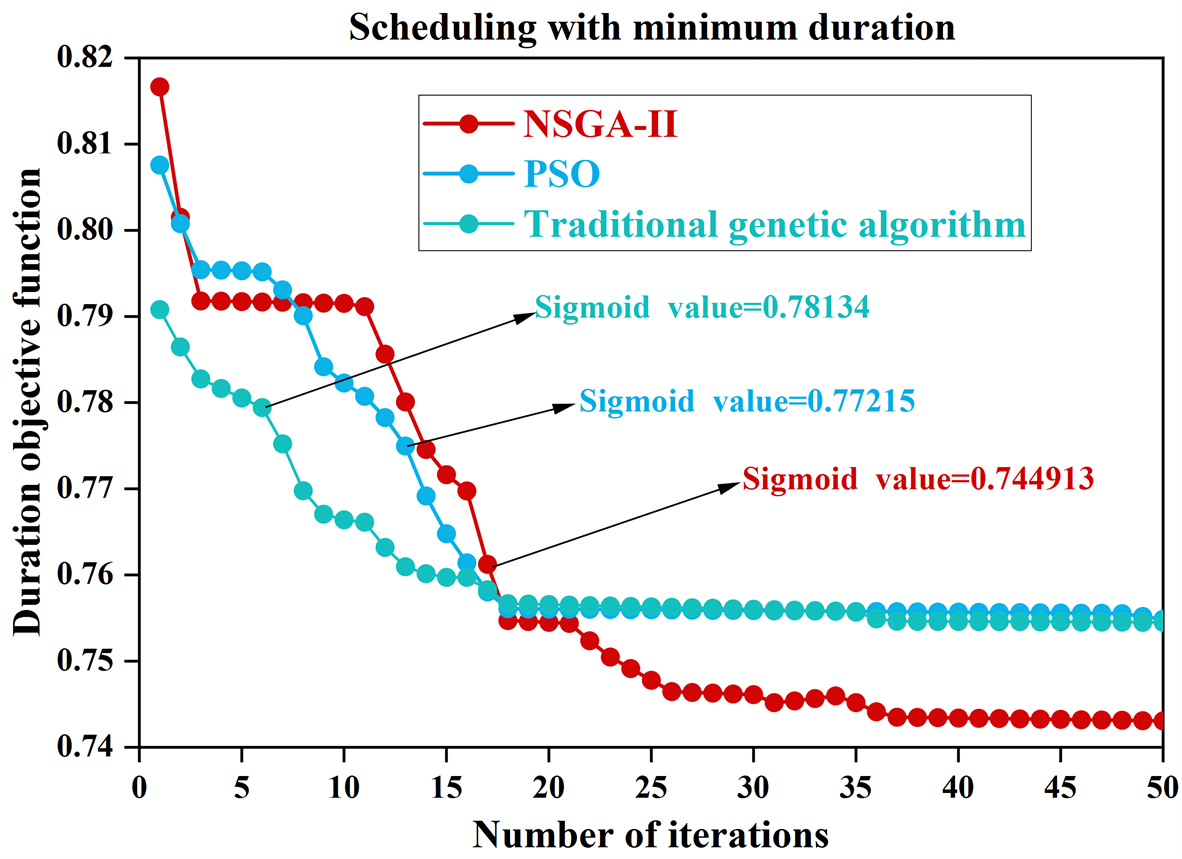
The personalized mass customization building portfolio solution not only pursues the maximization of cost, energy consumption, and preference, but also achieves the goal to get the minimum duration. In this paper, the shortest duration decision is converted into the shortest duration scheduling problem, and the NSGA-II algorithm is used to establish a multi-objective optimization model to iteratively obtain the objective function value after sigmoid function processing. At the same time, in order to reflect the principle of comparability, the study in this paper takes the traditional genetic algorithm and PSO as a comparison item. The results of the shortest duration decision-making under the iteration of the three algorithms are shown in Figure 7, and it can be seen that the objective function values of the traditional genetic algorithm and the PSO algorithm are 0.78134 and 0.77215, respectively, while the objective function value of the NSGA-II algorithm proposed in this paper is 0.744913, which is able to realize the convergence more quickly. From the shortest duration calculation results, the duration of NSGA-II algorithm is only 43 days, which is also smaller compared to the traditional genetic algorithm and PSO algorithm.
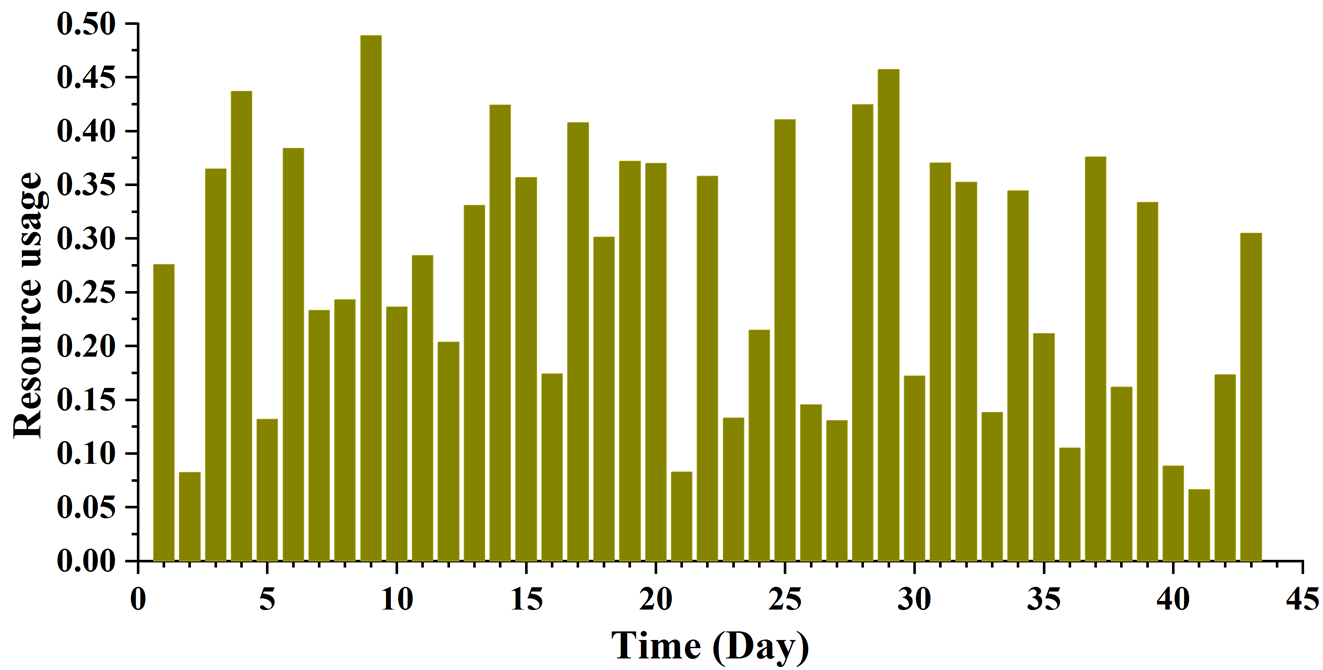
From the construction side, if we want to complete the construction project as soon as possible, then we also need to leave enough buffer time for each project, on the one hand, there is a buffer time in the case of the previous process has not been completed, and clearly know how long the next process is still to come. Then the equipment and resources required for the next process can be prepared in advance, and thus can be comfortably docked between the next two processes to complete the project. On the other hand, the reason for the buffer is to cope with the impact of various uncertainties on the project. The more buffer time is allowed, the more time is available to prepare and cope with the uncertainty, and the demand for resources will be reduced accordingly. The buffer time for all tasks is obtained by NSGA-II algorithm as shown in Figure 8. The resource usage of 43 days under the minimum duration can be obtained, in which day 41 has the smallest resource usage of 0.067 and day 9 has the largest resource usage of 0.489. The project executives can prepare in advance by focusing on projects and activities with high resource mobilization, so that the executives can take certain measures to cope with the uncertainties when they occur. In some construction situations with large resource constraints, the NSGA-II algorithm is used for decision making and designing, which ultimately results in a relatively short duration with good goal achievement and a good buffer against uncertainty risks in construction.
In this study, cost and efficiency optimization of personalized mass-customized buildings is achieved by integrating BIM and NSGA-II algorithms. The experimental results show that the application of this method can effectively find the optimal balance of cost and efficiency. After 20,000 generations of iterations, 191 effective Pareto solutions were obtained, demonstrating the stability and uniform distribution of the optimization objective with 92% effectiveness. Through VIKOR context analysis, we propose three different optimization schemes based on different user preferences, demonstrating the trade-off between cost and preference. In addition, we conduct a comparative analysis of the optimization results of the algorithm under different component sizes to verify the practicality and flexibility of the method.
This method can help construction managers to efficiently schedule resources, shorten construction period and reduce cost. This study demonstrates the value of BIM and NSGA-II algorithms in the field of custom construction and provides new ideas and methods for cost-effective optimization of future construction projects.
BIM and NSGA-II algorithm based mass customized building assembly optimization system and simulation design study uses a simple case study to confirm the feasibility of such a scheme. However, in the selection of research objects, only PC components were targeted and all assembled components were not considered in an all-round way. In the future research, it is necessary to continue to refine the construction mode of database management, improve the ability of information management, better provide the basis for decision makers, and enhance the current stage of the building management system to be more scientific and operational.


