tiquette constitutes a fundamental skill essential for navigating social interactions globally, serving as a comprehensive indicator of an individual’s personal qualities and capabilities. China, as a nation deeply rooted in etiquette, has a long-standing tradition that prioritizes this virtue. In Confucius’s seminal educational framework encompassing “rituals, music, archery, charioteering, calligraphy, and arithmetic,” “rituals” (etiquette) occupy a paramount position [1-3]. Similarly, Western culture boasts a rich heritage of etiquette, with religious beliefs forming a pivotal foundation for its development. The diversity of religious beliefs has, in turn, shaped distinct cultural etiquette practices among Western societies. Despite the profound disparities between Chinese and Western cultural etiquette, these traditions are increasingly converging in contemporary society [4-6].In the present context, a notable trend among aspiring civil aviation professionals, particularly those enrolled in higher vocational education programs, is their embrace of Western culture, fostering a pursuit of individuality and self-expression. However, this demographic often exhibits limited knowledge of etiquette, resulting in behavior that lacks the requisite refinement. Paradoxically, the civil aviation industry is increasingly demanding of impeccable etiquette and manners, creating a dissonance with the current state of prospective professionals’ inadequate etiquette education. Consequently, the reinforcement of etiquette education emerges as a paramount imperative.
Etiquette encompasses a comprehensive set of behavioral norms observed during social interactions, aimed at fostering mutual respect and discipline throughout a predefined and agreed-upon sequence of actions [7,8]. Fundamentally, etiquette serves to regulate and guide individuals’ conduct, shaping their attitudes, motivations, speech, and behavior within society. It facilitates the coordination of interpersonal relationships, maintains societal order, and plays a pivotal role in various social endeavors.In the context of civil aviation education, etiquette not only governs students’ behavior within the academic setting but also prepares them for professional interactions with passengers and colleagues in future roles [9-12]. Importantly, this “regulation” does not imply restriction or undue constraint; rather, it enhances their ability to communicate effectively and positively with others.Furthermore, etiquette education promotes mutual understanding and respect, fostering a culture of open communication. The acquisition and practice of etiquette signifies maturity and sensibility among civil aviation professionals, positioning them to assume significant responsibilities [13-15]. The ultimate goal of civil aviation service etiquette education is to equip professionals with impeccable manners, moral character, refined speech and conduct, high-quality service delivery, and an exemplary public image, both in their personal lives and throughout their academic pursuits, internships, and professional careers.
This study initially delves into the fundamental standards of service etiquette and the comprehensive content of professional training tailored specifically for civil aviation majors. Consequently, a foundational framework for etiquette professional training within the realm of civil aviation education is devised. Subsequently, a multiple regression analysis model is formulated, and its foundational performance is examined through rigorous model parameter estimation and statistical significance testing. This model is then utilized to analyze students’ proficiency in service etiquette knowledge, leveraging the power of multiple linear regression.Furthermore, the study investigates the correlation between various vocational skills training methodologies and students’ subsequent income levels, employing the chi-square test for statistical validation. Lastly, the advanced technique of maximum likelihood estimation is applied to regress students’ employment outcomes, thereby elucidating the impact of service etiquette training on both their employment prospects and salary trajectories.
A service represents an economic activity that is rendered by one party to another. Within a specified time frame, the service provider endeavors to achieve a desired outcome for the service recipient, which may encompass individuals, entities, or properties. From a process-oriented perspective, services can be categorized into four broad domains: human services, tangible services, spiritual services, and information services.Service standards, conversely, are a set of prescriptive norms devised to satisfy the requirements of service recipients and ensure the delivery of efficient and high-quality services. The defining characteristics of these standards include their clarity, quantifiability, measurability, feasibility, time-bound nature, and direct relevance to the needs of customers. These attributes collectively contribute to the standardization and optimization of service delivery processes.
Service etiquette constitutes the fundamental qualities and prerequisites essential for individuals engaged in the service industry. It encompasses the manifestation of courteous behaviors and virtues displayed during service delivery, stemming from a genuine respect and camaraderie towards customers. This encompasses various facets such as professionalism in instrumentation, personal grooming, etiquette in speech, operational proficiency, and other relevant aspects. Service etiquette is distinguished by its universal applicability, historical continuity, cultural distinctiveness, and adaptation to the contemporary era.Within the hospitality sector, the application of service etiquette is exceedingly pervasive, extending to diverse areas including catering, front-desk reception, conference management, leisure activities, entertainment services, room service, and security operations, among others. The ubiquitous nature of service etiquette underscores its importance in fostering a positive customer experience and maintaining high standards of professionalism across the industry.
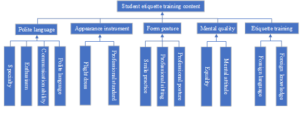
(a) Courtesy and professional service language training: The comprehensive training program for aspiring flight attendants encompasses a diverse array of modules, with the cornerstone being the instruction in polite and professional service language. In the service industry, where the majority of roles necessitate the adoption of a standardized professional vocabulary, this aspect of training is paramount. For instance, in customer service, a sector that is frequently encountered in our daily lives, the term “pro” frequently recurs as a testament to professionalism. Similarly, for flight attendants in training, emphasis must be placed on mastering service language in conjunction with the theoretical underpinnings of flight attendant etiquette. Employing professional and enthusiastic service language is instrumental in fostering a positive first impression among passengers, as it serves as the cornerstone for establishing a professional and formal rapport. Moreover, flight attendants are instructed to prioritize politeness in their interactions with passengers. Figure 1 outlines the structured framework for professional etiquette training tailored specifically for civil aviation students.
(b)Grooming, professional flight attendant attire: The term “flight attendant staff” is often associated with attributes such as “temperament,” “high value,” and “good figure,” thereby underscoring the paramount importance of the external image projected by flight attendants. Consequently, during the initial phase of flight attendant etiquette training, students are required to adopt the professional attire of flight attendants. This attire includes not only the essential uniform and high heels but also necessitates the mastery of silk scarf-tying techniques, which is a vital skill for flight attendants. Given the limited time available for attire changes during actual work, flight attendants must be adept at dressing swiftly and appropriately. Moreover, teachers must also impart training in hair styling, as flight attendants adhere to a uniform coiffure methodology that necessitates strict adherence to professional standards. This training fosters the development of habits that will serve them well during subsequent interviews and in their professional careers.
(c)Gesture, a bright aviation image: The refinement of appearance and posture necessitates a holistic approach, encompassing both internal and external aspects. This includes foundational training in smile execution, as well as professional sitting and standing postures. Teachers must adhere to a structured and meticulous training program to systematically guide students through these essential skills. In the context of smile etiquette practice, a common exercise is the “bite chopsticks” method, where students utilize a chopstick to create and maintain an optimal smile curve by observing their reflection in a mirror. Additionally, for sitting posture exercises, individual chairs are provided for each student, enabling the teacher to focus on the intricacies of proper sitting, emphasizing both the “sitting in” and “sitting up” positions.
(d)The concept of service and the development of psychological quality: Upon initial acquaintance with the flight attendant profession, some students perceive it as a highly esteemed occupation. However, upon deeper understanding, they recognize that it falls within the realm of the service industry. For contemporary university students, this psychological disparity can be challenging to accept, as they often envision their years of academic pursuits culminating in a role that transcends mere service. Consequently, a pivotal aspect of flight attendant education involves fostering psychological resilience among students. The objective is to impart the understanding that all industries are inherently equal, honorable endeavors, deserving of equal respect. Teachers must guide students in reframing their mindset, fostering an appreciation for the flight attendant profession, and ultimately, cultivating a genuine passion for the industry, either as an initial motivation or as a result of their educational journey.
(e)Strengthening language skills: In addition to fostering an external image and psychological resilience, universities should also impart systematic professional training in linguistic competence to students pursuing flight attendant majors. Given the likelihood of interacting with diverse international passengers during international flights, students must possess proficient foreign language communication skills to ensure a superior service experience for clients. Consequently, universities must prioritize not only the instruction of flight attendant-specific professional knowledge but also the development of students’ foreign language proficiency. Strengthening students’ foreign language education is crucial, as fluency in a second language can significantly enhance their employability and performance in future careers.
Linear regression is categorized into one-way linear regression and multiple linear regression. A one-dimensional linear regression model is a linear regression problem in which the dependent variable \(y\) is related to only one independent variable \(x\). However, in many practical problems, the univariate linear regression model is only a special case of regression analysis, which is usually the result of simplified consideration of many factors affecting a certain phenomenon. In this paper, a multiple linear regression model is introduced and used to consider the relationship between the effects of two or more independent variables on the change in the quantity of a dependent variable.
The general form of the multiple linear regression model is as follows: \[\label{GrindEQ__1_} y=\beta _{0} +\beta _{1} x_{1} +\beta _{2} x_{2} +\cdots +\beta _{p} x_{p} +\varepsilon , \tag{1}\] where \(\beta _{0} ,\beta _{1} ,\cdots ,\beta _{p}\) is the \(p+1\) unknown parameter, \(\beta _{0}\) is called the regression constant, \(\beta _{1} ,\cdots ,\beta _{p}\) is called the regression coefficient, \(y\) is the dependent variable, \(x_{1} ,x_{2} ,\cdots ,x_{p}\) is the independent variable, and \(\varepsilon\) is the random error. (Eq. (1) expresses the statistical relationship between the dependent variable \(y\) and the independent variable \(x_{1} ,x_{2} ,\cdots ,x_{p}\), and the prediction of the variable \(y\) can be made by determining this statistical relationship. If an estimate of the coefficient \(\beta _{0} ,\beta _{1} ,\cdots ,\beta _{p}\) is given, denoted as \(\hat{\beta }_{0} ,\hat{\beta }_{1} ,\cdots ,\hat{\beta }_{p}\) respectively, it is called: \[\label{GrindEQ__2_} y=\hat{\beta }_{0} +\hat{\beta }_{1} x_{1} +\hat{\beta }_{2} x_{2} +\cdots +\hat{\beta }_{p} x_{p} \tag{2}\] is the empirical regression equation.
If a set of \(x_{1} ,x_{2} ,\cdots ,x_{p}\) is given, a \(y\) can be obtained from equation (2), denoted as \(\hat{y}\), and \(\hat{y}\) is called a predictive value of \(y\).
For the random error \(\varepsilon\), it is often assumed: \[\label{GrindEQ__3_} E(\varepsilon )=0,Var(\varepsilon )=\sigma ^{2}. \tag{3}\] When considering a specific practical problem, if \(n\) set of monitoring data \(\left(x_{i1} ,x_{i2} ,\cdots ,x_{ip} ;y_{i} \right)\), \(i=1,2,\cdots ,n\) has been obtained, model (1) is expressed as: \[\label{GrindEQ__4_} \left\{\begin{array}{l}y_{1}=\beta_{0}+\beta_{1} x_{11}+\beta_{2} x_{12}+\cdots+\beta_{p} x_{1 p}+\varepsilon_{1} \\ y_{2}=\beta_{0}+\beta_{1} x_{21}+\beta_{2} x_{22}+\cdots+\beta_{p} x_{2 p}+\varepsilon_{2} \\ \cdots \cdots \cdots \\ y_{n}=\beta_{0}+\beta_{1} x_{n 1}+\beta_{2} x_{n 2}+\cdots+\beta_{p} x_{n p}+\varepsilon_{n}\end{array}\right. \tag{4}\] Order is: \[\label{GrindEQ__5_} \begin{cases} y=\left[\begin{array}{c} {y_{1} } \\ {y_{2} } \\ {\vdots } \\ {y_{n} } \end{array}\right],\\ X=\left[\begin{array}{cccc} {1} & {x_{11} } & {\cdots } & {x_{p1} } \\ {1} & {x_{12} } & {\cdots } & {x_{p2} } \\ {\vdots } & {\vdots } & {\ddots } & {\vdots } \\ {1} & {x_{1n} } & {\cdots } & {x_{pn} } \end{array}\right],\\ \beta =\left[\begin{array}{c} {\beta _{0} } \\ {\beta _{1} } \\ {\vdots } \\ {\beta _{p} } \end{array}\right],\\ \varepsilon =\left[\begin{array}{c} {\varepsilon _{1} } \\ {\varepsilon _{2} } \\ {\vdots } \\ {\varepsilon _{n} } \end{array}\right]. \end{cases} \tag{5}\] Then: \[\label{GrindEQ__6_} y=X\beta +\varepsilon . \tag{6}\]
Claim (4) is the matrix form of the multiple linear regression model.
To facilitate the estimation of the parameters in the model, the following basic assumptions are made about the regression equation.
Assumption 1, the independent variable \(x_{1} ,x_{2} ,\cdots ,x_{p}\) is deterministic and not random and \(rank(X)=p+1<n\), i.e., \(X\) is a full rank matrix.
Assumption 2, the Gauss-Markov condition is satisfied, viz:
\[\label{GrindEQ__7_} \begin{cases} E(\epsilon_i) = 0; i = 1, 2, \ldots, n \\ \text{Cov}(\epsilon_i, \epsilon_j) = \begin{cases} \sigma^2 & i = j \\ 0 & i \neq j \end{cases} ; i, j = 1, 2, \ldots, n. \end{cases} \tag{7}\]
Assumption 3, the normal distribution is assumed: \[\label{GrindEQ__8_} \varepsilon _{i} {\rm *}N\left(0,\sigma ^{2} \right),i=1,2,\cdots ,n . \tag{8}\]
Assumption 1 states that the independent variables in the regression problem are deterministic, and Assumption 2 states that the mean of the random error is zero and that there is no systematic error in the monitored values. The covariance of the random error term \(\varepsilon _{i}\) is zero, indicating that the random error term is uncorrelated across sample points, i.e., there is no serial correlation, and Assumption 3 qualifies that the error term is normally distributed, which is reasonable in practice.
Under the condition that the above three assumptions are satisfied, the matrix form (9) of the multiple regression model is written in the form: \[\label{GrindEQ__9_} \left\{\begin{array}{l} {y=X\beta +\varepsilon }, \\ {\varepsilon {\rm *}N\left(0,\sigma ^{2} I_{n} \right)}. \end{array}\right. \tag{9}\]
To analyze and predict using multiple linear regression models, the model parameters need to be estimated first. \(\hat{\beta }_{0} ,\hat{\beta }_{1} ,\cdots ,\hat{\beta }_{p}\) Commonly used parameter estimation methods are least squares estimation and maximum likelihood estimation, and in this paper, least squares estimation of the parameters is introduced and used.
First, a few definitions are given: The deviation of the sample monitoring value \(\left(x_{i1} ,x_{i2} ,\cdots ,x_{ip} ;y_{i} \right)\): \[\label{GrindEQ__10_} y_{i} -E\left(y_{i} \right)=y_{i} -\beta _{0} -\beta _{1} x_{i1} -\beta _{2} x_{i2} -\cdots -\beta _{p} x_{ip}. \tag{10}\] Sum of squared deviations: \[\begin{aligned} \label{GrindEQ__11_} Q\left(\beta _{0} ,\beta _{1} ,\cdots ,\beta _{p} \right) =\sum _{i=1}^{n}\left(y_{i} -\beta _{0} -\beta _{1} x_{i1} -\beta _{2} x_{i2} -\cdots -\beta _{p} x_{ip} \right)^{2}. \end{aligned} \tag{11}\] The so-called least squares estimate \(\hat{\beta }_{0} ,\hat{\beta }_{1} ,\cdots ,\hat{\beta }_{p}\) of \(\beta _{0} ,\beta _{1} ,\cdots ,\beta _{p}\) is the one that minimizes \(\beta _{0} ,\beta _{1} ,\cdots ,\beta _{p}\) by making \(Q\left(\beta _{0} ,\beta _{1} ,\cdots ,\beta _{p} \right)\), i.e., the estimate \(\hat{\beta }_{0} ,\hat{\beta }_{1} ,\cdots ,\hat{\beta }_{p}\) is required to satisfy: \[\begin{aligned} \label{GrindEQ__12_} {Q\left(\hat{\beta }_{0} ,\hat{\beta }_{1} ,\cdots ,\hat{\beta }_{p} \right)} {=} {\sum _{i=1}^{n}\left(y_{i} -\hat{\beta }_{0} -\hat{\beta }_{1} x_{i1} -\hat{\beta }_{2} x_{i2} -\cdots -\hat{\beta }_{p} x_{ip} \right)^{2} }. \end{aligned} \tag{12}\]
At this point, \(\hat{\beta }_{0} ,\hat{\beta }_{1} ,\cdots ,\hat{\beta }_{p}\) is said to be the least squares estimate of the regression parameter \(\beta _{0} ,\beta _{1} ,\cdots ,\beta _{p}\).
The above process can be realized by the method of finding the extremes in multivariable calculus, and the specific calculation will not be repeated in this paper. The formula for the least squares estimation coefficient is: \[\label{GrindEQ__13_} \hat{\beta }=\left(X^{T} X\right)^{-1} X^{T} y. \tag{13}\]
Once the estimates of the regression parameters are obtained, the dependent variable \(y\) can be predicted by the empirical regression equation expressed in equation (13).
Consider the test hypothesis of the model: \[\label{GrindEQ__14_} H_{0} :H\beta =c, \tag{14}\] where \(X\) is a matrix of \(n\times (p+1)\), and \(rank(X)=p+1\), \(H\) are matrices of \(q\times (p+1)\), and \(rank(H)=q\), \(c\) are \(q\)-dimensional vectors.
The test statistic that can be used as a test of hypothesis \(H_{0}\) can be expressed as follows: \[\begin{aligned} \label{GrindEQ__15_} F =\frac{(H\hat{\beta }-c){'} \left[H\left(X{'} X\right)^{-1} H{'} \right]^{-1} (H\hat{\beta }-c)}{S_{E} }s \frac{n-p-1}{q} =F(q,n-p-1) , \end{aligned} \tag{15}\] where \(S_{E}\) is the sum of squares of residuals, i.e. \(S_{E} =\sum _{i=1}^{n}\left(y_{i} -\hat{y}_{i} \right)^{2}\).
The test of significance of the regression equation leads to the hypothesis: \[\label{GrindEQ__16_} H_{0} :\beta _{1} =\beta _{2} =\cdots =\beta _{p} =0 . \tag{16}\] If \(H_{0}\) is accepted, it shows that it is not appropriate to use model (17) to represent the relationship between \(y\) and the independent variable \(x_{1} ,x_{2} ,\cdots ,x_{p}\). In order to establish a statistic for testing \(H_{0}\)’s, it is necessary to take the appropriate \(H\) and \(c\) in (17), and it is clear that \(H=\left(0,I_{p} \right),c=0\) will suffice. In this case, the test statistic is: \[\label{GrindEQ__17_} F=\frac{\frac{S_{R} }{p} }{\frac{S_{E} }{n-p-1} } {\rm =}F(p,n-p-1) , \tag{17}\] where \(S_{R} =\sum _{i=1}^{n}\left(\hat{y}_{i} -\bar{y}\right)^{2} ,S_{E} =\sum _{i=1}^{n}\left(y_{i} -\hat{y}_{i} \right)^{2}\).
For the given data \(\left(x_{i1} ,x_{i2} ,\cdots ,x_{ip} ;y_{i} \right),i=1,2,\cdots ,n\), the value of the \(F\) statistic is calculated, and then from the given level of significance \(\alpha\), the table of \(F\) distribution is checked to obtain the critical value \(F_{\alpha } (p,n-p-1)\). If \(F>F_{\alpha } (p,n-p-1)\), then it is considered to be below the level of significance, \(y\) there is a significant linear relationship with the independent variable \(x_{1} ,x_{2} ,\cdots ,x_{p}\), i.e., the regression equation is significant. On the contrary, the equation is considered insignificant.
The significance test of the independent variables is a statistical test to check whether the independent variables of the model have a significant effect on the dependent variable at a certain level of significance. For the multiple linear regression model, the overall linear relationship of the regression equation is significant, which does not mean that the effect of each independent variable on the dependent variable is significant. Therefore, it is necessary to test the significance of each independent variable, so that the independent variables that do not have a significant effect on \(y\) can be eliminated from the model, and only those that have a significant effect on it are retained, in order to build a simpler and more reasonable multiple linear regression model.
Obviously, if an independent variable \(x_{j}\) is not significant on \(y\), then its coefficient \(\beta _{j}\) can take the value of 0 in the regression model. testing whether variable \(x_{j}\) is significant is therefore equivalent to testing the hypothesis: \[\label{GrindEQ__18_} H_{0j} :\beta _{j} =0 . \tag{18}\] If Hypothesis \(H_{0j}\) is accepted, then \(x_{j}\) is not significant and conversely, \(x_{j}\) is significant.
The test statistic that can be used as a test for hypothesis \(H_{0j}\) can be expressed as follows. \[\label{GrindEQ__19_} t_{j} =\frac{\hat{\beta }_{j} -\beta _{j} }{\sqrt{c_{ij} } \cdot \sqrt{\frac{1}{n-p-1} S_{E} } } t(n-p-1) . \tag{19}\] \(t_{j} =\frac{\hat{\beta }_{j} }{\sqrt{c_{jj} } \hat{\sigma }}\) under the condition that \(H_{0j}\) holds, where \(\hat{\sigma }=\sqrt{\frac{S_{E} }{n-p-1} }\) is the standard deviation of the regression. Check the two-sided test critical value \(t_{\alpha /2} (n-p-1)\) and reject hypothesis \(H_{0}\) when \(\left|t_{j} \right|\ge t_{\alpha /2} (n-p-1)\).
Once a robust model has been developed, it can be utilized for various purposes, including analysis, control, and prediction. It is paramount to underscore the necessity of validating the assumptions underlying the model prior to conducting any analysis. In the context of regression analysis, this process often follows a cyclical pattern, wherein the regression outputs are iteratively employed for diagnostic purposes, hypothesis testing, model selection, and, if necessary, refinement of the regression inputs. This iterative approach may necessitate multiple rounds until a satisfactory outcome is achieved, signifying that the resulting model not only adheres to the initial assumptions but also aligns consistently with the observed data.
In multiple linear regression analysis, when the variance of the regression equation \(\hat{y}=\hat{\beta }_{0} +\hat{\beta }_{1} x_{1} +\hat{\beta }_{2} x_{2} +\cdots +\hat{\beta }_{k} x_{k}\) is statistically significant for the test, the prediction of the value of the dependent variable \(y\) can be achieved relatively easily by the variance of the regression equation in a similar way as in the case of linear regression with the same element.
First assume that the prediction point is \(x_{0} =\left(x_{01} ,x_{02} ,\cdots ,x_{0k} \right)^{T}\), then \[\label{GrindEQ__20_} \widehat{y_{0} }=\hat{\beta }_{0} +\hat{\beta }_{1} x_{01} +\hat{\beta }_{2} x_{02} +\cdots +\hat{\beta }_{k} x_{0k} . \tag{20}\] It’s right \[\label{GrindEQ__21_} E\left(y_{0} \right)=\beta _{0} +\beta _{1} x_{01} +\beta _{2} x_{02} +\cdots +\beta _{k} x_{0k}. \tag{21}\] The point estimate is also the right one: \[\label{GrindEQ__22_} y_{0} =\beta _{0} +\beta _{1} x_{01} +\beta _{2} x_{02} +\cdots +\beta _{k} x_{0k} +\varepsilon _{0} \left(\varepsilon _{0} \sim N\left(0,\sigma ^{2} \right)\right) \tag{22}\] of the point estimate. And the statistics can be proved: \[\label{GrindEQ__23_} t=\frac{y_{0} -\hat{y}_{0} }{\hat{\sigma }_{\Delta }^{*} } \sim t(n-p-1) . \tag{23}\] Among them \[\label{GrindEQ__24_} \begin{cases} \hat{\sigma }^{*_{2} } =\frac{SSE}{n-p-1} ,\\ \Delta =\sqrt{1+\frac{1}{n} +\sum _{i=1}^{p}\sum _{i=1}^{p}\left(x_{0i} -\overline{x_{i} }\right) \left(x_{0j} -\overline{x_{j} }\right)c_{ij} } . \end{cases} \tag{24}\] \[\label{GrindEQ__25_} \overline{x_{i} }=\frac{1}{n} \sum _{k=1}^{n}x_{ki} {\rm \; \; \; \; }(i=1,2,\cdots ,p). \tag{25}\] Thus, the marginal error of the point prediction is \(\pm t_{1-\frac{\alpha }{2} } (n-p-1)\hat{\sigma }^{*} \Delta\), i.e., the interval prediction at \(x_{0}\) is: \[\label{GrindEQ__26_} \left(\hat{y}_{0} -t_{1-\frac{\alpha }{2} } (n-p-1)\hat{\sigma }^{*} \Delta +t_{1-\frac{\alpha }{2} } (n-p-1)\hat{\sigma }^{*} \Delta \right) . \tag{26}\] To wit \[\begin{aligned} \label{GrindEQ__27_} p \left\{\hat{y}_{0} -t_{1-\frac{\alpha }{2} } (n-p-1)\hat{\sigma }^{*} \Delta \right. \left.+t_{1-\frac{\alpha }{2} } (n-p-1)\hat{\sigma }^{*} \Delta \right\}\ge 1-\alpha . \end{aligned} \tag{27}\] When \(n\) is larger and \(x_{0i} \approx \overline{x_{i} }(i=1,2,\cdots ,p)\), \(\Delta =1\) can be taken to simplify the calculation.
This study focuses on 500 civil aviation majors enrolled at College G, examining their proficiency in service etiquette training content through a regression analysis model. Furthermore, the impact of service etiquette training on the employment prospects and salary outcomes of these students is investigated. Table 1 presents the relationship between grade level and the degree of knowledge mastery, as evidenced by a statistically significant chi-square test result (P \(\mathrm{<}\) 0.05), indicating a notable correlation between vocational skills training proficiency and academic year. An analysis of the table reveals that first-year students exhibit a 86.67% rate of complete or basic mastery, closely followed by third-year students with 84.85%. Notably, first- and third-year students demonstrate superior knowledge mastery compared to their peers, whereas the proficiency levels among students in other grades, particularly those in their final year, are comparatively lower. This disparity may stem from the heightened job-seeking pressures faced by fourth-year students, who consequently have limited time and resources to dedicate to academic pursuits.
| The grade affects the knowledge of knowledge | Total | ||||
| Be in a position | Basically | Master part | Can’t understand | ||
| Freshman year | 44 | 86 | 18 | 2 | 150 |
| 29.33% | 57.33% | 12.00% | 1.33% | 100% | |
| Sophomore | 34 | 35 | 12 | 2 | 83 |
| 40.96% | 42.17% | 14.46% | 2.41% | 100% | |
| Junior | 35 | 21 | 8 | 2 | 66 |
| 53.03% | 31.82% | 12.12% | 3.03% | 100% | |
| Senior year | 36 | 23 | 14 | 2 | 75 |
| 48% | 30.66% | 18.66% | 2.66% | 100% | |
| Total | 149 | 165 | 52 | 8 | 374 |
| 39.84 | 44.12 | 13.9 | 2.14 | 100 | |
Table 2 illustrates the influence of various training modes on the degree of knowledge mastery among students. Analysis of the table reveals that on-site instruction and demonstration education yield superior outcomes in terms of students’ knowledge mastery, with 92.59% and 89.11% of students achieving complete and basic mastery, respectively. This observation can be attributed to the fact that on-site guidance and demonstration education represent more traditional training methods, which students transitioning from campus education to vocational skills education are more accustomed to and thus find easier to assimilate. Conversely, while network distance education offers access to more advanced and specialized training, it suffers from limitations such as reduced student engagement and lower levels of acceptance, potentially due to distractions inherent in screen-based learning environments.
| Training methods affects the knowledge of knowledge | Total | ||||
| Be in a position | Basically | Master part | Can’t understand | ||
| Field guidance | 69 | 56 | 8 | 2 | 135 |
| 51.11 | 41.48 | 5.93 | 1.48 | 100 | |
| Demonstration education | 84 | 55 | 15 | 2 | 156 |
| 53.85 | 35.26 | 9.61 | 1.28 | 100 | |
| Classroom lecture | 65 | 51 | 8 | 2 | 126 |
| 51.59 | 40.47 | 6.35 | 1.59 | 100 | |
| Online education | 76 | 53 | 9 | 2 | 140 |
| 54.28 | 37.86 | 6.43 | 1.43 | 100 | |
| Total | 294 | 215 | 40 | 8 | 557 |
| 52.78 | 38.60 | 7.18 | 1.44 | 100 | |
Table 3 presents the influence of various training methods on income enhancement. Notably, 86.62% of respondents affirmed that on-site instruction has a significant positive impact on income enhancement, while 84.89% concurred that demonstration education also significantly contributes to higher income. These findings underscore the direct correlation between the chosen training method and its effectiveness in promoting skill development. As previously analyzed, the mode of training has a substantial relationship with the level of knowledge acquisition. Consequently, the disparity in training approaches reveals a prevalent belief among participants that on-site instruction and practical, hands-on training are more effective in refining skills, ultimately leading to an improvement in students’ income.
| Income promotion | Total | |||
| Apparent ascension | Unknown | Bad judgment | ||
| Field guidance | 123 | 10 | 9 | 142 |
| 86.62 | 7.04 | 6.34 | 100 | |
| Demonstration education | 118 | 13 | 8 | 139 |
| 84.89 | 9.35 | 5.76 | 100 | |
| Classroom lecture | 115 | 11 | 9 | 135 |
| 85.19 | 8.15 | 6.67 | 100 | |
| Online education | 123 | 12 | 6 | 141 |
| 87.23 | 8.51 | 4.26 | 100 | |
| Total | 479 | 46 | 32 | 557 |
| 86.00 | 8.26 | 5.75 | 100 | |
Utilizing the panel data from the 2018 and 2019 Employment Mobility Surveys conducted among Civil Aviation Students in China, we initially examine the employment outcomes of students who have undergone training. To account for potential variations in students’ individual characteristics, we implement the maximum likelihood estimation method to regress the students’ employment equations. Through this approach, we aim to comprehensively analyze the effects of various factors on students’ employment prospects.
Table 4 presents the regression outcomes pertaining to the student employment equation. The analysis reveals that while the explanatory variables exert a similar directional influence on the employment prospects of diverse student groups, there are notable variations in the magnitude of these effects. Specifically, this paper emphasizes the positive and significant coefficients observed for the general training cross-term (0.1635) and the specialized training cross-term (0.8845), signifying that both types of training contribute positively to student employment. Notably, the specialized training cross-term coefficient surpasses that of general training, suggesting that students who undergo specialized training are more likely to enhance their employment prospects compared to those receiving general training.Furthermore, under the assumption of constant values for other explanatory variables, our analysis estimates that general training contributes to an approximately 3.67% increase in the overall employment rate among students. In contrast, specialized training yields a more substantial boost, enhancing employment by roughly 5.59%. These findings highlight the potential advantages of targeted, specialized training programs in fostering favorable employment outcomes for students.
Regarding the influence of additional variables on students’ employment outcomes, the regression analysis reveals a significantly positive coefficient of 0.1033 for the variable “years of education,” suggesting that an increase in the number of years of education positively correlates with an elevated rate of student employment. Similarly, the coefficient for the variable “work experience” is significant at 0.2457, indicating that accumulated work experience enhances the likelihood of student employment. In terms of the “marginal effect” of education, the estimated return on education for student employment is approximately 3.35%, implying that each additional year of education contributes to a notable improvement in employment prospects. Overall, these regression results are consistent with both economic realities and theoretical expectations, underlining the validity and appropriateness of the study’s methodological framework.
| Interpretation variable | Employment inflow | Employment outflow | ||
| Coefficient | Marginal effect | Coefficient | Marginal effect | |
| Experimental group | 0.4756*** | 0.0724*** | 0.8845*** | 0.0415*** |
| Cross term | 0.1635*** | 0.0346*** | 0.1668*** | 0.0559*** |
| Education life | 0.1033* | 0.0335* | 0.2918* | 0.0486* |
| Work experience | 0.2457*** | 0.0457*** | 0.2536*** | 0.0489*** |
| Comprehensive ability | 0.1218*** | 0.0289*** | 0.1159*** | 0.0138*** |
| Constant term | 0.1589 | 0.0263 | 0.1526 | 0.0246 |
| LR chi2(13) | 0.0815*** | 0.0129*** | 0.0812*** | 0.0129*** |
| Prob\(\mathrm{>}\)chi2 | 0.1119*** | 0.0115*** | 0.1018*** | 0.0169*** |
| Log likelihood | 1.3368*** | 0.2239*** | 1.3356*** | 0.2138*** |
| Pseudo R\(^2\) | 0.8938*** | 0.1419*** | 0.8818*** | 0.1445*** |
The results of the regression analyses examining the impact of general training on changes in student employment are presented in Table 5, while those pertaining to specialized training are detailed in Table 6. Both models demonstrate that general training and specialized training significantly contribute to enhancing the inflow of student employment and mitigating the outflow. Notably, the positive effect of general training on employment inflow is estimated at approximately 4.69%, highlighting its substantial contribution. Conversely, the negative impact of specialized training on employment outflow, estimated at roughly 5.56%, surpasses that of general training, suggesting that specialized training is more effective in curbing job losses among employed students. This disparity can primarily be attributed to the relatively higher level of specialization in knowledge and skills imparted by specialized training, which equips students with a more targeted skillset that enhances their retention in the workforce.
| Interpretation variable | Employment inflow | Employment outflow | ||
| Coefficient | Marginal effect | Coefficient | Marginal effect | |
| Training | 0.0469*** | 0.0298*** | -0.0245*** | -0.0219*** |
| Education life | 0.0223*** | 0.0053*** | -0.2268*** | -0.039*** |
| Work experience | 0.7916*** | 0.1129*** | -0.1928*** | -0.0389*** |
| Comprehensive ability | 0.5936*** | 0.0857*** | -0.9485*** | -0.1639*** |
| Constant term | 0.0221 | 0.5978 | ||
| Sample size | 500 | 500 | ||
| Interpretation variable | Employment inflow | Employment outflow | ||
| Coefficient | Marginal effect | Coefficient | Marginal effect | |
| Training | 0.1065** | 0.0146** | -0.0556*** | -0.0357*** |
| Education life | 0.0657** | 0.0055** | -0.2154*** | -0.0375*** |
| Work experience | 0.7842*** | 0.1142*** | -0.1621** | -0.02712** |
| Comprehensive ability | 0.4875** | 0.062** | -0.9123*** | -0.1518*** |
| Constant term | 0.0512 | -0.5445 | ||
| Sample size | 500 | 500 | ||
The likelihood estimation method was employed to estimate the decision equation for assessing the effectiveness of both general and specialized training. Table 7 presents the influencing factors that contribute to the training effectiveness. The regression analysis reveals that the coefficients associated with the influence of training objectives on the effectiveness of general and specialized training are 0.1469 and 0.2778, respectively. These findings suggest that the clearer the training objectives are defined, the more inclined students are to engage in the training programs, resulting in enhanced training outcomes. Furthermore, the duration of specialized training exhibits a significantly positive relationship with both years of education and work experience. This observation can be attributed to the fact that students with longer educational and work backgrounds tend to possess greater capabilities, making it easier for them to comprehend and assimilate the training content. In the same way, the impact of education, experience and comprehensive ability on students’ acceptance of general training results is also significant. The above regression results are generally in line with the expectations of economic theory, suggesting that the setting of the equation for the effect of training is reasonable.
| Interpretation variable | General training | Special training |
| Training target | 0.1469*** | 0.2778*** |
| Education life | 0.9159*** | 0.8387*** |
| Work experience | 0.3568*** | 0.4576*** |
| Comprehensive ability | 0.1196*** | 0.4589*** |
| Constant term | 0.3439*** | 0.3796*** |
| Sample size | 500 | |
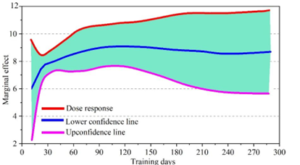
Based on the regression analysis of the income equation, we have derived estimates for the starting salary levels at varying durations of general training. In this study, we present the effect curves illustrating the relationship between the starting salary level and the timing of receipt of general training. Specifically, Figure 2 depicts the dose-response function curve, illustrating how the duration of general training influences the starting salary. Figure 3, on the other hand, shows the treatment effect function curve, which highlights the impact of the number of days spent on general training on the starting salary. Our analysis reveals that general training positively contributes to the income level of students. Notably, as the duration of training increases, the marginal effect of additional training on student earnings diminishes. Within the first 40 days of training, the income level of students consistently rises, with the starting salary increasing from 4.5 to 8 units, representing a substantial 77.8% increase. This underscores the significant income-enhancing effect of general training within this initial period. However, beyond 40 days, the impact of additional training duration on students’ earnings plateaus.
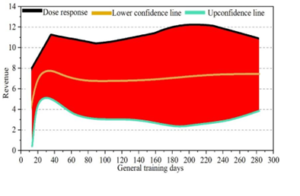

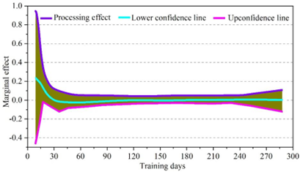
Figure 4 depicts the dose-response function curve for specialized training, while Figure 5 illustrates the income effect curve associated with the duration of students’ specialized training. As the training duration extends, the marginal effect of additional training time on students’ income diminishes. Specifically, within the first 120 days of specialized training, the income level of students consistently rises, with the starting salary increasing from 6 to 9 units, representing a notable 50% increase. Beyond 120 days, the marginal impact of specialized training tends to plateau, suggesting that an optimal duration for specialized training for students is approximately 120 days, and that excessive specialized training does not significantly contribute to further increases in students’ income.
In this paper, we studied the content of service etiquette training for Chinese civil aviation students, and based on the regression analysis model, we investigated the impact of service etiquette training on the career development of Chinese civil aviation students, and the main conclusions are as follows:
According to the chi-square test, P\(\mathrm{<}\)0.05, that is, there is a significant relationship between the degree of knowledge mastery of vocational skills training and the grade level, and the degree of knowledge mastery of freshmen and sophomore students is better.
Among the training methods, students’ knowledge mastery is better under on-site instruction and demonstration education methods, with the favorable proportion of 92.59% and 82.11% respectively, followed by classroom instruction and online education.
The impact coefficients of general training and specialized training on students’ employment prospects were found to be 0.1635 and 0.8845, respectively, both of which were statistically significant and positive. This signifies that both forms of training positively influence students’ employment outcomes, with specialized training exhibiting a notably stronger promotional effect than general training. Furthermore, our analysis revealed that service etiquette training has a positive promotional effect on students’ salary levels.


